OPEN-SOURCE SCRIPT
已更新 EMA Levels, Multi-Timeframe

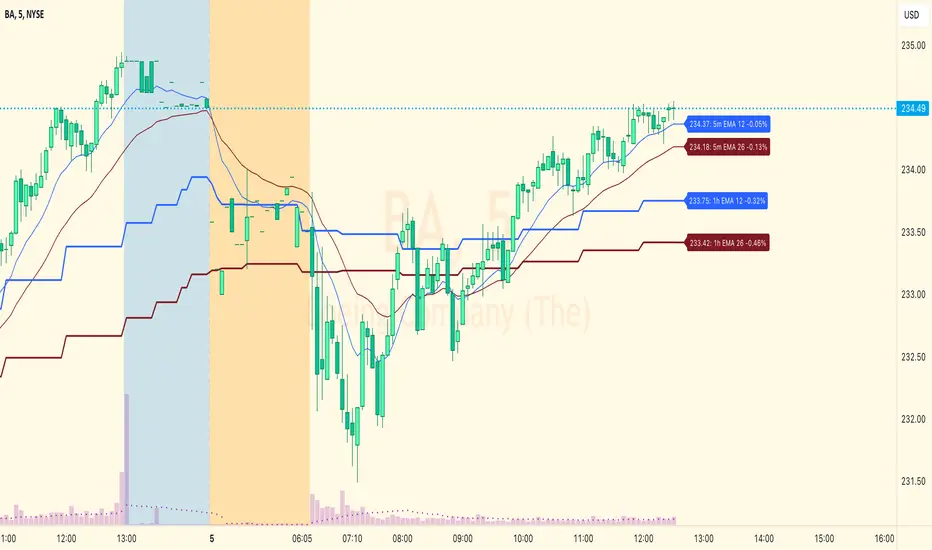
The exponential moving average (EMA) tracks price over time, giving more importance to recent price data than simple moving average (SMA). EMAs for larger timeframes are generally considered to be stronger supports/resistances for price to move through than smaller timeframes. This indicator allows you to specify two different EMA lengths that you want to track. Additionally, this indicator allows you to display not just the EMA levels of your currently viewed timeframe on the chart, but also shows the EMA levels of up to 4 different timeframes on the same chart. This allows you to quickly see if multiple EMA levels are aligning across different timeframes, which is an even stronger indication that price is going to meet support or resistance when it meets those levels on the chart. There are a lot of nice configuration options, like:
- Ability to customize the EMA lengths you want to track
- Style customization (color, thickness, size)
- Hide any timeframes/levels you aren't interested in
- Labels on the chart so you can tell which plots are the EMA levels
- Optionally display the plot as a horizontal line if all you care about is the EMA level right now
發行說明
Modified script to optionally switch to simple moving averages instead of exponential moving averages. Changed all associated labels, etc. 發行說明
Overhaul of entire indicator that brings it up to date with the following improvements:- Fixed bug that caused lower timeframe MAs to calculate incorrectly when on the daily timeframe and above
- Improved performance (fewer request.security calls)
- Updated to use our standardized libraries
- Improved configuration & appearance
發行說明
Code cleanup發行說明
A couple of minor improvements:- Added smoother lines for higher timeframe plots with "Gaps" option.
- Added option to hide lower timeframe plots when on higher timeframe charts.
發行說明
Bugfix: SMA levels were not calculating correctly.開源腳本
秉持TradingView一貫精神,這個腳本的創作者將其設為開源,以便交易者檢視並驗證其功能。向作者致敬!您可以免費使用此腳本,但請注意,重新發佈代碼需遵守我們的社群規範。
I release TradingView indicators and libraries designed to make you a better trader. For detailed info about them, head over to improve.trading
免責聲明
這些資訊和出版物並非旨在提供,也不構成TradingView提供或認可的任何形式的財務、投資、交易或其他類型的建議或推薦。請閱讀使用條款以了解更多資訊。
開源腳本
秉持TradingView一貫精神,這個腳本的創作者將其設為開源,以便交易者檢視並驗證其功能。向作者致敬!您可以免費使用此腳本,但請注意,重新發佈代碼需遵守我們的社群規範。
I release TradingView indicators and libraries designed to make you a better trader. For detailed info about them, head over to improve.trading
免責聲明
這些資訊和出版物並非旨在提供,也不構成TradingView提供或認可的任何形式的財務、投資、交易或其他類型的建議或推薦。請閱讀使用條款以了解更多資訊。