OPEN-SOURCE SCRIPT
RSIBands with BB
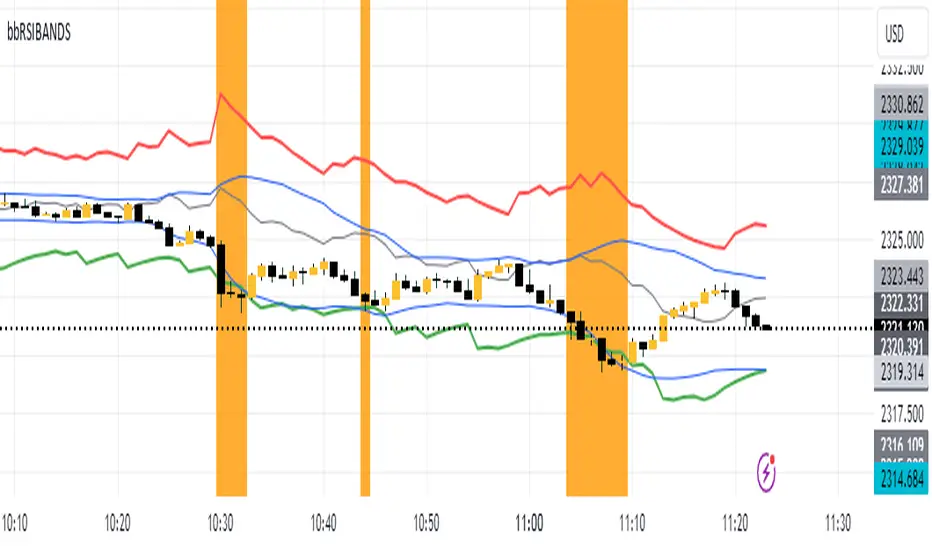
This indicator combines three popular technical analysis tools:
RSI Bands: These bands are based on the Relative Strength Index (RSI) and visually represent overbought and oversold zones. The indicator plots upper and lower bands calculated using a user-defined RSI level and highlights potential buying and selling opportunities near these zones.
Bollinger Bands: These bands depict volatility with a moving average (basis line) and upper and lower bands at a user-defined standard deviation away from the basis line. Narrowing bands suggest potential breakouts, while widening bands indicate increased volatility.
Williams Fractals (with Confirmation): This custom function identifies potential reversal points based on price action patterns. The indicator highlights buy/sell signals when a confirmed fractal forms (previous fractal and price crossing a Bollinger Band).
Key Features:
User-defined parameters: You can adjust the RSI level, Bollinger Band standard deviation, and fractal period according to your trading strategy.
Visual confirmation: The indicator highlights confirmed buy/sell signals based on fractal patterns and price crossing Bollinger Bands.
Flexibility: This indicator provides a combination of trend, volatility, and reversal identification tools, allowing for a multi-faceted approach to technical analysis.
How to Use:
Add the indicator to your chart.
Adjust the RSI level, Bollinger Band standard deviation, and fractal period based on your preference.
Look for buy signals when a green background appears and there's a confirmed up fractal (upward triangle) with the price crossing above the upper Bollinger Band.
Look for sell signals when a red background appears and there's a confirmed down fractal (downward triangle) with the price crossing below the lower Bollinger Band.
Disclaimer:
This indicator is for informational purposes only and should not be considered financial advice. Always conduct your own research and due diligence before making any trading decisions.
開源腳本
秉持TradingView一貫精神,這個腳本的創作者將其設為開源,以便交易者檢視並驗證其功能。向作者致敬!您可以免費使用此腳本,但請注意,重新發佈代碼需遵守我們的社群規範。
免責聲明
這些資訊和出版物並非旨在提供,也不構成TradingView提供或認可的任何形式的財務、投資、交易或其他類型的建議或推薦。請閱讀使用條款以了解更多資訊。
免責聲明
這些資訊和出版物並非旨在提供,也不構成TradingView提供或認可的任何形式的財務、投資、交易或其他類型的建議或推薦。請閱讀使用條款以了解更多資訊。