OPEN-SOURCE SCRIPT
Morning & Evening Star
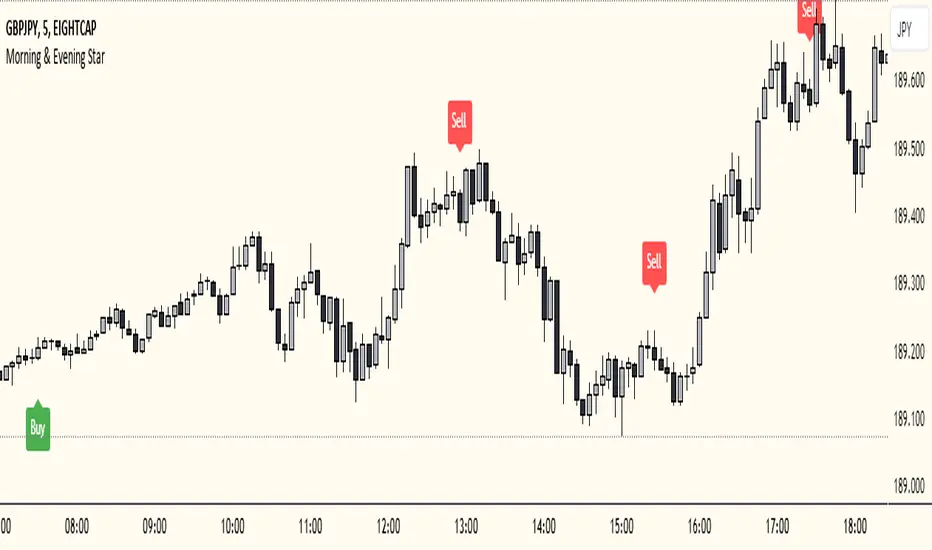
This Pine Script code is designed to identify Morning Star and Evening Star candlestick patterns on a chart. Here's how it works:
Calculate Candle Body and Wick Sizes: The script calculates the size of the candle body and wick based on the difference between the close and open prices, as well as the difference between the high and the maximum of the close and open prices.
Determine if the Candle is a Doji: It checks if the candle is a doji by comparing the size of the body to a fraction of the wick size. If the body size is less than or equal to 20% of the wick size, it is considered a doji.
Determine if the Current Candle is Bullish or Bearish: It checks if the current candle is bullish (close price is higher than open price) or bearish (close price is lower than open price).
Plot Shapes for Doji and Candles: It plots shapes on the chart to indicate buy and sell signals based on the presence of a doji and the formation of Morning Star or Evening Star patterns. These shapes are displayed below (for buy signals) or above (for sell signals) the respective candlesticks.
Combine this indicator with my support and resistance zones indicator for better results
開源腳本
秉持TradingView一貫精神,這個腳本的創作者將其設為開源,以便交易者檢視並驗證其功能。向作者致敬!您可以免費使用此腳本,但請注意,重新發佈代碼需遵守我們的社群規範。
免責聲明
這些資訊和出版物並非旨在提供,也不構成TradingView提供或認可的任何形式的財務、投資、交易或其他類型的建議或推薦。請閱讀使用條款以了解更多資訊。
開源腳本
秉持TradingView一貫精神,這個腳本的創作者將其設為開源,以便交易者檢視並驗證其功能。向作者致敬!您可以免費使用此腳本,但請注意,重新發佈代碼需遵守我們的社群規範。
免責聲明
這些資訊和出版物並非旨在提供,也不構成TradingView提供或認可的任何形式的財務、投資、交易或其他類型的建議或推薦。請閱讀使用條款以了解更多資訊。