OPEN-SOURCE SCRIPT
Emas cryptosmart
## General Summary
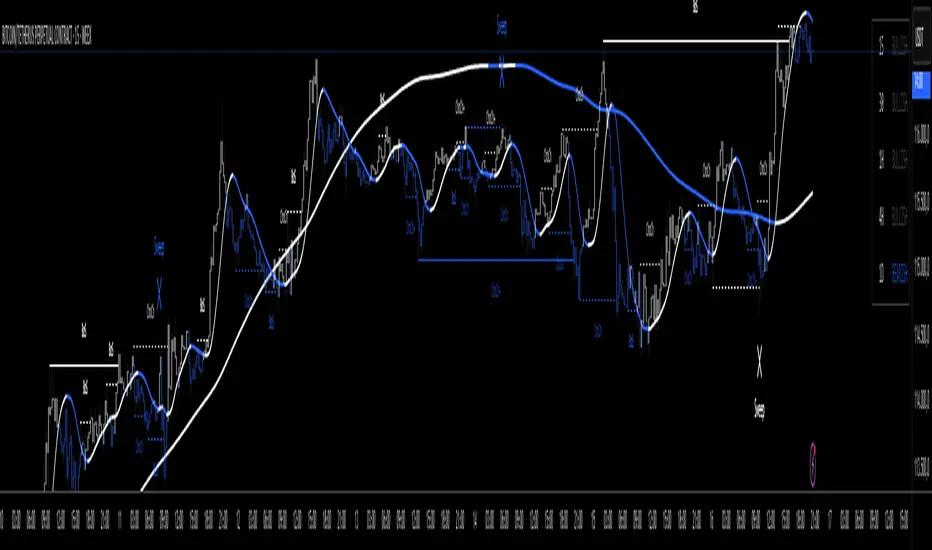
The Emas cryptosmart indicator is a technical analysis tool designed to provide a clear and comprehensive view of the market trend. It combines a long-term Hull Moving Average (HMA) to establish the overall trend with a faster, more responsive Triple Hull Moving Average (THMA) to identify short-term momentum.
Its primary feature is the dynamic candle coloring, which offers immediate visual cues about price direction, simplifying trading decisions.
## Indicator Components
This indicator is composed of two main lines:
Hull 200 (HMA): The Long-Term Trend Anchor
This line (dynamic lime/red by default) acts as a filter for the main market trend. Due to its 200-period setting, it moves smoothly and establishes the general context.
Uptrend: When the Hull 200 is rising (lime color), it indicates the macro trend is bullish.
Downtrend: When it is falling (red color), the macro trend is bearish.
THMA 55: The Short-Term Momentum Line
This line (dynamic aqua/orange by default) is a Triple Hull Moving Average. It is extremely fast and sensitive to recent price changes, designed to capture immediate momentum.
This is the key line for the candle coloring and for identifying potential entry or exit points.
## How to Interpret It
The primary strategy is to use the Hull 200 to define the direction for your trades and the THMA 55 to fine-tune your timing.
Candle Coloring (Main Signal):
Bullish Candles (default: aqua): When the price closes above the THMA 55, the candles turn to a bullish color. This signals that immediate momentum is positive and can be considered a buy signal or confirmation to stay in a long position.
Bearish Candles (default: orange): When the price closes below the THMA 55, the candles turn to a bearish color. This indicates that immediate momentum is negative, suggesting a potential sell or an exit from a long position.
Confluence Strategy:
The highest-probability signals occur when both moving averages are aligned.
Strong Buy Example: Look for a situation where the Hull 200 is rising (lime color) and wait for the candles to turn bullish as the price crosses above the THMA 55.
Strong Sell Example: Look for a situation where the Hull 200 is falling (red color) and wait for the candles to turn bearish as the price crosses below the THMA 55.
## Key Features
Visual Clarity: Automatic candle coloring eliminates the need to constantly interpret crosses, allowing for a quick read of the market's state.
Dual Perspective: Offers a balanced view by combining a slow trend indicator with a fast momentum indicator.
Reduced Lag: The use of Hull variants minimizes the delay typical of conventional moving averages (SMAs/EMAs).
Fully Customizable: All colors, for both the lines and the candles, can be adjusted in the settings menu to fit your visual style.
開源腳本
秉持TradingView一貫精神,這個腳本的創作者將其設為開源,以便交易者檢視並驗證其功能。向作者致敬!您可以免費使用此腳本,但請注意,重新發佈代碼需遵守我們的社群規範。
免責聲明
這些資訊和出版物並非旨在提供,也不構成TradingView提供或認可的任何形式的財務、投資、交易或其他類型的建議或推薦。請閱讀使用條款以了解更多資訊。
開源腳本
秉持TradingView一貫精神,這個腳本的創作者將其設為開源,以便交易者檢視並驗證其功能。向作者致敬!您可以免費使用此腳本,但請注意,重新發佈代碼需遵守我們的社群規範。
免責聲明
這些資訊和出版物並非旨在提供,也不構成TradingView提供或認可的任何形式的財務、投資、交易或其他類型的建議或推薦。請閱讀使用條款以了解更多資訊。