OPEN-SOURCE SCRIPT
Supp_Ress_V1
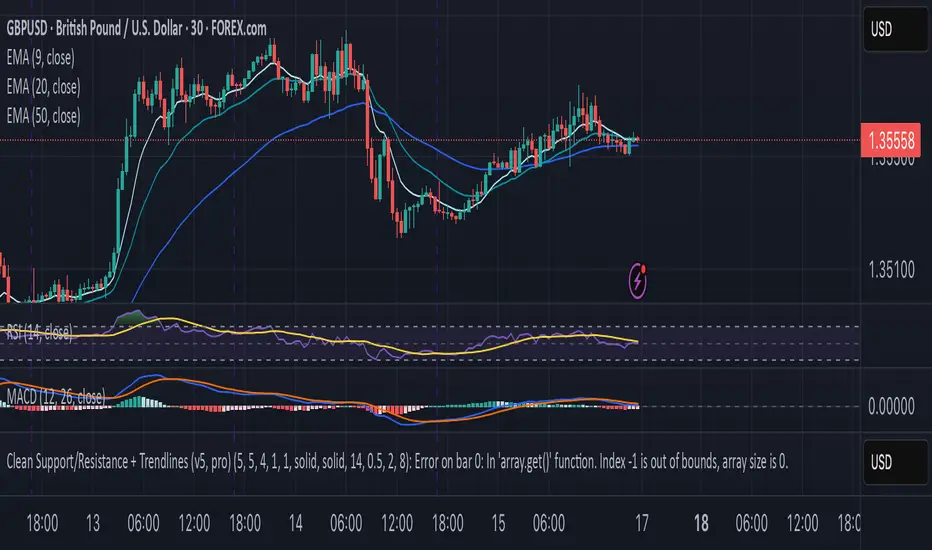
This indicator automatically plots support and resistance levels using confirmed pivot highs and lows, then manages them smartly by merging nearby levels, extending them, and removing them once price breaks through.
It also draws trendlines by connecting valid higher-lows (uptrend) or lower-highs (downtrend), ensuring they slope correctly and have enough spacing between pivots.
In short: it gives you a clean, trader-like map of the most relevant S/R zones and trendlines, updating dynamically as price action unfolds.
開源腳本
秉持TradingView一貫精神,這個腳本的創作者將其設為開源,以便交易者檢視並驗證其功能。向作者致敬!您可以免費使用此腳本,但請注意,重新發佈代碼需遵守我們的社群規範。
免責聲明
這些資訊和出版物並非旨在提供,也不構成TradingView提供或認可的任何形式的財務、投資、交易或其他類型的建議或推薦。請閱讀使用條款以了解更多資訊。
開源腳本
秉持TradingView一貫精神,這個腳本的創作者將其設為開源,以便交易者檢視並驗證其功能。向作者致敬!您可以免費使用此腳本,但請注意,重新發佈代碼需遵守我們的社群規範。
免責聲明
這些資訊和出版物並非旨在提供,也不構成TradingView提供或認可的任何形式的財務、投資、交易或其他類型的建議或推薦。請閱讀使用條款以了解更多資訊。