OPEN-SOURCE SCRIPT
SMA, 20%UP, 20% SMA, LTH new
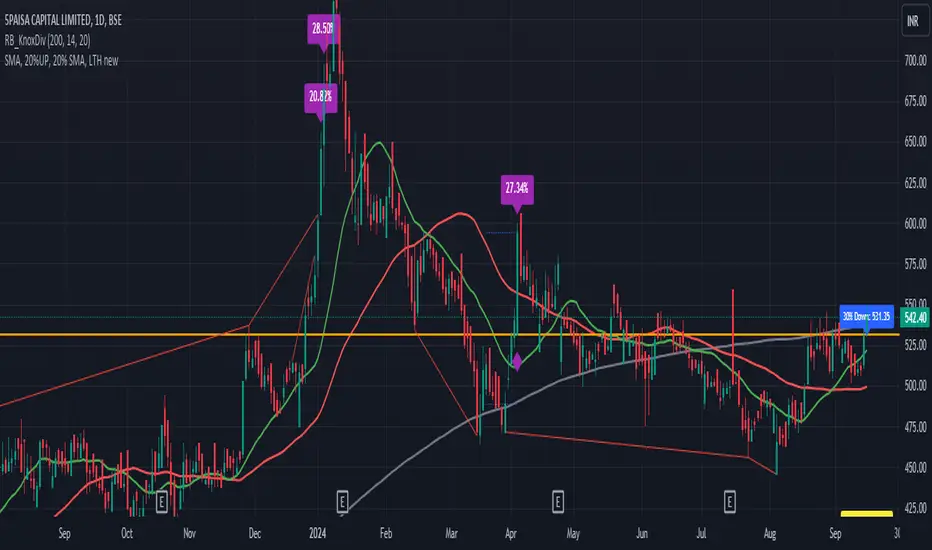
Features:
Simple Moving Averages (SMAs):
200 SMA (Gray): Long-term trend indicator. A widely used benchmark in many trading strategies.
50 SMA (Red): Mid-term trend indicator.
20 SMA (Green): Short-term trend indicator. These three SMAs allow traders to visualize the general market trend over different time horizons.
20% Gain on Green Candles:
This feature tracks continuous green candles and calculates the percentage gain from the lowest low to the highest high in that series.
If the gain is greater than or equal to 20%, the script highlights it with a purple triangle above the candle.
If the series of green candles starts with a candle where the low is below the 200 SMA, a purple diamond appears under the bar, indicating potential strong buying signals.
Lifetime High (LTH):
The script automatically tracks and displays the Lifetime High (LTH), i.e., the highest price ever recorded on the chart.
This level is important for identifying potential resistance areas and monitoring long-term market tops.
Once a new LTH is reached, it is displayed as a green line across the chart.
Support Levels from LTH:
The script calculates 30%, 50%, and 67% down from the LTH, marking key support levels.
These levels are plotted on the chart as orange lines and labeled to assist in spotting potential buy zones or market reversals.
52-Week Low:
It also calculates and displays the 52-week low for quick reference, plotted as a green line.
This helps traders assess major market bottoms and potential areas of support.
開源腳本
秉持TradingView一貫精神,這個腳本的創作者將其設為開源,以便交易者檢視並驗證其功能。向作者致敬!您可以免費使用此腳本,但請注意,重新發佈代碼需遵守我們的社群規範。
免責聲明
這些資訊和出版物並非旨在提供,也不構成TradingView提供或認可的任何形式的財務、投資、交易或其他類型的建議或推薦。請閱讀使用條款以了解更多資訊。
開源腳本
秉持TradingView一貫精神,這個腳本的創作者將其設為開源,以便交易者檢視並驗證其功能。向作者致敬!您可以免費使用此腳本,但請注意,重新發佈代碼需遵守我們的社群規範。
免責聲明
這些資訊和出版物並非旨在提供,也不構成TradingView提供或認可的任何形式的財務、投資、交易或其他類型的建議或推薦。請閱讀使用條款以了解更多資訊。