OPEN-SOURCE SCRIPT
CryptoMedication's Volatility RSI
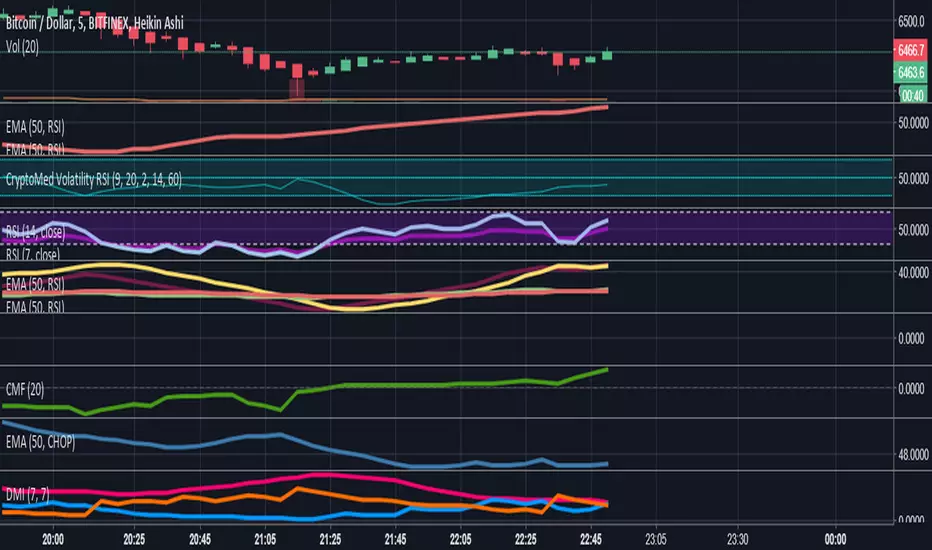
So, here's what we ended up doing for the most recent one that we created.
1. We took the ATR (Average True Range) - You can read about that here: medium.com/thedailydose/average-true-range-atr-lesson-26ee37c599cd
2. Then applied the Bollinger Bands %B to it
3. Then overlayed it with another indicator
Purpose:
The general purpose of this indicator is to identify when there are periods of consolidation or if there were be a large increase in the price (going either way). However, we were able to plug this in so that it connected with the RSI (after cancelling out the noise and smoothing values*making it scaled out evenly), so that it also produces buy/sell signals.
If you're interested to get a more in-depth overview of how this works, visit this link here: medium.com/thedailydose/cryptomedication-volatility-rsi-72d6dcc2d8bb
開源腳本
秉持TradingView一貫精神,這個腳本的創作者將其設為開源,以便交易者檢視並驗證其功能。向作者致敬!您可以免費使用此腳本,但請注意,重新發佈代碼需遵守我們的社群規範。
免責聲明
這些資訊和出版物並非旨在提供,也不構成TradingView提供或認可的任何形式的財務、投資、交易或其他類型的建議或推薦。請閱讀使用條款以了解更多資訊。
免責聲明
這些資訊和出版物並非旨在提供,也不構成TradingView提供或認可的任何形式的財務、投資、交易或其他類型的建議或推薦。請閱讀使用條款以了解更多資訊。