PROTECTED SOURCE SCRIPT
SIG PRINT + COMBO
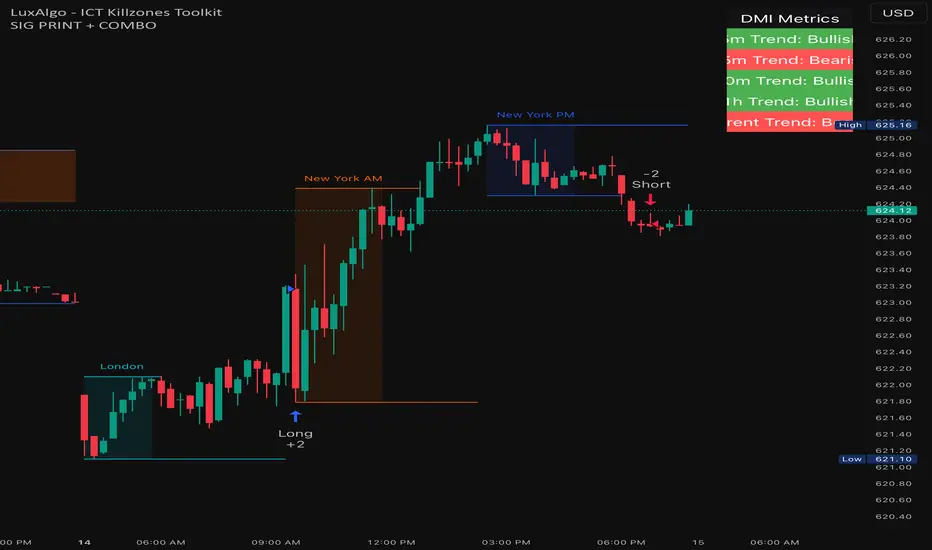
SIG PRINT + COMBO — Multi-Timeframe Trend & EMA Crossover Tool
This script combines EMA crossover logic with DMI-based trend analysis across multiple timeframes. It helps visualize directional trends (Bullish, Bearish, or No Clear Trend) on 5-minute, 15-minute, 30-minute, and 1-hour charts, displayed in a color-coded table overlay.
Key Components:
• EMA Strategy: Uses configurable short- and long-term EMAs to define crossover-based entry conditions.
• DMI Trend Detection: Implements ADX, +DI, and -DI to assess trend direction and strength.
• Multi-Timeframe Display: Shows trend signals for 5m, 15m, 30m, 1h, and current chart timeframe.
Built for users interested in aligning strategy entries with trend context across multiple timeframes.
⸻
zaytradellc
受保護腳本
此腳本以閉源形式發佈。 不過,您可以自由且不受任何限制地使用它 — 在此處了解更多資訊。
免責聲明
這些資訊和出版物並不意味著也不構成TradingView提供或認可的金融、投資、交易或其他類型的意見或建議。請在使用條款閱讀更多資訊。
受保護腳本
此腳本以閉源形式發佈。 不過,您可以自由且不受任何限制地使用它 — 在此處了解更多資訊。
免責聲明
這些資訊和出版物並不意味著也不構成TradingView提供或認可的金融、投資、交易或其他類型的意見或建議。請在使用條款閱讀更多資訊。