OPEN-SOURCE SCRIPT
已更新 Consecutive Higher/Lower Closings

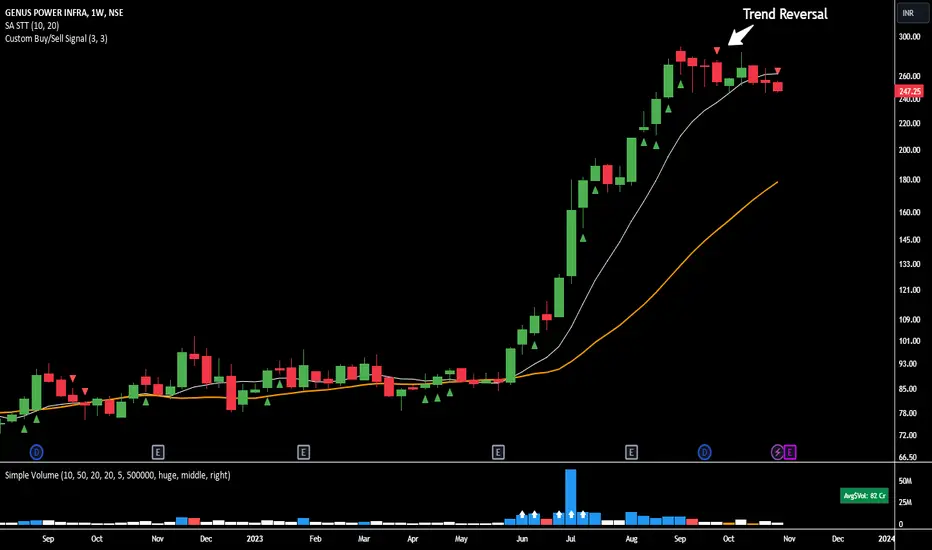
The Consecutive Higher/Lower Closings indicator is a powerful tool designed to assist traders in identifying potential buy and sell signals based on consecutive higher or lower closing prices. This indicator provides users with the flexibility to specify the number of consecutive higher or lower closings required to trigger a signal, allowing for a customizable trading strategy.
Key Features:
Usage:
How to Use:
Important Note:
Disclaimer:
Trading involves risk, and past performance does not guarantee future results. Always conduct thorough research and consider your risk tolerance before making trading decisions.
Key Features:
- Customizable Parameters: Users can define the number of consecutive higher and lower closings needed to generate buy and sell signals, providing a tailored approach to trading.
- Clear Buy and Sell Signals: The indicator plots clear buy and sell signals directly on the chart, making it easy for traders to identify potential entry and exit points.
Usage:
- Consecutive Higher Closings (Buy Signal): When the current closing price is higher than the previous closing price for the specified number of consecutive periods (as defined by the user), a buy signal will be generated.
- Consecutive Lower Closings (Sell Signal): When the current closing price is lower than the previous closing price for the specified number of consecutive periods (as defined by the user), a sell signal will be generated.
How to Use:
- Apply the Consecutive Higher/Lower Closings indicator to your chart.
- Adjust the input parameters, consecutiveHigherClosings and consecutiveLowerClosings, to match your preferred trading strategy. These parameters determine the number of consecutive higher and lower closings needed to trigger signals.
- Interpret the buy and sell signals generated by the indicator. When a buy signal is displayed (green triangle up), it suggests a potential entry point. Conversely, a sell signal (red triangle down) indicates a potential exit point.
Important Note:
- This indicator is designed to assist traders in making informed decisions, but it should be used in conjunction with other technical analysis tools and risk management strategies for a comprehensive trading approach.
- Kindly be aware that this strategy is most effective with Monster stocks with smooth price action, particularly when analyzing in weekly and/or daily timeframe.
Disclaimer:
Trading involves risk, and past performance does not guarantee future results. Always conduct thorough research and consider your risk tolerance before making trading decisions.
發行說明
Updates:- Consecutive Higher/Lower Values: Users can now specify the number of consecutive higher or lower values to trigger buy or sell signals.
- Value Type Selection: Choose the price type for analysis - Open, High, Low, or Close - using user-friendly checkboxes.
- Include Open in Analysis
- Include High in Analysis
- Include Low in Analysis
- Include Close in Analysis
This update offers greater customization, empowering traders to tailor the indicator to their preferred price metrics. Explore various combinations of consecutive values to fine-tune your trading signals.
開源腳本
秉持TradingView一貫精神,這個腳本的創作者將其設為開源,以便交易者檢視並驗證其功能。向作者致敬!您可以免費使用此腳本,但請注意,重新發佈代碼需遵守我們的社群規範。
免責聲明
這些資訊和出版物並非旨在提供,也不構成TradingView提供或認可的任何形式的財務、投資、交易或其他類型的建議或推薦。請閱讀使用條款以了解更多資訊。
開源腳本
秉持TradingView一貫精神,這個腳本的創作者將其設為開源,以便交易者檢視並驗證其功能。向作者致敬!您可以免費使用此腳本,但請注意,重新發佈代碼需遵守我們的社群規範。
免責聲明
這些資訊和出版物並非旨在提供,也不構成TradingView提供或認可的任何形式的財務、投資、交易或其他類型的建議或推薦。請閱讀使用條款以了解更多資訊。