FunctionLAPACKdsyrkLibrary "FunctionLAPACKdsyrk"
subroutine part of LAPACK: Linear Algebra Package,
performs one of the symmetric rank k operations
.
C := alpha*A*A**T + beta*C, or C := alpha*A**T*A + beta*C,
.
where alpha and beta are scalars, C is an n by n symmetric matrix
and A is an n by k matrix in the first case and a k by n matrix
in the second case.
.
reference:
netlib.org
dsyrk(uplo, trans, n, k, alpha, a, lda, beta, c, ldc)
performs one of the symmetric rank k operations
.
C := alpha*A*A**T + beta*C, or C := alpha*A**T*A + beta*C,
.
where alpha and beta are scalars, C is an n by n symmetric matrix
and A is an n by k matrix in the first case and a k by n matrix
in the second case.
.
Parameters:
uplo : string specifies whether the upper or lower triangular part of
the array C is to be referenced as follows:
UPLO = 'U' or 'u' Only the upper triangular part of C is to be referenced.
UPLO = 'L' or 'l' Only the lower triangular part of C is to be referenced.
.
trans : string specifies the operation to be performed as follows:
TRANS = 'N' or 'n' C := alpha*A*A**T + beta*C.
TRANS = 'T' or 't' C := alpha*A**T*A + beta*C.
TRANS = 'C' or 'c' C := alpha*A**T*A + beta*C.
.
n : int specifies the order of the matrix C. N must be at least zero.
k : int On entry with:
TRANS = 'N' or 'n', K specifies the number of columns of the matrix A.
TRANS = 'T' or 't' or 'C' or 'c', K specifies the number of rows of the matrix A.
K must be at least zero.
.
alpha : float scalar.
a : matrix matrix A.
lda : int specifies the first dimension of A.
beta : float scalar.
c : matrix matrix C, is overwritten by the lower triangular part of the updated matrix.
ldc : int specifies the first dimension of C
Returns: void, C is overwritten by the lower triangular part of the updated matrix.
Arrays

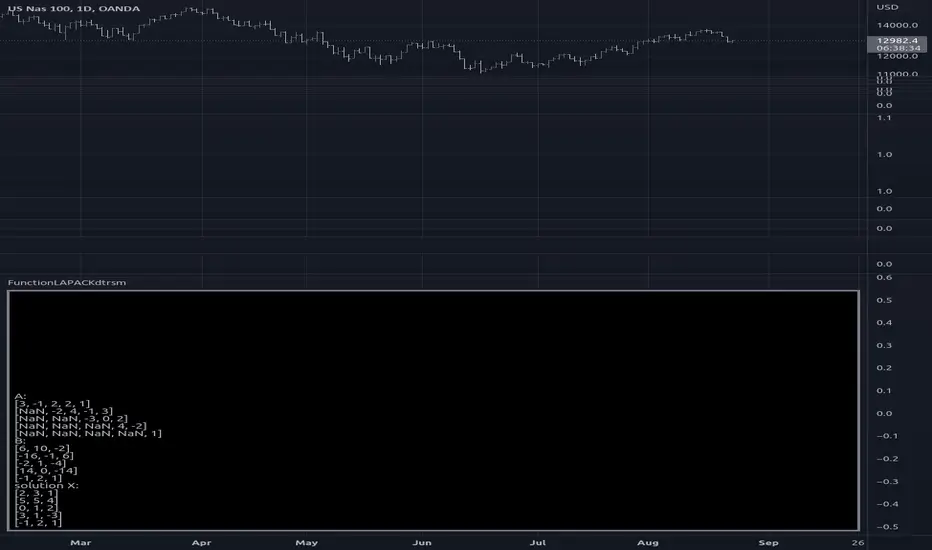
FunctionLAPACKdtrsmLibrary "FunctionLAPACKdtrsm"
subroutine in the LAPACK:linear algebra package, used to solve one of the following matrix equations:
op( A )*X = alpha*B, or X*op( A ) = alpha*B,
where alpha is a scalar, X and B are m by n matrices, A is a unit, or
non-unit, upper or lower triangular matrix and op( A ) is one of
op( A ) = A or op( A ) = A**T.
The matrix X is overwritten on B.
reference:
netlib.org
dtrsm(side, uplo, transa, diag, m, n, alpha, a, lda, b, ldb)
solves one of the matrix equations
op( A )*X = alpha*B, or X*op( A ) = alpha*B,
where alpha is a scalar, X and B are m by n matrices, A is a unit, or
non-unit, upper or lower triangular matrix and op( A ) is one of
op( A ) = A or op( A ) = A**T.
The matrix X is overwritten on B.
Parameters:
side : string , On entry, SIDE specifies whether op( A ) appears on the left or right of X as follows:
SIDE = 'L' or 'l' op( A )*X = alpha*B.
SIDE = 'R' or 'r' X*op( A ) = alpha*B.
uplo : string , specifies whether the matrix A is an upper or lower triangular matrix as follows:
UPLO = 'U' or 'u' A is an upper triangular matrix.
UPLO = 'L' or 'l' A is a lower triangular matrix.
transa : string , specifies the form of op( A ) to be used in the matrix multiplication as follows:
TRANSA = 'N' or 'n' op( A ) = A.
TRANSA = 'T' or 't' op( A ) = A**T.
TRANSA = 'C' or 'c' op( A ) = A**T.
diag : string , specifies whether or not A is unit triangular as follows:
DIAG = 'U' or 'u' A is assumed to be unit triangular.
DIAG = 'N' or 'n' A is not assumed to be unit triangular.
m : int , the number of rows of B. M must be at least zero.
n : int , the number of columns of B. N must be at least zero.
alpha : float , specifies the scalar alpha. When alpha is zero then A is not referenced and B need not be set before entry.
a : matrix, Triangular matrix.
lda : int , specifies the first dimension of A.
b : matrix, right-hand side matrix B, and on exit is overwritten by the solution matrix X.
ldb : int , specifies the first dimension of B.
Returns: void, modifies matrix b.
usage:
dtrsm ('L', 'U', 'N', 'N', 5, 3, 1.0, a, 7, b, 6)
MYX_ACE_DBLibrary "MYX_ACE_DB"
TODO: Library for Malaysia ACE Market
db(x)
TODO: Library for Malaysia ACE Market
Parameters:
x : TODO: id
Returns: TODO: id

MYX_LEAP_DBLibrary "MYX_LEAP_DB"
TODO: Library for Malaysia LEAP Market
db(x)
TODO: Library for Malaysia LEAP Market
Parameters:
x : TODO: id
Returns: TODO: id
FunctionPatternFrequencyLibrary "FunctionPatternFrequency"
Counts the word or integer number pattern frequency on a array.
reference:
rosettacode.org
count(pattern)
counts the number a pattern is repeated.
Parameters:
pattern : : array : array with patterns to be counted.
Returns:
array : list of unique patterns.
array : list of counters per pattern.
usage:
count(array.from('a','b','c','a','b','a'))
count(pattern)
counts the number a pattern is repeated.
Parameters:
pattern : : array : array with patterns to be counted.
Returns:
array : list of unique patterns.
array : list of counters per pattern.
usage:
count(array.from(1,2,3,1,2,1))

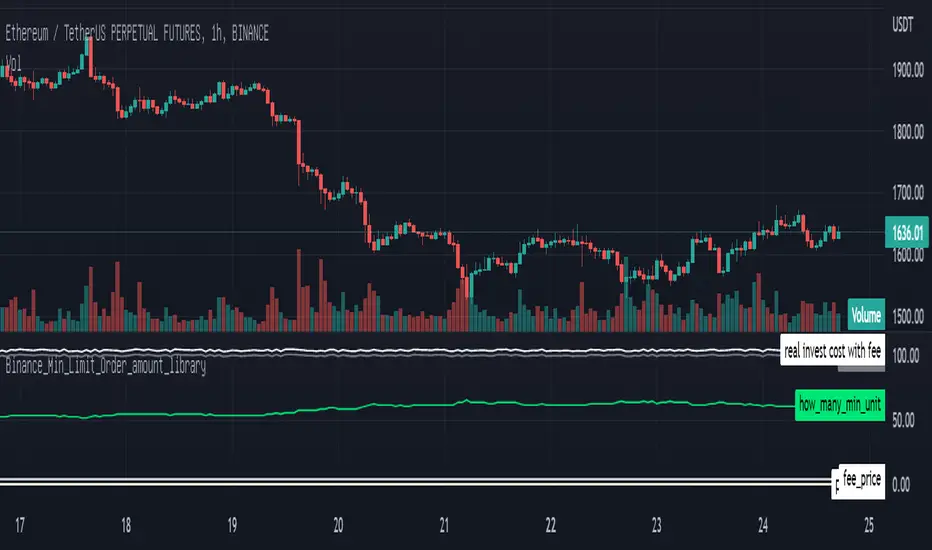
Binance_Min_Limit_Order_amount_libraryLibrary "Binance_Min_Limit_Order_amount_library"
TODO: This library give us the minimum Limit Order amount for the contract in Binance.
m_qty(n_v, m_fee, t_fee, cost, m_t)
TODO: it give us the Minimum Qty for the trading in Binance
Parameters:
n_v : TODO: min_notional_value. 5 dollar is the minimum notional amount in Binance at the moment.
m_fee : TODO: maker_fee %
t_fee : TODO: taker_fee %
cost : TODO: your investing money
m_t : TODO: if you want Limit_Order, put the "T", if you want Market_Order, put the "M" defval="M"
Returns: TODO: for the coin of binance on your chart,
Reference: www.binance.com
DatasetWeatherTokyoMeanAirTemperatureLibrary "DatasetWeatherTokyoMeanAirTemperature"
Provides a data set of the monthly mean air temperature (°C) for the city of Tokyo in Japan.
this was just for fun, no financial implications in this.
reference:
www.data.jma.go.jp
TOKYO WMO Station ID:47662 Lat 35o41.5'N Lon 139o45.0'E
year_()
the years of the data set.
Returns: array : year values.
january()
the january values of the dataset
Returns: array\ : data values for january.
february()
the february values of the dataset
Returns: array\ : data values for february.
march()
the march values of the dataset
Returns: array\ : data values for march.
april()
the april values of the dataset
Returns: array\ : data values for april.
may()
the may values of the dataset
Returns: array\ : data values for may.
june()
the june values of the dataset
Returns: array\ : data values for june.
july()
the july values of the dataset
Returns: array\ : data values for july.
august()
the august values of the dataset
Returns: array\ : data values for august.
september()
the september values of the dataset
Returns: array\ : data values for september.
october()
the october values of the dataset
Returns: array\ : data values for october.
november()
the november values of the dataset
Returns: array\ : data values for november.
december()
the december values of the dataset
Returns: array\ : data values for december.
annual()
the annual values of the dataset
Returns: array\ : data values for annual.
select_month(idx)
get the temperature values for a specific month.
Parameters:
idx : int, month index (1 -> 12 | any other value returns annual average values).
Returns: array\ : data values for selected month.
select_value(year_, month_)
get the temperature value of a specified year and month.
Parameters:
year_ : int, year value.
month_ : int, month index (1 -> 12 | any other value returns annual average values).
Returns: float : value of specified year and month.
diff_to_median(month_)
the difference of the month air temperature (ºC) to the median of the sample.
Parameters:
month_ : int, month index (1 -> 12 | any other value returns annual average values).
Returns: float : difference of current month to median in (Cº)

FunctionDynamicTimeWarpingLibrary "FunctionDynamicTimeWarping"
"In time series analysis, dynamic time warping (DTW) is an algorithm for
measuring similarity between two temporal sequences, which may vary in
speed. For instance, similarities in walking could be detected using DTW,
even if one person was walking faster than the other, or if there were
accelerations and decelerations during the course of an observation.
DTW has been applied to temporal sequences of video, audio, and graphics
data — indeed, any data that can be turned into a linear sequence can be
analyzed with DTW. A well-known application has been automatic speech
recognition, to cope with different speaking speeds. Other applications
include speaker recognition and online signature recognition.
It can also be used in partial shape matching applications."
"Dynamic time warping is used in finance and econometrics to assess the
quality of the prediction versus real-world data."
~~ wikipedia
reference:
en.wikipedia.org
towardsdatascience.com
github.com
cost_matrix(a, b, w)
Dynamic Time Warping procedure.
Parameters:
a : array, data series.
b : array, data series.
w : int , minimum window size.
Returns: matrix optimum match matrix.
traceback(M)
perform a backtrace on the cost matrix and retrieve optimal paths and cost between arrays.
Parameters:
M : matrix, cost matrix.
Returns: tuple:
array aligned 1st array of indices.
array aligned 2nd array of indices.
float final cost.
reference:
github.com
report(a, b, w)
report ordered arrays, cost and cost matrix.
Parameters:
a : array, data series.
b : array, data series.
w : int , minimum window size.
Returns: string report.

FunctionKellyCriterionLibrary "FunctionKellyCriterion"
Kelly criterion methods.
the kelly criterion helps with the decision of how much one should invest in
a asset as long as you know the odds and expected return of said asset.
simplified(win_p, rr)
simplified version of the kelly criterion formula.
Parameters:
win_p : float, probability of winning.
rr : float, reward to risk rate.
Returns: float, optimal fraction to risk.
usage:
simplified(0.55, 1.0)
partial(win_p, loss_p, win_rr, loss_rr)
general form of the kelly criterion formula.
Parameters:
win_p : float, probability of the investment returns a positive outcome.
loss_p : float, probability of the investment returns a negative outcome.
win_rr : float, reward on a positive outcome.
loss_rr : float, reward on a negative outcome.
Returns: float, optimal fraction to risk.
usage:
partial(0.6, 0.4, 0.6, 0.1)
from_returns(returns)
Calculate the fraction to invest from a array of returns.
Parameters:
returns : array trade/asset/strategy returns.
Returns: float, optimal fraction to risk.
usage:
from_returns(array.from(0.1,0.2,0.1,-0.1,-0.05,0.05))
final_f(fraction, max_expected_loss)
Final fraction, eg. if fraction is 0.2 and expected max loss is 10%
then you should size your position as 0.2/0.1=2 (leverage, 200% position size).
Parameters:
fraction : float, aproximate percent fraction invested.
max_expected_loss : float, maximum expected percent on a loss (ex 10% = 0.1).
Returns: float, final fraction to invest.
usage:
final_f(0.2, 0.5)
hpr(fraction, trade, biggest_loss)
Holding Period Return function
Parameters:
fraction : float, aproximate percent fraction invested.
trade : float, profit or loss in a trade.
biggest_loss : float, value of the biggest loss on record.
Returns: float, multiplier of effect on equity so that a win of 5% is 1.05 and loss of 5% is 0.95.
usage:
hpr(fraction=0.05, trade=0.1, biggest_loss=-0.2)
twr(returns, rr, eps)
Terminal Wealth Relative, returns a multiplier that can be applied
to the initial capital that leadds to the final balance.
Parameters:
returns : array, list of trade returns.
rr : float , reward to risk rate.
eps : float , minimum resolution to void zero division.
Returns: float, optimal fraction to invest.
usage:
twr(returns=array.from(0.1,-0.2,0.3), rr=0.6)
ghpr(returns, rr, eps)
Geometric mean Holding Period Return, represents the average multiple made on the stake.
Parameters:
returns : array, list of trade returns.
rr : float , reward to risk rate.
eps : float , minimum resolution to void zero division.
Returns: float, multiplier of effect on equity so that a win of 5% is 1.05 and loss of 5% is 0.95.
usage:
ghpr(returns=array.from(0.1,-0.2,0.3), rr=0.6)
run_coin_simulation(fraction, initial_capital, n_series, n_periods)
run multiple coin flipping (binary outcome) simulations.
Parameters:
fraction : float, fraction of capital to bet.
initial_capital : float, capital at the start of simulation.
n_series : int , number of simulation series.
n_periods : int , number of periods in each simulation series.
Returns: matrix(n_series, n_periods), matrix with simulation results per row.
usage:
run_coin_simulation(fraction=0.1)
run_asset_simulation(returns, fraction, initial_capital)
run a simulation over provided returns.
Parameters:
returns : array, trade, asset or strategy percent returns.
fraction : float , fraction of capital to bet.
initial_capital : float , capital at the start of simulation.
Returns: array, array with simulation results.
usage:
run_asset_simulation(returns=array.from(0.1,-0.2,0.-3,0.4), fraction=0.1)
strategy_win_probability()
calculate strategy() current probability of positive outcome in a trade.
strategy_avg_won()
calculate strategy() current average won on a trade with positive outcome.
strategy_avg_loss()
calculate strategy() current average lost on a trade with negative outcome.

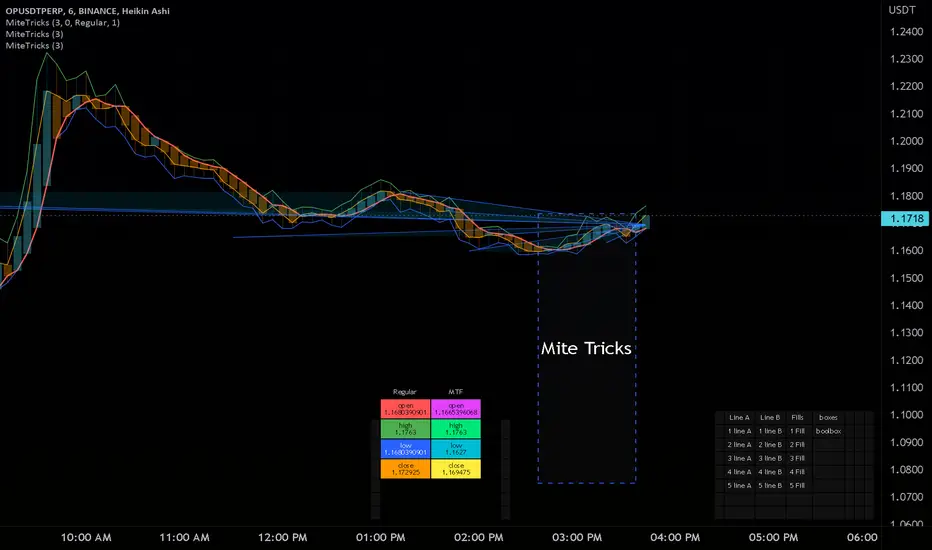
MiteTricksLibrary "MiteTricks"
Matrix Global Registry.
Get, Set, automatic growing, universal get/set,
multi-matrix dictionaries, multi-dictionary matrixes..
add slice matrixes of any type, share one common global key registry
pull up an item from a category, and item name ie a table of info.
same cell needs a color, a size, a string, a value, etc..
all of which can be pulled up with the same group id, and key id.
just swap which matrix you pull the value from.
this has a side benefit of non-repainting and recalculating
when pulling values, changing inputs..
makes for very fast/clean usage..
benefit :
floats = value
strings = names
lines = drawn items
table =table of data items for this key
colors = color for line/table/fill,label..
all of those can be pulled with "get(_VALUES,_groupIDX,_keyIDX)" where only the values matrix needs be swapped, and the same item/coordinates remains for all the possible matrixes that item appears in.
also useful as a dictionary/registry for any given type of item,,
and goes very handy with floats/strings/colors/bools with my matrixautotable
very helpful when prototyping or doing development work as a shortcut.
initRegistry()
Registry inititalizer
Returns: registry of string matrix type
newbool(optional, optional, optional)
create bool type new matrix presized 2x2 for reg
Parameters:
optional: row size
optional: column size
optional: fill value(default is bool (na)
Returns: bool matrix of specified size and fill, or blank 2x2 for registry use
newbox(optional, optional, optional)
create box type new matrix presized 2x2 for reg
Parameters:
optional: row size
optional: column size
optional: fill value(default is box (na)
Returns: box matrix of specified size and fill, or blank 2x2 for registry use
newcolor(optional, optional, optional)
create color type new matrix presized 2x2 for reg
Parameters:
optional: row size
optional: column size
optional: fill value(default is color (na)
Returns: color matrix of specified size and fill, or blank 2x2 for registry use
newfloat(optional, optional, optional)
create float type new matrix presized 2x2 for reg
Parameters:
optional: row size
optional: column size
optional: fill value(default is float (na)
Returns: float matrix of specified size and fill, or blank 2x2 for registry use
newint(optional, optional, optional)
create int type new matrix presized 2x2 for reg
Parameters:
optional: row size
optional: column size
optional: fill value(default is int (na)
Returns: int matrix of specified size and fill, or blank 2x2 for registry use
newlabel(optional, optional, optional)
create label type new matrix presized 2x2 for reg
Parameters:
optional: row size
optional: column size
optional: fill value(default is label (na)
Returns: label matrix of specified size and fill, or blank 2x2 for registry use
newline(optional, optional, optional)
create line type new matrix presized 2x2 for reg
Parameters:
optional: row size
optional: column size
optional: fill value(default is line (na)
Returns: line matrix of specified size and fill, or blank 2x2 for registry use
newlinefill(optional, optional, optional)
create linefill type new matrix presized 2x2 for reg
Parameters:
optional: row size
optional: column size
optional: fill value(default is linefill(na)
Returns: linefill matrix of specified size and fill, or blank 2x2 for registry use
newstring(optional, optional, optional)
create string type new matrix presized 2x2 for reg
Parameters:
optional: row size
optional: column size
optional: fill value(default is string (na)
Returns: string matrix of specified size and fill, or blank 2x2 for registry use
newtable(optional, optional, optional)
create table type new matrix presized 2x2 for reg
Parameters:
optional: row size
optional: column size
optional: fill value(default is table (na)
Returns: table matrix of specified size and fill, or blank 2x2 for registry use
newfrom(INIT_FILL)
newfrom Matrix full of item input
Parameters:
INIT_FILL: item to fill (2x2) the matri and set type. a type(na) works
addrow(m, v)
addrow Add new row to matrix
Parameters:
m: matrix of type being added to
v: value of type being added to ( best leave NA on string for registry purposes)
addcolumn(matrix, value)
addcolumn
Parameters:
matrix: of type being added to
value: of type being added to ( best leave NA on string for registry purposes)
get(_VALS, _KEYREG, _GROUP, _KEY)
get Grabs value and returns single item
Parameters:
_VALS: Matrix Values slice
_KEYREG: Registry values matrix (strings)
_GROUP: name of group/category or int group key
_KEY: name of item to fetch from value registry or int key id
Returns: item
get(_VALS, _GROUP, _KEY)
get Grabs value and returns single item
Parameters:
_VALS: Matrix Values slice
_GROUP: name of group/category
_KEY: name of item to fetch from value registry
getgid(_KEYREG, _GROUP)
getgid
Parameters:
_KEYREG: Reg to pull group id from
_GROUP: group index int, or string name to get the other missing type
getkid(_KEYREG, _GROUP, _KEY)
getkid
Parameters:
_KEYREG: Reg to pull Key id from
_GROUP: group index int, or string name
_KEY: index of string key id to get it's ID int
getkey(_KEYREG, _GROUP, _KEY)
getkey
Parameters:
_KEYREG: Reg to pull Key id from
_GROUP: group index int, or string name for getting key string
_KEY: index of string key id to get it's match of other type
set(_VALS, _KEYREG, _GROUP, _KEY, _value)
set items to reg and matrix container
Parameters:
_VALS: Values matrix container
_KEYREG: Key registry
_GROUP: (string) Group/Category name
_KEY: (string) Key for item
_value: item
Returns: void
del(_VALS, _KEYREG, _GROUP, _KEY)
del grroup id
Parameters:
_VALS: Matrix Values slice
_KEYREG: Registry values matrix (strings)
_GROUP: name of group/category
_KEY: name of item to Delete from values and key
detached(_GROUP, _KEY, _VALUE)
detached make detached registry/val matrix
Parameters:
_GROUP: Name of first group
_KEY: Name of first item
_VALUE: Item of any type, sets the output type too.
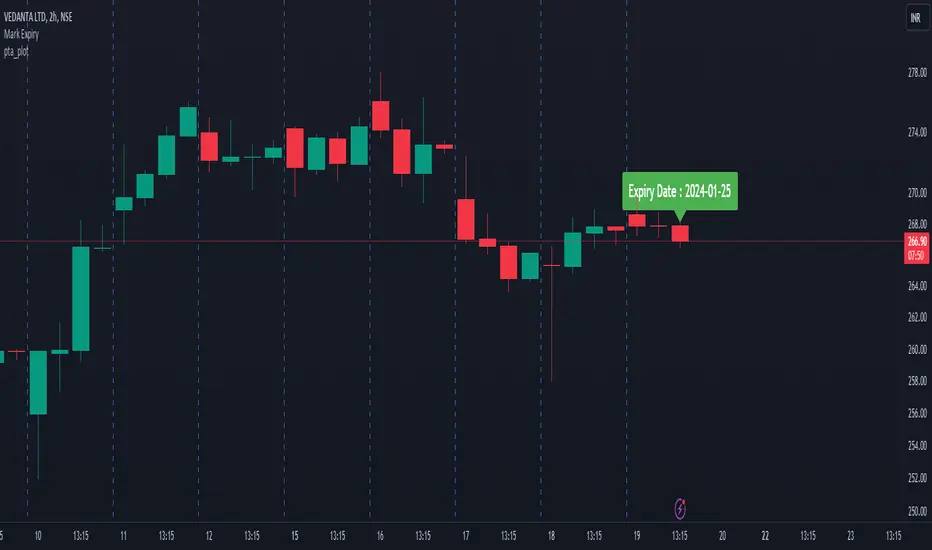
pta_plotLibrary "pta_plot"
pta_plot: This library will help you to plot different value. I will keep updating with your requirement
print_array(array_id, border_color)
Display array element as a table.
Parameters:
array_id : Id of your array.
border_color : Color for border (`color.black` is used if no argument is supplied).
Returns: Display array element in bottom of the pane.
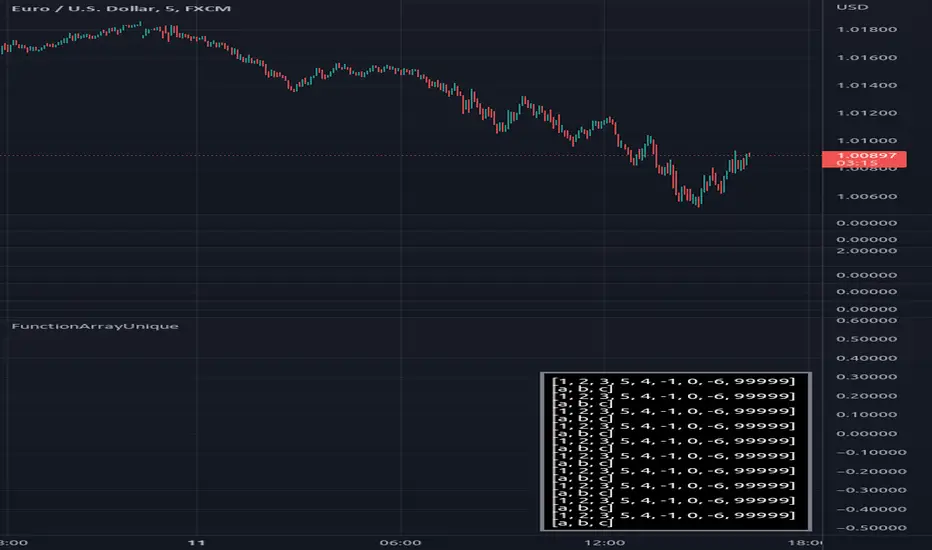
FunctionArrayUniqueLibrary "FunctionArrayUnique"
Method for retrieving the unique elements in a array.
for example would retrieve a array with ,
the elements retrieved will be sorted by its first seen index in
parent array.
note: float values have no precision option.
unique(source)
method for retrieving the unique elements in a array.
Parameters:
source : array source array to extract elements.
Returns: array unique elements in the source array.
unique(source)
method for retrieving the unique elements in a array.
Parameters:
source : array source array to extract elements.
Returns: array unique elements in the source array.
unique(source)
method for retrieving the unique elements in a array.
Parameters:
source : array source array to extract elements.
Returns: array unique elements in the source array.
functionStringToMatrixLibrary "functionStringToMatrix"
Provides unbound methods (no error checking) to parse a string into a float or int matrix.
to_matrix_float(str, interval_sep, start_tk, end_tk)
Parse a string into a float matrix.
Parameters:
str : , string, the formated string to parse.
interval_sep : , string, cell interval separator token.
start_tk : , string, row start token.
end_tk : , string, row end token.
Returns: matrix, parsed float matrix.
to_matrix_int(str, interval_sep, start_tk, end_tk)
Parse a string into a int matrix.
Parameters:
str : , string, the formated string to parse.
interval_sep : , string, cell interval separator token.
start_tk : , string, row start token.
end_tk : , string, row end token.
Returns: matrix, parsed int matrix.

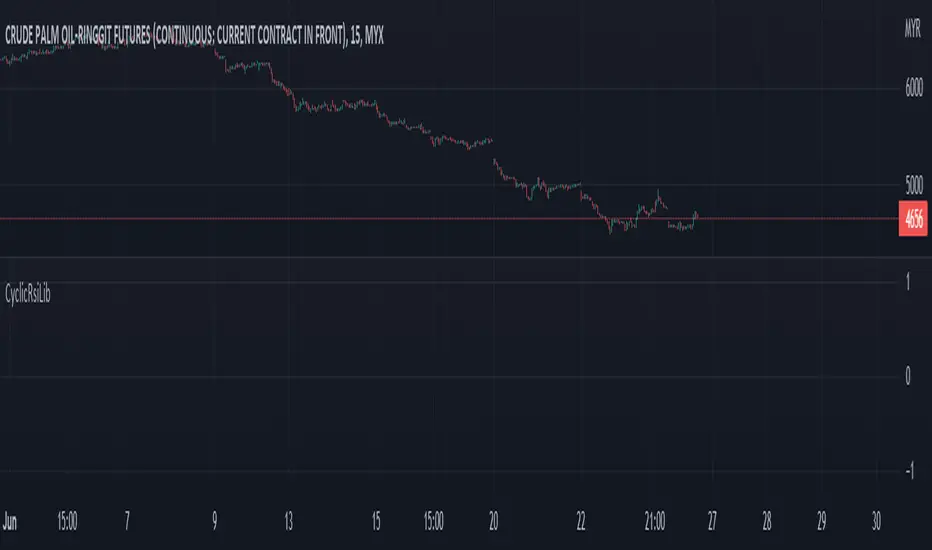
CyclicRsiLib█ OVERVIEW
This library is complementary for Cyclic RSI High Low With Noise Filter.
█ CREDITS
LoneSomeTheBlue
WhenToTrade
AlertFrequency()
: AlertFrequency
Parameters:
: : _string
Returns: : _freq
CyclicRSI()
: CyclicRSI
Parameters:
: : _source, _length, _expression
Returns: : osc
Credits to WhenToTrade
AddToZigzag()
: AddToZigzag
Parameters:
: : _id, value, max_array_size
Returns: : array.unshift, array.pop
Credits to LonesomeTheBlue
UpdateZigzag()
: UpdateZigzag
Parameters:
: : _id, value, max_array_size, dir
Returns: : AddToZigzag, array.set
Credits to LonesomeTheBlue
BoolZigzag()
: BoolZigzag
Parameters:
: : ph, pl, dirchanged, _id, dir
Returns: : AddToZigzag, UpdateZigzag
Credits to LonesomeTheBlue
NoiseSwitch()
: NoiseSwitch
Parameters:
: : _string, _id
Returns: : FilterNoise
LineGray()
: LineGray
Parameters:
: : _id
Returns: : LineGray
LabelDir()
: LabelDir
Parameters:
: : _id, _string, _color, _float
Returns: : LabelDir
TernaryLabel()
: TernaryLabel
Parameters:
: : _dir, _bool1, _bool2, _string1, _string2
Returns: : str_label
TernaryColor()
: TernaryColor
Parameters:
: : _dir, _bool1, _bool2
Returns: : col_label
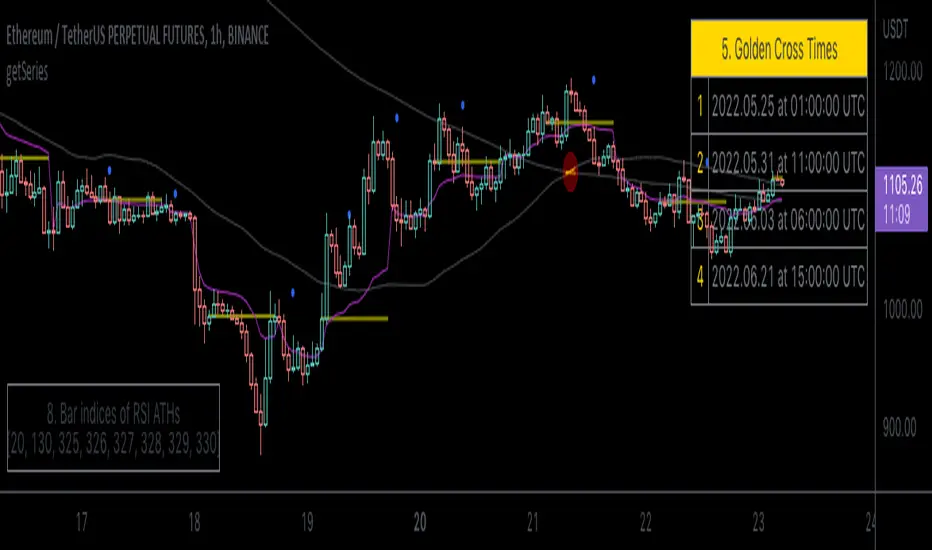
getSeries█ OVERVIEW
This library is a Pine programmer’s tool containing functions that build an array of values meeting specific conditions. Its functions use concepts from our ConditionalAverages library , but instead of returning a single value, they return an array containing all the values meeting the conditions, which can then be processed as needed. This provides more flexibility to the programmer than a single value.
The "getSeries" name of the library stems from the fact that is uses arrays to build the equivalent of custom series which can then be operated on using array-specific functions in the `array.*` namespace, looped through using a for...in structure to implement custom logic, or sent to functions designed to process arrays such as those in these libraries: ArrayStatistics , ArrayOperations , arrayutils or Averages .
The eight examples illustrated in the library's code showcase the diversity of scenarios where the functions can be used.
Look first. Then leap.
█ FUNCTIONS
The library contains the following functions:
whenSince(src, whenCond, sinceCond, length)
Creates an array containing the `length` last `src` values where `whenCond` is true, since the last occurence of `sinceCond`.
Parameters:
src : (series int/float) The source of the values to be included.
whenCond : (series bool) The condition determining which values are included. Optional. The default is `true`.
sinceCond : (series bool) The condition determining when the accumulated series resets. Optional. The default is false, which will not reset.
length : (simple int) The number of last values to return. Optional. The default is all values.
Returns: (float ) The array ID of the accumulated `src` values.
rollOnTimeWhen(src, timeWindow, cond, minBars)
Creates an array of `src` values where `cond` is true, over a moving window of length `timeWindow` milliseconds.
Parameters:
src : (series int/float) The source of the values to be included.
timeWindow : (simple int) The time duration in milliseconds defining the size of the moving window.
cond : (series bool) The condition determining which values are included. Optional. The default is `true`.
minBars : (simple int) The minimum number of values to maintain in the moving window. Optional. The default is 1.
Returns: (float ) The array ID of the accumulated `src` values.
Note that the functions must be called on each bar to work correctly. They must thus be pre-evaluated before using their results in conditional branches.
utilsLibrary "utils"
Few essentials captured together (subset of arrayutils)
timer(timeStart, endTime)
finds difference between two timestamps
Parameters:
timeStart : start timestamp
endTime : end timestamp
Returns:
check_overflow(pivots, barArray, dir)
finds difference between two timestamps
Parameters:
pivots : pivots array
barArray : pivot bar array
dir : direction for which overflow need to be checked
Returns: bool overflow
get_trend_series(pivots, length, highLow, trend)
finds series of pivots in particular trend
Parameters:
pivots : pivots array
length : length for which trend series need to be checked
highLow : filter pivot high or low
trend : Uptrend or Downtrend
Returns: int trendIndexes
get_trend_series(pivots, firstIndex, lastIndex)
finds series of pivots in particular trend
Parameters:
pivots : pivots array
firstIndex : First index of the series
lastIndex : Last index of the series
Returns: int trendIndexes
getConsolidatedLabel(include, labels, separator)
Consolidates labels into single string by concatenating it with given separator
Parameters:
include : array of conditions to include label or not
labels : string array of labels
separator : Separator for concatenating labels
Returns: string labelText
getColors(theme)
gets array of colors based on theme
Parameters:
theme : dark or light theme
Returns: color themeColors
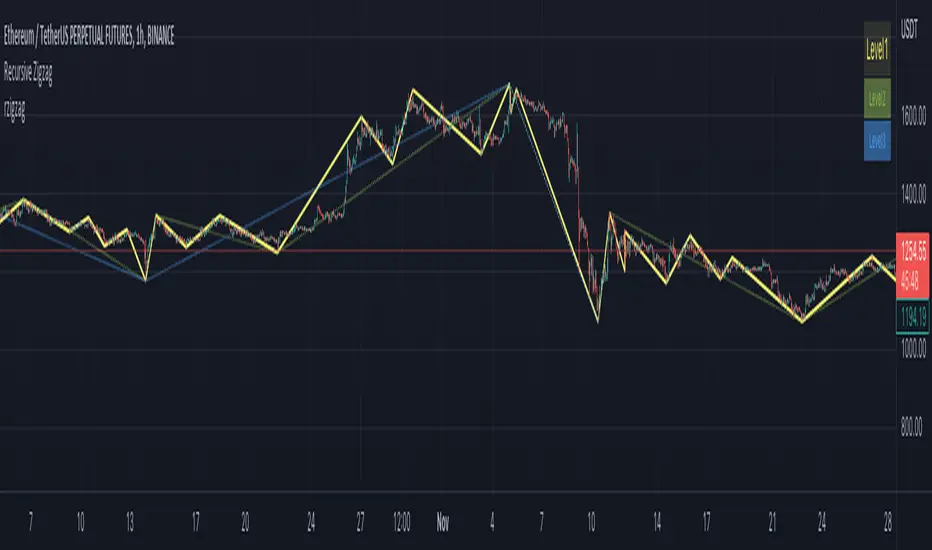
rzigzagLibrary "rzigzag"
Recursive Zigzag Using Matrix allows to create zigzags recursively on multiple levels. After bit of consideration, decided to make this public.
zigzag(length, ohlc, numberOfPivots, offset)
calculates plain zigzag based on input
Parameters:
length : Zigzag Length
ohlc : Array containing ohlc values. Can also contain custom series
numberOfPivots : Number of max pivots to be returned
offset : Offset from current bar. Can be used for calculations based on confirmed bars
Returns:
nextlevel(zigzagmatrix, numberOfPivots)
calculates next level zigzag based on present zigzag coordinates
Parameters:
zigzagmatrix : Matrix containing zigzag pivots, bars, bar time, direction and level
numberOfPivots : Number of max pivots to be returned
Returns: matrix zigzagmatrix
draw(zigzagmatrix, newPivot, doublePivot, lineColor, lineWidth, lineStyle, showLabel, xloc)
draws zigzag based on the zigzagmatrix input
Parameters:
zigzagmatrix : Matrix containing zigzag pivots, bars, bar time, direction and level
newPivot : Flag indicating there is update in the pivots
doublePivot : Flag containing there is double pivot update on same bar
lineColor : Zigzag line color
lineWidth : Zigzag line width
lineStyle : Zigzag line style
showLabel : Flag to indicate display pivot labels
xloc : xloc preference for drawing lines/labels
Returns:
draw(length, ohlc, numberOfPivots, offset, lineColor, lineWidth, lineStyle, showLabel, xloc)
calculates and draws zigzag based on zigzag length and source input
Parameters:
length : Zigzag Length
ohlc : Array containing ohlc values. Can also contain custom series
numberOfPivots : Number of max pivots to be returned
offset : Offset from current bar. Can be used for calculations based on confirmed bars
lineColor : Zigzag line color
lineWidth : Zigzag line width
lineStyle : Zigzag line style
showLabel : Flag to indicate display pivot labels
xloc : xloc preference for drawing lines/labels
Returns:
drawfresh(zigzagmatrix, zigzaglines, zigzaglabels, lineColor, lineWidth, lineStyle, showLabel, xloc)
draws fresh zigzag for all pivots in the input matrix.
Parameters:
zigzagmatrix : Matrix containing zigzag pivots, bars, bar time, direction and level
zigzaglines : array to which all newly created lines will be added
zigzaglabels : array to which all newly created lables will be added
lineColor : Zigzag line color
lineWidth : Zigzag line width
lineStyle : Zigzag line style
showLabel : Flag to indicate display pivot labels
xloc : xloc preference for drawing lines/labels
Returns:
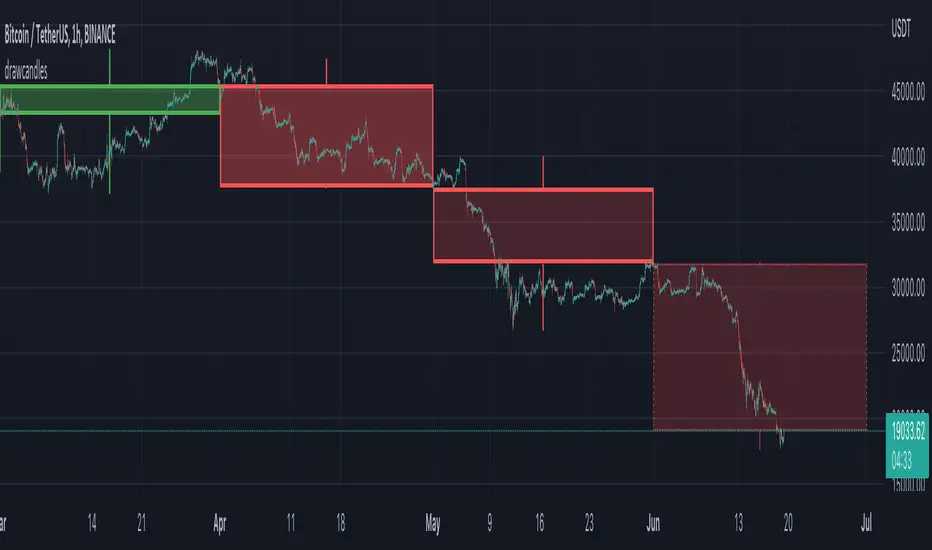
drawcandlesLibrary "drawcandles"
simple utility to draw different candles using box and lines. Quite useful for drawing candles such as zigzag candles or MTF candles
draw(o, h, l, c, oBar, cBar)
draws candles based on ohlc values
Parameters:
o : Open Price
h : High Price
l : Low Price
c : Close Price
oBar : Open Time
cBar : Close Time
Returns: void
curveLibrary "curve"
Regression array Creator. Handy for weights, Auto Normalizes array while holding curves.
curve(_size, _power)
Curve Regression Values Tool
Parameters:
_size : (float) Number of Steps required (float works, future consideration)
_power : (float) Strength of value decrease
Returns: (float ) Array of multipliers from 1 downwards to 0.

Object: object oriented programming made possible! Hash map's in Pinescript?? Absolutely
This Library is the first step towards bringing a much needed data structure to the Pine Script community.
"Object" allows Pine coders to finally create objects full or unique key:value pairs, which are converted to strings and stored in an array. Data can be stored and accessed using dedicated get and set methods.
The workflow is simple, but has a few nuances:
0. Import this library into your project; you can give it whatever alias you'd like (I'll be using obj)
1. Create your first object using the obj.new() method and assign it a variable or "ID".
2. Use the object's ID as the first argument into the obj.set() method, for the key and value there's one extra step required. They must be added as arguments to the appropriate prop_() method.
Note: While objects in this library technically only store data as strings, any primitive data type can be converted to a string before being stored, meaning that one object can hold data from multiple types at once. There's a trade off though..Pine Script requires that all exported function parameters have pre-defined types, meaning that as convenient as it would be to have a single method for storing and returning data of every type, it's not currently possible. Instead there are functions to add properties for each individual type, which are then converted to strings automatically (the original type is flagged and stored along with the data). Furthermore, since switch/if statements can only return values of the same type, there must also be "get" methods which correspond with each type. Again, a single "get" method which auto-detects the returned value's type was the goal but it's just not currently possible. Instead each get method is only allowed to return a value of its own type. No worries though, all the "get" methods will throw errors if they can't access the data you're trying to access. In that error message, you'll be informed exactly which "get" method you need to use if you ever lose track of what type of data you should be returning.
3. The second argument for obj.set() method is the obj.prop_() method. You just plug in your key as a string and your value and you're done. Easy as that.
Please do not skip this step, properties must be formatted correctly for data to be stored and accessed correctly
4. Obj.get_ (s: string, f: float, b: bool, i: int) methods are even easier, just choose whichever method will return the data type you need, then plug in your ID, and key and that's it. Objects will output data of the same type they were stored as!
There's a short example at the end of the script if you'd like to see more!
prop_string(string: key, string: value)
returns property formatted to string and flagged as string type
prop_float(string: key, float: value)
returns property formatted to string and flagged as float type
prop_bool(string: key, bool: value)
returns property formatted to string and flagged as bool type
prop_int(string: key, int: value)
returns property formatted to string and flagged as int type
Support for lines and shapes coming soon!
new()
returns an empty object
set(string : ID, string: property)
adds new property to object
get_f(string : ID, string: key)
returns float values
get_s(string : ID, string: key)
returns string values
get_b(string : ID, string: key)
returns boolean values
get_i(string : ID, string: key)
returns int values
More methods like Obj.remove(), Obj.size(), Obj.fromString, Obj.fromArray, Obj.toJSON, Obj.keys, & Obj.values coming very soon!!

arraysLibrary "arrays"
Library contains utility functions using arrays.
delete( arr , index)
remove an item from array at specific index. Also deletes the item
Parameters:
arr: - array from which the item needs to be deleted
index: - index of item to be deleted
Returns: void
pop( arr )
remove the last item from array. Also deletes the item
Parameters:
arr: - array from which the last item needs to be removed and deleted
Returns: void
shift( arr )
remove an item from array at index 0. Also deletes the item
Parameters:
arr: - array from which the first item needs to be removed and deleted
Returns: void
unshift( arr , val, maxItems)
add an item to the beginning of an array with max items cap
Parameters:
arr: - array to which the item needs to be added at the beginning
val: - value of item which needs to be added
maxItems: - max items array can hold. After that, items are removed from the other end
Returns: resulting array
clear( arr )
remove and delete all items in an array
Parameters:
arr: - array which needs to be cleared
Returns: void
push( arr , val, maxItems)
add an item to the end of an array with max items cap
Parameters:
arr: - array to which the item needs to be added at the beginning
val: - value of item which needs to be added
maxItems: - max items array can hold. After that, items are removed from the starting index
Returns: resulting array

HarmonicCalculation█ OVERVIEW
This library is complementary for XABCD Harmonic Pattern Custom Range Interactive
PriceDiff()
: Price Difference
Parameters:
: : price_1, price_2
Returns: : PriceDiff
TimeDiff()
: Time Difference
Parameters:
: : time_1, time_2
Returns: : TimeDiff
ReturnIndexOf3Arrays()
: Return Index Of 3 Arrays
Parameters:
: : id1, id2, id3, _int
Returns: : ReturnIndexOf3Arrays
AbsoluteRange()
: Price Difference
Parameters:
: : price, y, point
Returns: : AbsoluteRange
PriceAverage()
: To calculate average of 2 prices
Parameters:
: : price_1, price_2
Returns: : PriceAverage
TimeAverage()
: To calculate average of 2 times
Parameters:
: : time_1, time_2
Returns: : TimeAverage
StringBool()
: To show ratio in 3 decimals format
Parameters:
: : _value, _bool, _text
Returns: : StringBool
PricePercent()
: To show Price in percent format
Parameters:
: : _price, PriceRef, str_dir
Returns: : PricePercent
BoolCurrency()
: To show syminfo.currency
Parameters:
: : _bool
Returns: : BoolCurrency
RatioText()
: To show RatioText in 3 decimals format
Parameters:
: : _value, _text
Returns: : RatioText
RangeText()
: To display RangeText in Harmonic Range Format
Parameters:
: : _id1, _id2, _int, _text
Returns: : RangeText
PriceCurrency()
: To show Currency in Price Format
Parameters:
: : _bool, _value
Returns: : PriceCurrency
HarmonicDB█ OVERVIEW
This library was to showcase database for specifications of Harmonic Patterns using arrays.
█ CREDITS
Scott M Carney, author of Harmonic Trading : Volume Three
animal_db(x)
TODO: export animal_db
Parameters:
x : TODO: float value is set to default if not necessary
Returns: TODO:
