Compact Self-Adjusting SuperTrendA custom version of Self Adjusting SuperTrend that can be used as source for your trading frameworks and indicators.
Automated

Self-Adjusting SuperTrendWhat is this tool?
This is an implementation of the well-known SuperTrend indicator that can adjust parameters on the fly to achieve a better profitability.
The algorithm was borrowed from Profitable SuperTrend and connected to the basic SuperTrend implementation. So, now it will switch parameters automatically without any manual work required.
Alerts
The same alerts as for the basic SuperTrend + special alert to notify user about parameters switching.
Profitable SuperTrend indicator can be found here:
SuperTrend indicator can be found here:
Good luck!

Profitable MAMA & FAMA CrossoverIntroduction
The MESA Adaptive Moving Average (MAMA) was originally presented by John F. Ehlers. By design, it is a special kind of Exponential Moving Average with self-adjusting alpha. Its adaptation is based on the rate change of phase as measured by the Homodyne Discriminator and the alpha parameter is allowed to range between a maximum and minimum value (Fast Limit and Slow Limit).
Key Point: Ehlers suggested the maximum value to be 0.5 and the minimum to be 0.05 .
The variable alpha is computed as the Fast Limit divided by the phase rate of change. If the phase rate of change is large, the variable alpha is bounded at the SlowLimit. Then, this alpha is used to compute MAMA and FAMA (Following Adaptive Moving Average).
Should we rely on Ehlers' suggestions if we want to achieve the best result with MAMA & FAMA crossover system?
Well, he is a good specialist and widely recognized author, I respect him, but the answer is no and you can see results on the chart.
What is our goal?
We want to find the best configuration for MAMA & FAMA Crossover. To achieve that we need to analyze the MAMA's alpha parameter or, more specific, the bounds for this parameter, Fast and Slow Limits.
What is this tool?
This tool is a performance optimizer that uses decision tree-based algorithm under the hood to find the most profitable settings for the MAMA & FAMA Crossover. It analyzes a bunch of different Fast Limits (between 0.01 to 0.8 with step of 0.1 ) and Slow Limits (between 0.01 to 0.6 with step of 0.1 ) and backtests each combination across the entire history of an instrument. If the more profitable parameters were found, the indicator will switch its values to the found ones immediately.
So, instead of manually selecting and testing parameters just apply this indicator to your chart and
relax - the algorithm will find the best parameters for you
Alerts
It has a special alert that notifies when the more profitable settings were detected.
NOTE: It does not change what has already been plotted.
NOTE 2: This is not a strategy, but an algorithmic optimizer.
Reference: www.mesasoftware.com
MAMA & FAMA Crossover can be found here:

Master000 automation trade indicatorIndicator description:
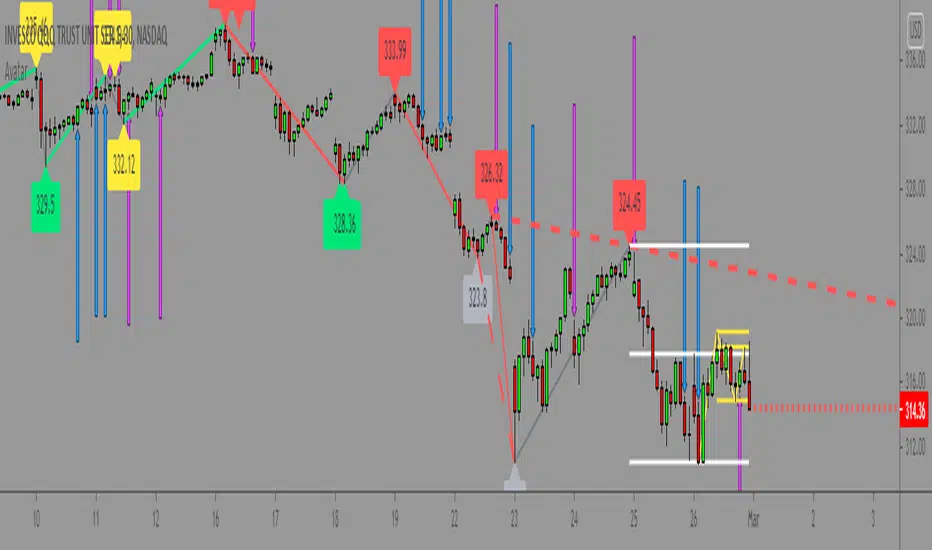
The Master000 indicator is four indicators built into one. They work together to provide trading insights including trend and momentum, reversal points, potential entry points, and projections of future reversal or breakout levels.
Trend power
Shows strength of trend and a change in momentum
Red: The trend has been determined and is short
Lime: The trend has been determined and is long
Aqua: Continuation of the down trend, but showing down trend is in weakness.
Fuchsia: Continuation of the up trend, but showing up trend is in weakness
Yellow: Trend is reversing or trend is missing direction
Zig Zag Trend Lines (Major/Minor )
Major
The trend is graphed based on changes in price. The major trend should be used in deciding which way to enter the trade.
Min or
The minor trend is similar to the major but it is used to determine your entry point. It is easy to spot higher highs or lower lows. Take not when the minor trend fails to set a new high or a new low.
Channels
These dotted lines are provided as a quick guide to determine where the trend is headed. They show if price is getting squeezed and we should look for a break out using a flag or pennant pattern or is there an ever widening channel creating a broadening wedge. Look for hesitation or a reversal near the channel lines.
Entry Signals
Should be taken as a suggestion and not taken everyone. Do your research before entering any trade. There could also be many profitable trades even when an entry signal was not given.
Not good now, just reference for you.
Strategies for using the indicator
Major and minor trendlines: Once major trendline has been set look for a pullback for an entry. Look for a reversal in the major trendline when the minor trendline fails to create a higher high or lower low.
Trend Power: Look for an optimal entry point when the trend power turns teal. This mean the trend is reversing and should be an optimal place for an entry going against the previous trend.
Indicator Explain video at YouTube:
youtu.be
Anyone can apply to use it, you will get two weeks for testing it. [/b
Just click 'like', when I get the message, I will add you as 'invite only' indicator.
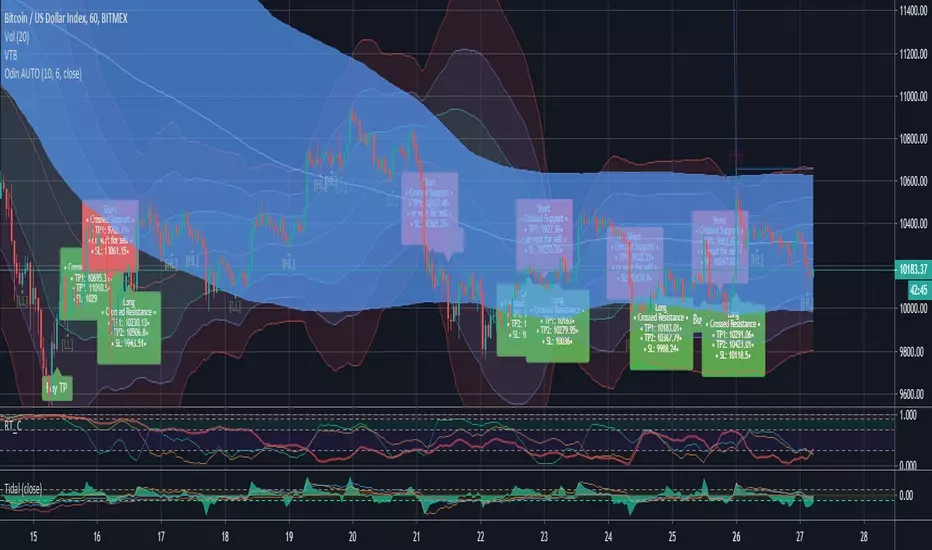
Riptide - Odin AutomatedHey guys,
Its finally here! Automated Odin will allow you to trade the Odin indicator automatically! To learn more about setup and results.

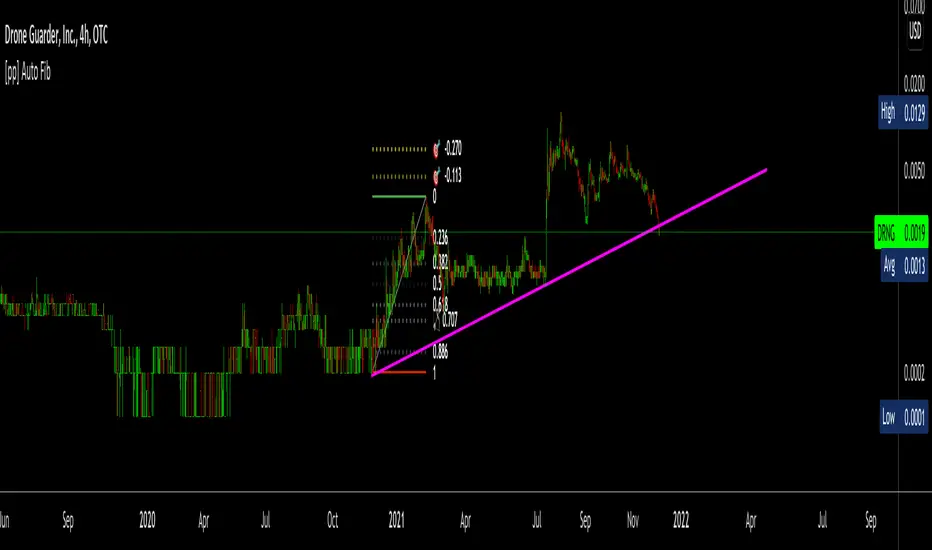
Auto FibonacciAutomatic fibonacci tool.
Still in beta, but works.
will be updating in the future with better improvements, depending on popularity.
Feedback and suggestions welcome.
Quad Moving AvgeragesHello Fellow Traders!
-------------------------------------------
This is the newest addition to Gnome Alerts PRO!
Trade Moving Average Breakouts with Minimal Drawdon.
This Bot Script works on all Crypto, Leverage, Forex, & Traditional Exchanges.
FEATURES
------------------------
*Autoview Ready*
- Easy to Use
- Backtesting Included
-Take Profit
- Stop Loss
You can get access to any of my scripts by visiting my Website, link is in Tradingview Bio ... Just click on the Gnome!

Quad Moving Avgerages BackTestHello Fellow Traders!
-------------------------------------------
This is the newest addition to Gnome Alerts PRO!
Trade Moving Average Breakouts with Minimal Drawdon.
This Bot Script works on all Crypto, Leverage, Forex, & Traditional Exchanges.
FEATURES
------------------------
*Autoview Ready*
- Easy to Use
- Backtesting Included
-Take Profit
- Stop Loss
You can get access to any of my scripts by visiting my Website, link is in Tradingview Bio ... Just click on the Gnome!

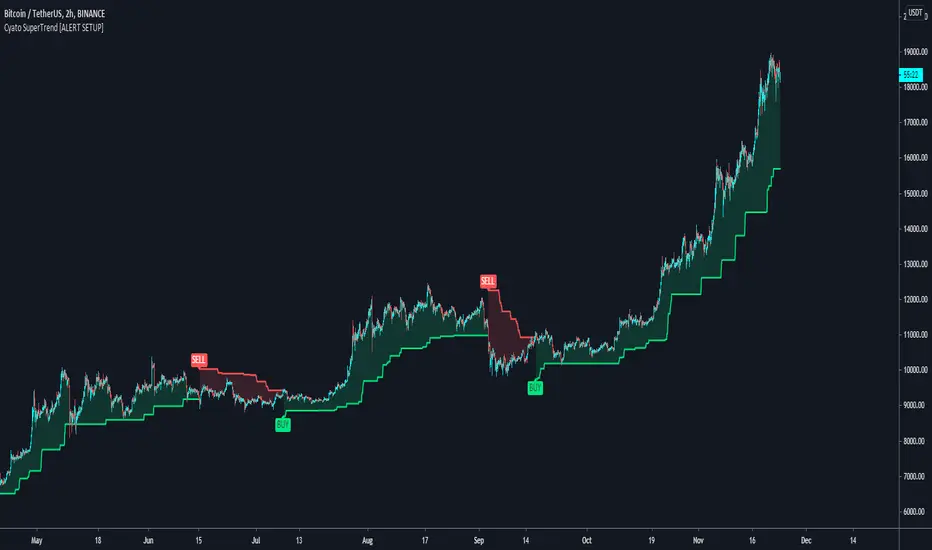
Cyatophilum SuperTrend [ALERT SETUP]Cyatophilum SuperTrend V1
A multi-timeframe indicator with Buy and Sell Alerts, built on ATR. (Averate True Range).
The SuperTrend line can be used as support when green, and resistance when red.
Reversals are strong buy/sell signals but perform badly in range markets.
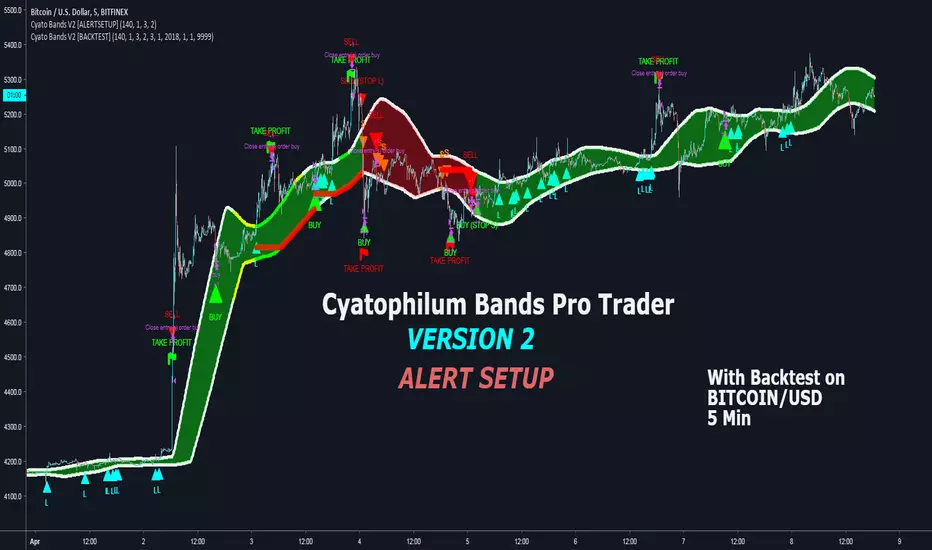
Cyatophilum Bands Pro Trader V5 [ALERTSETUP]Alert Setup version
Get the Free Backtest version here :
This version includes a new feature.
Trailing Take Profit with % deviation.
For those seeing the indicator for the first time, it works like Donchian Channels with lag and a channel width condition to detect breakouts. On top of that I integrated a Stop Loss and Take Profit system to pinescript.
Backtest results below are calculated with :
Short + Long Strategy
0.05% Commission
100% of 10 000% equity per trade
Strategy data from 25/04/2019 to 18/05/2019
Default Configuration for BITFINEX:ETHBTC 3 minutes timeframe.
This version also has the Stop Loss / Take Profit system included in the previous version, plus a short / long setup distinction. For example you can choose a different stop loss % for long and for short trades.
Previous version:
Get access to the Alert Setup version and automate the strategy today !
Purchase the Cyatophilum Indicators pack
I will publish backtests and configurations so make sure to follow me if you don't want to miss anything !
My Website - blockchainfiesta.com -
My Discord channel - discord.gg -
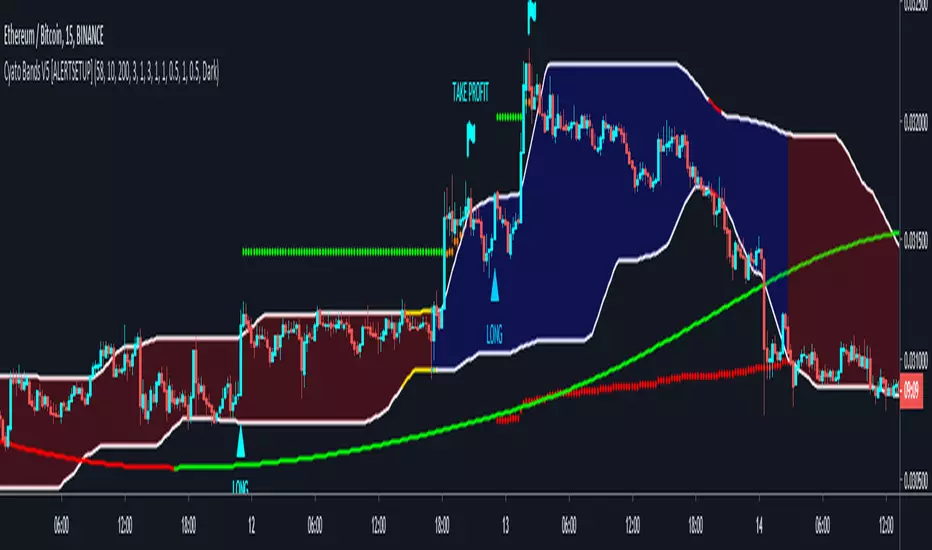
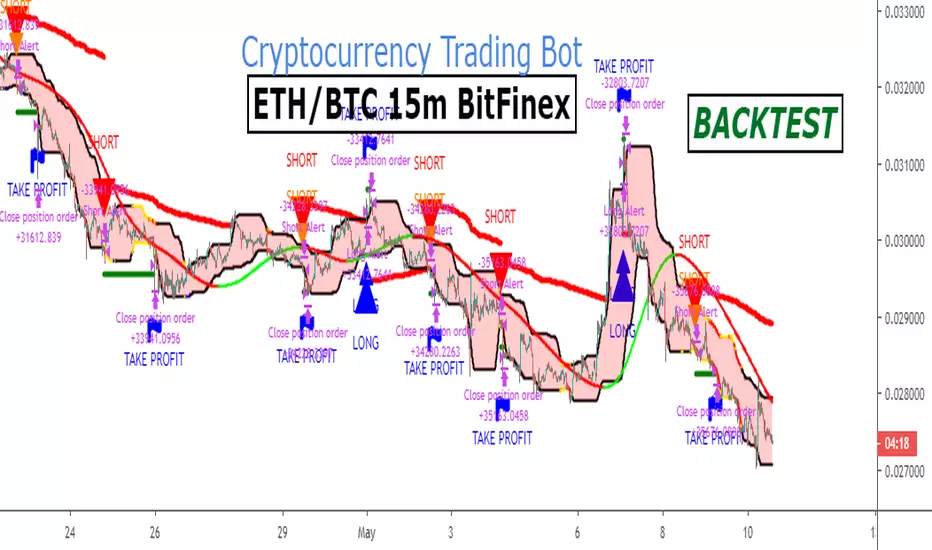
Ethereum FREE Backtest Version ETHBTC 15m BITFINEXA strategy for trading ETH/BTC in 15m timeframe.
The strategy includes long and short trades.
You can find the Alert Setup version below.
More info here .
-------------------------------------------------------------------------------
My website : blockchainfiesta.com
Automated Strategies for TradingView
Bitcoin FREE BACKTEST Version BTCUSD 5m BITFINEXA strategy for trading BTC/USD in 5m timeframe.
The strategy includes long and short trades.
You can find the Alert Setup version below.

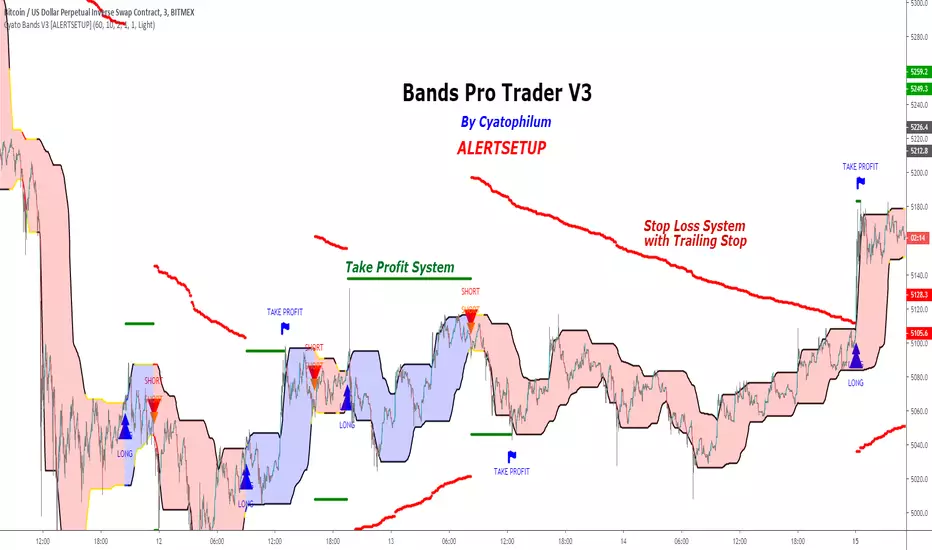
Cyatophilum Bands Pro Trader V3 [ALERTSETUP]An Original Automated Strategy that can be used for Manual or Bot Trading, on any timeframe and market.
>> Presentation <<
This script comes with a Backtest Version
How it works
No, these are NOT Bollinger Bands..
The Cyatophilum Bands are an original formula that I created. You will probably never find it anywhere else.
Their behavior is the following:
When they are horizontal it means the trend is going sideways and they represent supports (lower band) and resistances (upper band).
When they are climbing or falling it means the trend is either bullish or bearish and they represent Trend Lines.
The strategy enters Long on a Bull Breakout and enters Short on a Bear Breakout.
The exits are triggered either on a Trend Reversal, a Stop Loss or a Take Profit.
FEATURES
Take Profit System
Stop Loss System
Show Net profit Line
More features here
Finding a profitable configuration is GUARANTEED
0. Choose your symbol and timeframe. Then add the Backtest version to your chart. If at any time you decide to change your timeframe, go back to step 1.
1. Open the strategy tester and look at the buy & hold line.
If it is mostly climbing (last value greater than 0) then it means we are in a bull market. You should then opt or a long only strategy.
If it is mostly dropping (last value lower than 0) then it means we are in a bear market. You should then opt or a short only strategy.
Note : This first step is really important. Trading against the market has very little chances to succeed.
2. Go into the Strategy Input Parameters:
check "Enable Long Results" and uncheck "Enable Short Results" if you are in a long only strategy.
check "Enable Short Results" and uncheck "Enable Long Results" if you are in a short only strategy.
3. Open the Strategy Tester and open the Strategy Properties.
We are going to find the base parameters for the Bands.
The "Bands Lookback" is the main parameter to configure for any strategy. It corresponds to how strong of a support and resistance the bands will behave. The lower the timeframe, the higher lookback you will need. It can move from 10 to 60. For example 60 is a good value for a 3 minute timeframe. Try different values, and look at the "net profit" value in the Overview tab of the Strategy Tester. Keep the Lookback value that shows the best net profit value.
Then play with the "Bands Smoothing" from 2 to 20 and keep the best net profit value.
The "Band Smoothing" is used to reduce noise.
Usually, the default value (10) is what gives the best results.
From this point you should already be able to have a profitable strategy (net profit>0), but we can improve it using the Stop Loss and the Take Profit feature.
4. To activate the Stop Loss feature, click on the "SECURITY" checkbox
You should see horizontal red lines appear.
A Long/short exit alert will be triggered if the price were to cross this line. (A red Xcross will appear)
Choose the Stop Loss percentage.
On top of that, you can enable the feature "Trailing Stop". It will make the red line follow the price, at a speed that you can configure with the "Trailing Speed" parameter.
Now, sometimes a stop is triggered and it was just a fakeout. You can enable "Re-entries after a stop" to avoid missing additional opportunities.
5. To activate the Take Profit feature, click on the "TAKE PROFIT" checkbox
You should see horizontal green lines appear.
A Long/short exit alert will be triggered if the price were to cross this line. (A flag will appear)
Choose the Take Profit percentage.
A low takeprofit will provide a safer strategy but can reduce potential profits.
A higher takeprofit will increase risk but can provide higher potential profits.
6. Money Management
You can configure the backtest according to your own money management.
Let's say you have 10 000 $ as initial capital and want to trade only 5%, set the Order Size to 5% of Equity.
You can increase net profit by increasing the order size but this is at your own risk.
How to create alerts explained here
Sample Uses Cases
Use it literally anywhere
This indicator can be used on any timeframe and market (not only cryptocurrencies).
About the Backtest below
The Net Profit (Gross profit - Gross loss) is calculated with a commission of 0.05% on each order.
No leverage used. This is a long strategy.
Each trade is made with 10 % of equity from an inital capital of 10 000$. The net profit can be bigger by increasing the % of equity but this a trader's rule to minimise the risk.
I am selling access to all my indicators on my website : blockchainfiesta.com
To get a 2 days free trial, just leave a comment , thanks !
Join my Discord for help, configurations, requests, etc. discord.gg
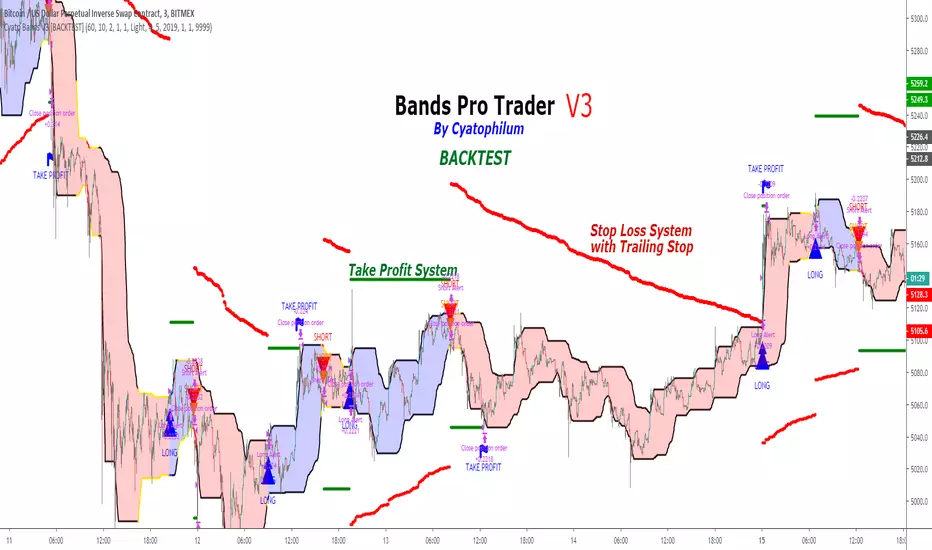
Cyatophilum Bands Pro Trader V3 [BACKTEST]An Original Automated Strategy that can be used for Manual or Bot Trading, on any timeframe and market.
>> Presentation <<
How it works
No, these are NOT Bollinger Bands..
The Cyatophilum Bands are an original formula that I created. You will probably never find it anywhere else.
Their behavior is the following:
When they are horizontal it means the trend is going sideways and they represent supports (lower band) and resistances (upper band).
When they are climbing or falling it means the trend is either bullish or bearish and they represent Trend Lines.
The strategy enters Long on a Bull Breakout and enters Short on a Bear Breakout.
The exits are triggered either on a Trend Reversal, a Stop Loss or a Take Profit.
FEATURES
Take Profit System
Stop Loss System
Show Net profit Line
More features here
Finding a profitable configuration is GUARANTEED
0. Choose your symbol and timeframe. Then add the Backtest version to your chart. If at any time you decide to change your timeframe, go back to step 1.
1. Open the strategy tester and look at the buy & hold line.
If it is mostly climbing (last value greater than 0) then it means we are in a bull market. You should then opt or a long only strategy.
If it is mostly dropping (last value lower than 0) then it means we are in a bear market. You should then opt or a short only strategy.
Note : This first step is really important. Trading against the market has very little chances to succeed.
2. Go into the Strategy Input Parameters:
check "Enable Long Results" and uncheck "Enable Short Results" if you are in a long only strategy.
check "Enable Short Results" and uncheck "Enable Long Results" if you are in a short only strategy.
3. Open the Strategy Tester and open the Strategy Properties.
We are going to find the base parameters for the Bands.
The "Bands Lookback" is the main parameter to configure for any strategy. It corresponds to how strong of a support and resistance the bands will behave. The lower the timeframe, the higher lookback you will need. It can move from 10 to 60. For example 60 is a good value for a 3 minute timeframe. Try different values, and look at the "net profit" value in the Overview tab of the Strategy Tester. Keep the Lookback value that shows the best net profit value.
Then play with the "Bands Smoothing" from 2 to 20 and keep the best net profit value.
The "Band Smoothing" is used to reduce noise.
Usually, the default value (10) is what gives the best results.
From this point you should already be able to have a profitable strategy (net profit>0), but we can improve it using the Stop Loss and the Take Profit feature.
4. To activate the Stop Loss feature, click on the "SECURITY" checkbox
You should see horizontal red lines appear.
A Long/short exit alert will be triggered if the price were to cross this line. (A red Xcross will appear)
Choose the Stop Loss percentage.
On top of that, you can enable the feature "Trailing Stop". It will make the red line follow the price, at a speed that you can configure with the "Trailing Speed" parameter.
Now, sometimes a stop is triggered and it was just a fakeout. You can enable "Re-entries after a stop" to avoid missing additional opportunities.
5. To activate the Take Profit feature, click on the "TAKE PROFIT" checkbox
You should see horizontal green lines appear.
A Long/short exit alert will be triggered if the price were to cross this line. (A flag will appear)
Choose the Take Profit percentage.
A low takeprofit will provide a safer strategy but can reduce potential profits.
A higher takeprofit will increase risk but can provide higher potential profits.
6. Money Management
You can configure the backtest according to your own money management.
Let's say you have 10 000 $ as initial capital and want to trade only 5%, set the Order Size to 5% of Equity.
You can increase net profit by increasing the order size but this is at your own risk.
How to create alerts explained here
Sample Uses Cases
Use it literally anywhere
This indicator can be used on any timeframe and market (not only cryptocurrencies).
About the Backtest below
The Net Profit (Gross profit - Gross loss) is calculated with a commission of 0.05% on each order.
No leverage used. This is a long strategy.
Each trade is made with 10 % of equity from an inital capital of 10 000$. The net profit can be bigger by increasing the % of equity but this a trader's rule to minimise the risk.
I am selling access to all my indicators on my website : blockchainfiesta.com
To get a 2 days free trial, just leave a comment , thanks !
Join my Discord for help, configurations, requests, etc. discord.gg
21 TraderHello Fellow Traders!
-------------------------------------------
This is the newest addition to Gnome Alerts PRO!
Trade Moving Average Breakouts with Minimal Drawdon.
This Bot Script works on all Crypto, Leverage, Forex, & Traditional Exchanges.
FEATURES
------------------------
*Autoview Ready*
- Easy to Use
- Backtesting Included
-Take Profit
- Stop Loss

Market Type IdentifierHelps to evaluate if a market is crypto, forex or stocks. Useful if you want to use specific Ichimoku settings or certain moving averages without having to manually change the settings. This is mostly provided for other Pinescript coders, so will not be useful as a standalone indicator

Cyatophilum Bands Pro Trader V2 [BACKTEST]An Original Automated Strategy that can be used for Manual or Bot Trading, on any timeframe and market.
Presentation Page with video
How it works
If you haven't yet please check the ALERT SETUP description.
How to use
Use the specific Backtest options to:
Choose a time period
Enable/Disable Long and Short results
Show the Netprofit Line on chart (green line)
About the Backtest
The Net Profit (Gross profit - Gross loss) is calculated with a commission of 0.05% on each order.
Each trade is made with 100 % of equity from an inital capital of 4000$
No leverage used. Shorts and Longs results are enabled.
Note: You can use this backtest version for finding the best configuration for your favorite market/timeframe. I will also be there to help you.
Find more backtests and configurations on my Discord : discord.gg
Can be easily automated with Autoview.
Get the indicator today!

Cyatophilum Bands Pro Trader V2 [ALERTSETUP]An Original Automated Strategy that can be used for Manual or Bot Trading, on any timeframe and market.
Presentation page with video
How it works
The Cyatophilum Bands behave as either Trend Lines during a bear or bull market, or Support and Resistance during a Flat Market. Buy and Sell signals trigger upon Trend Reversal Breakouts.
Stop Loss System
An integrated Stop Loss System. Helps reducing risk by creating buy and sell signals when the price breaks through the red line.
Trailing Stop
Transform your Stop Loss into a Trailing Stop Loss. The red line will increase/decrease to secure profits.
Take Profit
Secure your profits using this new feature! When a flag appears, a buy/sell signal will trigger.
Re-Entries
A feature that can be helpful when using Take Profit or for manual trading in case you missed a trade.
Use it literally Anywhere
This indicator can be used on any timeframe and market (not only cryptocurrencies).
Backtest Below
Note: can be easily automated with Autoview
Get the indicator today!
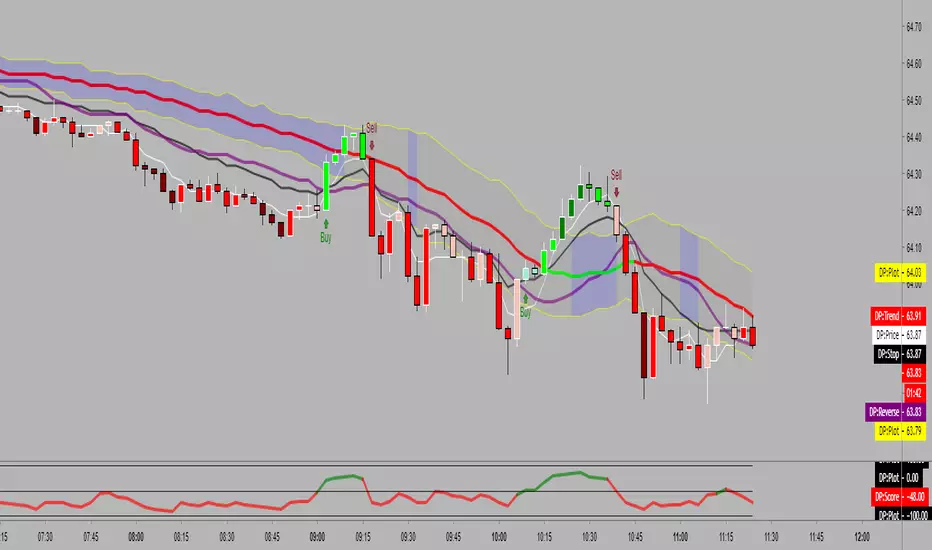
Moving pivot: WontonProtected.
Price action analysis.
Gray = No signal, do nothing
Blue = Exit Position (may just move from buy to sell and skip this depending on price action)
Green= Buy
Lime (brighter) = Strong Buy
Maroon= Sell
Red (brighter) = Strong Sell
The Price Action Balance line or the Long Term Trend line (yellow) can either be used for stop/reversal placement, triggered on close.
Basecamp AutoFibAutomatic Fibonacci Support and Resistance derived from the recent Average True Range.
This tool is used as a guideline for where mathematically evident support and resistances are estimated to be.
Unlike typical methods, this will adjust as candles print and the ATR expands or contracts assisting the user in ensuring realistic price targets relative to the current movement.

Supertrend Multi Time Frame - Auto HTF calculationThere is already SuperTrend indicator and thanks to its developer.
This script draws supertrend for current and higher time frame, it automatically calculates higher time frame and you don't need to adjust it when you change the period.
it also change the color of bars according to current and HTF supertrend, so you can see the trend by looking at bars color.
Bar color is lime if trend is up and red if trend is down. but if you see white bars then there is movement opposite the main trend.
if you like it please comment.

SKEW PRO BacktestHello Fellow Traders!
-------------------------------------------
This is the newest addition to Gnome Alerts PRO!
This Bot Script works on all Crypto, Leverage, Forex, & Traditional Exchanges.
FEATURES
------------------------
*Autoview Ready*
- Easy to Use
- Backtesting Included
- Stop Loss
More info on how gain access in my profile!
