ENVELOPE BOLLINGER KELTN IMPULSE EMA SMA SAFEZONE SAR CHANDELIERALL THIS ALL IN ONE!
there are many options to check or uncheck to show only the tool that you need at that particular moment.
ENJOY!
ENVELOPE BOLLINGER KELTNER IMPULSE EMA SMA SAFEZONE SAR CHANDELIER
布林帶(BB)

EMA Bollinger BandsThis is a simple Bollinger Bands indicator that uses the exponential moving average instead of the simple moving average.

MTF Bollinger Bands - ModifiedModified version of tansancrypto's MTF Bollinger to Pinescript 4 and removed limiters on BB1/BB2 max Sigma values.
Original Script:

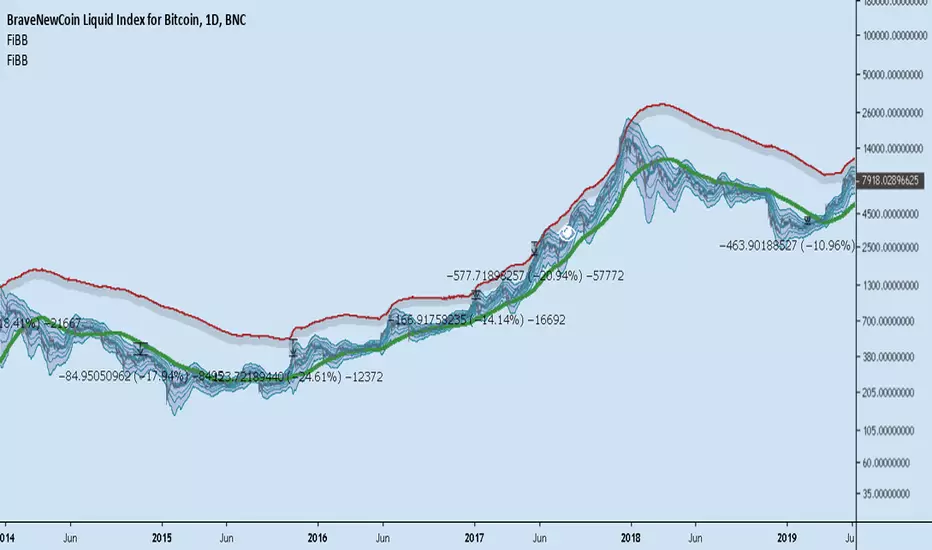
Bollinger Bands Width 10標準偏差Standard Deviation(bolliger bands width)を10本重ねたものになります。お好みのスパン、色、σでお使いください。

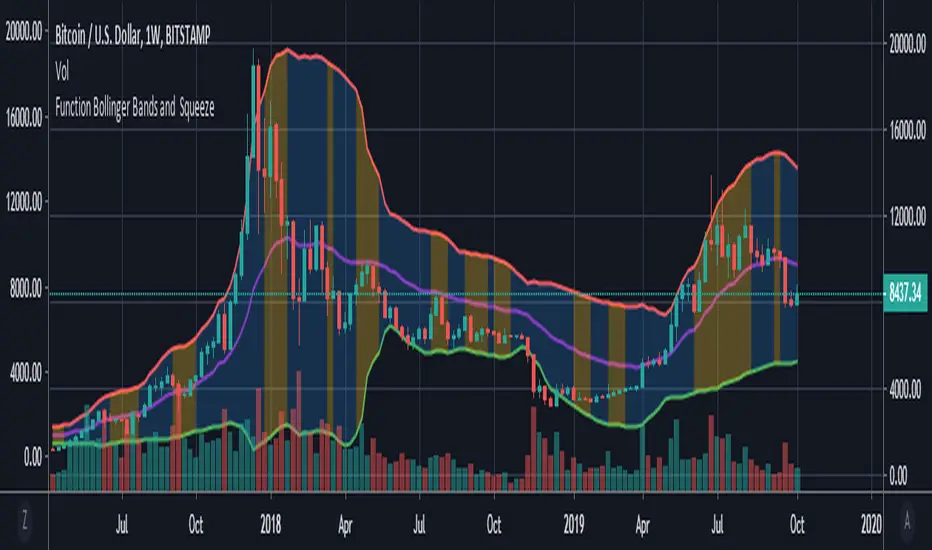
Function : Bollinger Bands and BBW Squeeze DetectorThis script shows Bollinger Bands function and want to detect Bollinger Band Width Squeeze with a successful, different perspective .
Bollinger Bands : You can specify the Bollinger Bands periods as mutable variables .
Bollinger Band Width Squeeze : First the Bollinger bands width was calculated.The width was then divided into levels using the money flow index.
Thus, the bollinger takes into account the available volume averages when calculating the band width mfi (Money Flow Index).
After this modelling, we can limit and color the lower limit and upper limits just as Relative Strength Index.
We can even put warnings on oversold areas if desired. Let's not forget that we are working with width rather than price.
By design, squeeze areas are defined directly above the Bollinger Bands with coloration. I think it is very practical and looks stylish.
I tried and found it quite successful and wanted to share it with users.
I came up with many ideas when I wrote this system, and I will share them very soon . I hope it will be useful to users and give new ideas.
Best regards.


Bollinger Bands with Multiple Moving AveragesBolling bands with a triple MA overlay in one indicator

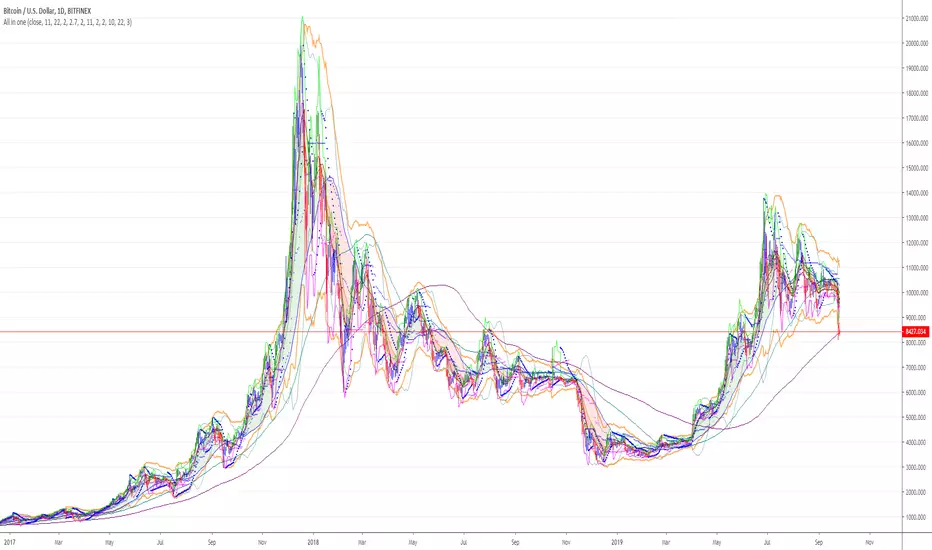
Multi EMA/SMA with Bollinger Bands Combo 1.0This script provides:
5 regular EMAs
5 regular SMAs
3 multiple time frame EMAs
3 multiple time frame SMAs
Bollinger Bands
All features can be turned on/off and customized regarding color, lines, etc.
Excellent for TradingView users with limited or free accounts.

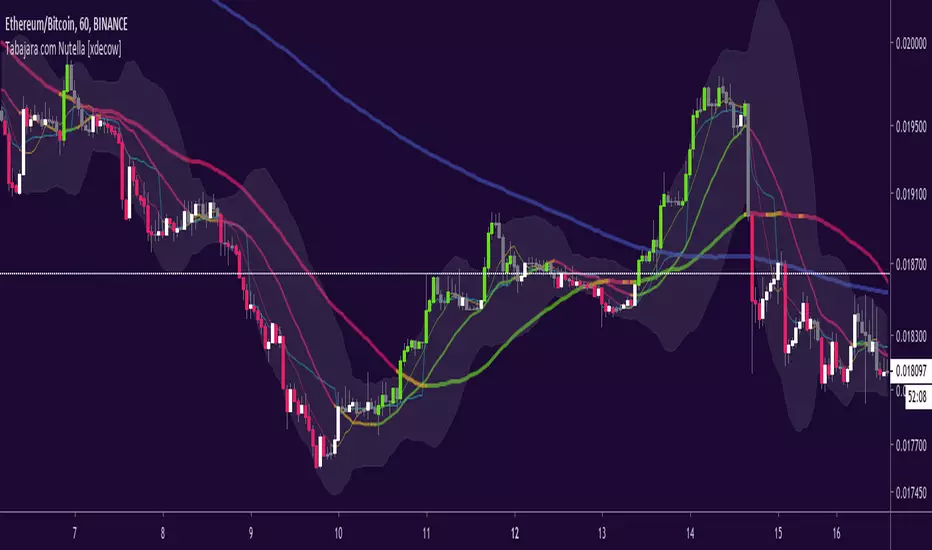
Tabajara com Nutella [xdecow]Tabajara setup from André Machado
-ma 8
-ma 20
-ma 50
-ma 200 (blue)
-vwap (aqua)
-bollinger bands
-barcolor based on tabajara rules


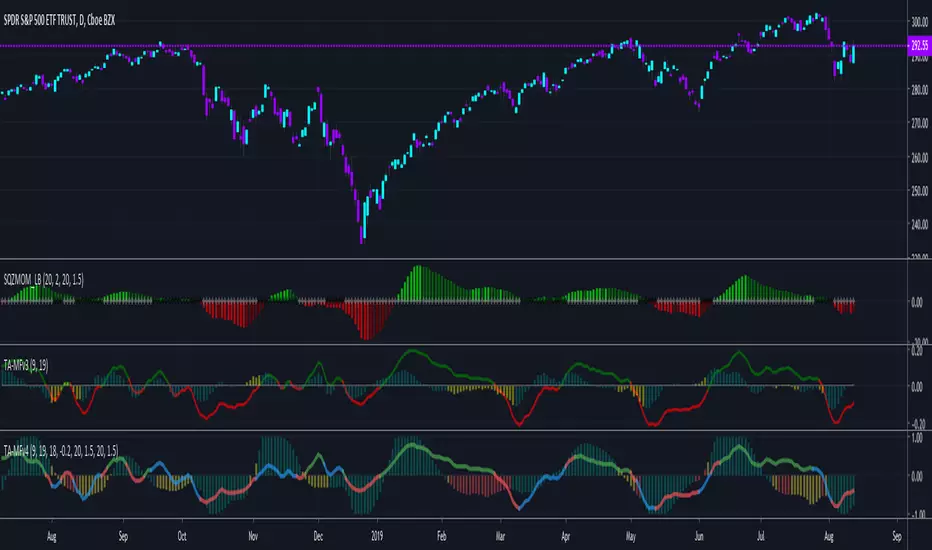
TA-Money Flow-Version4Updated for TV-Pine V4
This is the MACD of a stochastic OBV movement indicator and now the MACD of the Squeeze Momentum Indicator. It is good (right) to work with both price and volume...it is also good to utilize the most popular indicator ever in TV (Lazybear).
I've included highlighting based on price divergence, yellow is divergence of either OBV or SQZ, red is both divergence, and then I've also built in the "squeeze on - blue" highlighting to show follow through of divergence. It works great on any time frame, but you need to have volume data. Not sure where I originally got this (stoch-OBV, somewhere off Tradingview several years ago, thanks to the person who shared), Squeeze is Lazybear, links below.
Enjoy.
Version 4:
Updated OBV equation because TV-Pine V3 broke in V4
Included MACD of Squeeze for histogram
Included "squeeze on" highlighting
TA-Money-Flow-Version3
TA-Money-Flow-Version2
Squeeze-Momentum-Indicator-LazyBear
IO_BB_WidthJohn Bollinger's academic version of Bollinger Bands width
Added some customizations around background colors.
If background color is colored, then the market is trending.

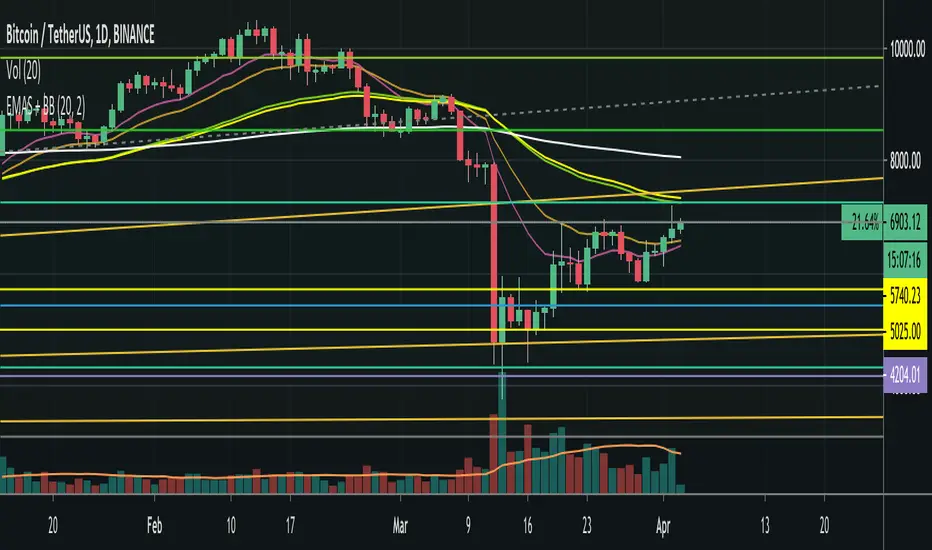
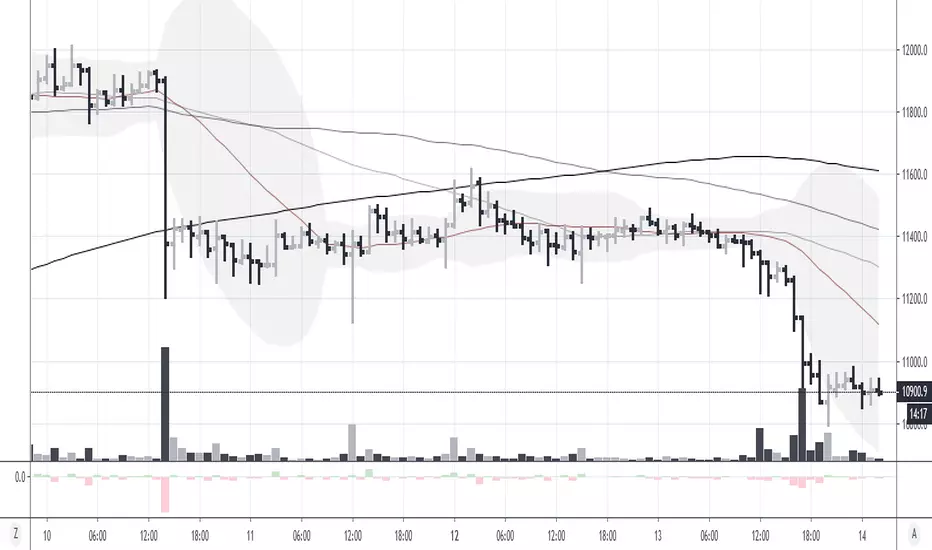
BolingerBands_Contraction_Bitcoin_dailyThe script visualises the contraction or tightness of the Bollinger Bands (example Bitcoin on the daily timeframe). The contraction values have to be adjusted for each asset/coin/stock and timeframe. See what works for you.
Multiple Moving AveragesThis is an indicator with 4 moving average slots and 6 exponential moving average slots
It also has bollinger bands and a volume weighted moving average slot
Feel free to edit this and add/remove some and publish your own
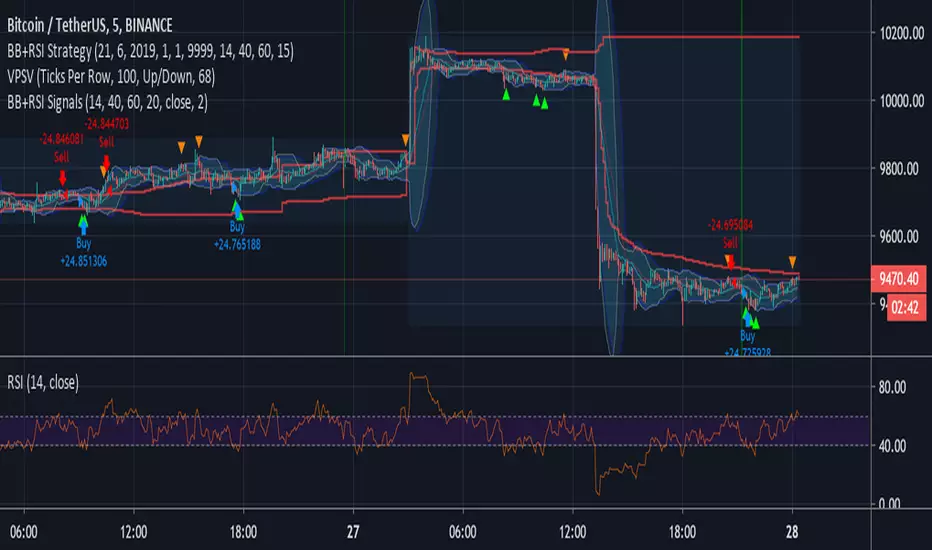
Bollinger + RSI Signals (by Bader Kamal)This idea originally by ChartArt on January 14, 2015 as Strategy, and I modify it to become as Signals on 26 July 2019.
This signals uses a modified RSI to sell when the RSI increases over the value of 60 (or to buy when the value falls below 40), with the classic Bollinger Bands strategy to sell when the price is above the upper Bollinger Band (and to buy when this value is below the lower band).
This signals only triggers when both the RSI and the Bollinger Bands indicators are at the same time in a overbought or oversold condition.
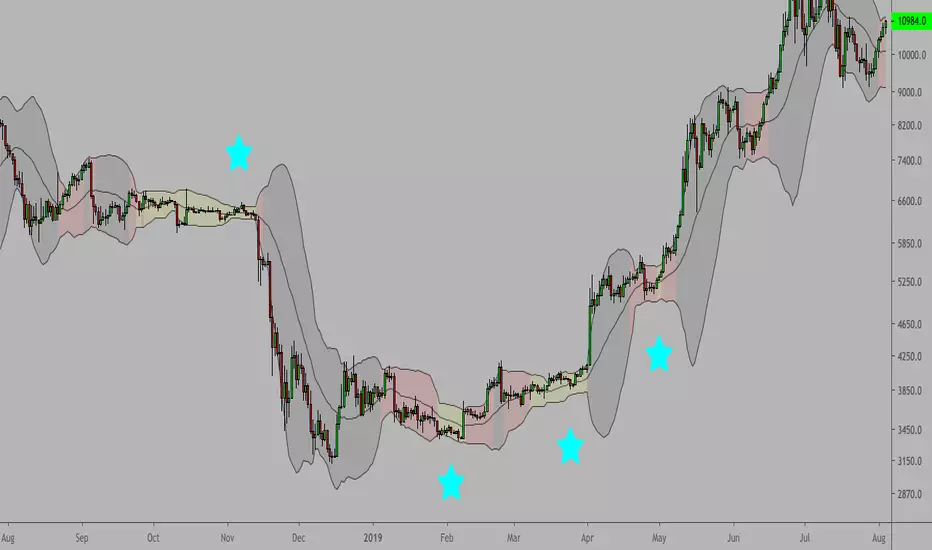
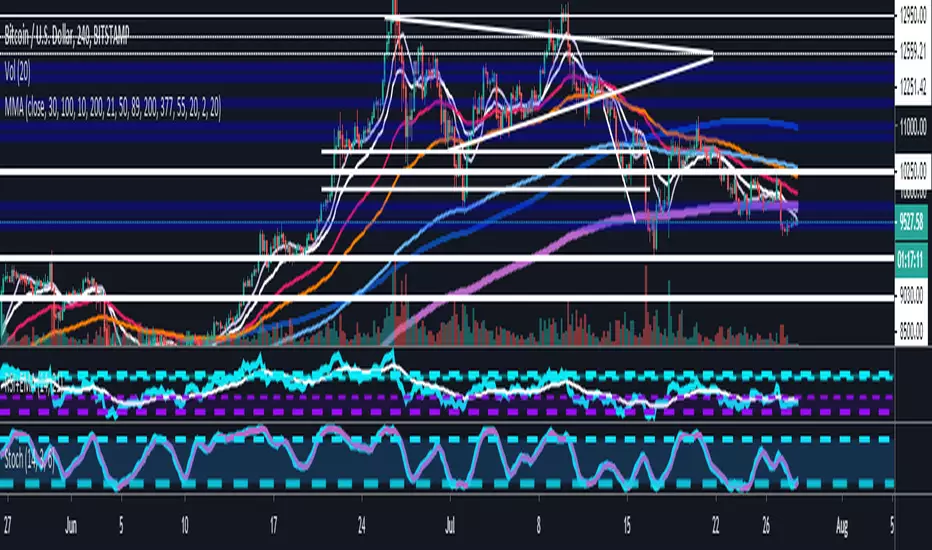
Bollinger bands/Lagging span crossHello my dear ambitious traders
I'm working hard this week to publish some great indicators this week and open sourced. Hope you'll enjoy, learn and use them.
This will be my greatest reward but comments showing appreciation are also very welcomed (actually likes too) :)
For today, I'll share a simple indicator but it's coming along with some insightful knowledge ^^
Anyway, I'm not here to ask you to this but to share a very cool indicator I made a few months ago and wanted to share for FREE with the community today
The indicator is related to this educational post : What-a-Bollinger-Bands-Lagging-span-cross-can-tell-us/
This trading technique was invented by Robbytrade, a famous french trader twitter.com
I wanted to have those visual signals on the chart so I coded it.
The advantage of being a developer is that you can litteraly code what you miss and get your life better in the process. The one that will find a way to code a new form of money will be rich... wait.... that guy is called Satoshi Nakamoto...
That's all for me today my friends
PS
Trying to update the Trade Manager shared yesterday with some cool features. More to come in the upcoming days
Enjoy
Dave