Breakout Probability Indicator (FinnoVent)The Breakout Probability Indicator is a cutting-edge tool designed for traders looking to gauge the likelihood of price breakouts above or below current levels. This indicator intelligently combines Average True Range (ATR) and recent price action to provide a probabilistic insight into potential future price movements, enhancing strategy formulation and risk management.
Core Features:
Volatility Assessment: Utilizes the Average True Range (ATR) to measure market volatility, a critical component in identifying potential breakout scenarios.
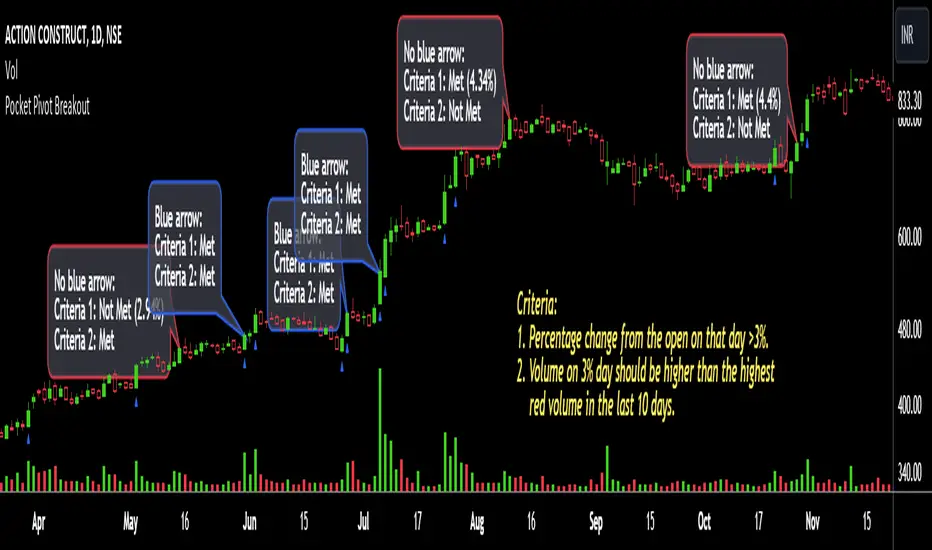
Dynamic Price Levels: Calculates and plots potential breakout levels based on recent highs and lows, adjusted for current market volatility.
Probability Estimation: Provides an estimation of the probability of reaching these breakout levels, using a responsive logarithmic scale for improved sensitivity.
Real-time Updates: Continuously updates probabilities and levels as new price information becomes available, ensuring traders have the most current data at their fingertips.
Usage:
Add this indicator to any chart in TradingView to see the upper and lower breakout levels, each accompanied by a dynamically calculated probability percentage. These probabilities help traders understand the potential for price movement in either direction, forming a basis for entry or exit decisions, stop-loss placement, and strategy adjustments.
Compliance and Guidelines:
This script is shared for educational purposes, offering a novel approach to understanding market dynamics. It does not constitute financial advice and should be used as part of a comprehensive trading strategy. Traders are encouraged to backtest and paper-trade any new tool before live implementation to ensure it aligns with their trading style and risk tolerance.
Pine Script®指標