Support Resistance BreakthroughThe Support Resistance Breakthrough (SRB) is a comprehensive technical indicator that aims to evaluate market strength and detect potential breakout opportunities. It integrates the following elements:
ADX (Average Directional Index): Helps measure the overall trend strength. You can adjust both the ADX length and smoothing length.
ATR (Average True Range): Provides a measure of market volatility.
RSI (Relative Strength Index): Measures the momentum and helps identify overbought or oversold conditions.
Weighting Scheme: The weighting scheme adds or subtracts a fraction of the ROC of RSI, modulated by ATR and ADX. The weighting percentage can be customized.
Normalization Option: Allows the user to plot normalized values, scaling them between 0 and 100.
Horizontal Lines: Useful reference lines at 0, 50, and 100, displayed when normalization is used.
Interpretation: When the indicator is above the 0 line (or 50 when normalized), there's a high chance of breaking through resistance. Conversely, when it's below the 0 line, there's a high chance of breaking through support. Together with a momentum indicator, such as RSI and/or Stochastic RSI, this indicator functions excellently.
The combination of these elements makes the SRB an adaptable tool for various trading strategies. It can help identify potential breakout or breakdown areas and gauge the underlying strength of the market.
Compatibility with Adjustable Fibonacci Retracement Indicator: Together with the SRB indicator, the AFIBR can make it easier to determine the likelihood of breaking through support or resistance.
Breakout

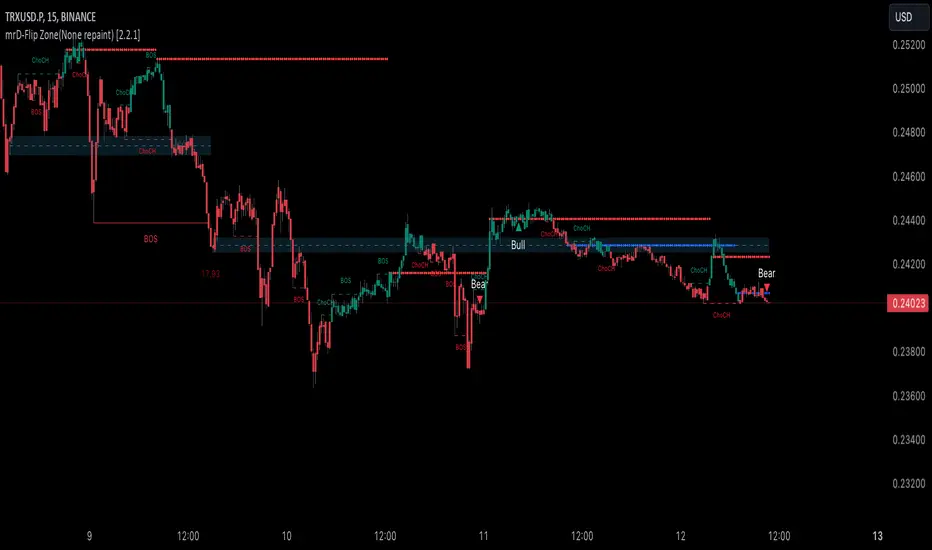
mrD-Flip Zone(None repaint) [1.0]This indicator provides Flips Zones, to easily observe price action and the user can evaluate reversal zones.
This indicator also includes warnings when flip zones appear.
🔶 SETTINGS
- Current-Timeframe: Hide/Show Flips Zones in the current time frame.
- High-Timeframe: Hide/Show Flips Zones in the High time frame.
- Current Timeframe (color): Color Display Flips Zones in the current time frame.
- High Timeframe (color): Color Display Flips Zones in the current time frame.
🔶 The logic is described below:
The main characteristic that this indicator has is that it is possible to identify zones where prices can react.
The second feature that shows the best use of this indicator is that it shows the flips area of the larger timeframe in the current timeframe.
This indicator also acts as support and resistance levels.
This script is based on the function of Pivot High Low.
- New Pivot Low is identify
- New Pivot High is to identify
- New Pivot Low lower previous Pivot Low
- Upper Line of the Flips Zone is the high-price previous Pivot Low
- Lower Line of the Flips Zone is the low-price new Pivot Low
=>Flips box will be marked on the chart in the current time frame and the Flips box in the high time frame
*Special feature: the Flips box order shows different time frames.
🔶 USAGE
The Flips Zones are displayed by the script to provide can price reversal zones.
At Flips Zones, prices can reverse or continue the trend.
The Flips Zones are displayed by the script to provide price can reversal zones.
Once the Flips Zone is formed, the price action could retest. Can expect a price reversal or continue the trend.
The Flip Zones of the higher timeframe are displayed in the current timeframe according to the user's settings.
If the Flip Zones on the current timeframe and the Flip Zones on the higher timeframe overlap, Price can retest and reverse the trend quickly.
The trend can be determined by looking at the price position relative to the flips zone box. Price breaking out of flip zones is a sign of a downtrend, while price breaking above supply is a sign of an uptrend.
Note: This indicator is Non-repaint.
This indicator is great to use in confluence with other indicators or with various candlestick patterns.
Remember, don't make decisions based only on the one-time frame. Check the overall trend of the stock and look at Flip Zone in the high time frame.
🔶General disclaimer:
Trading stocks, futures, forex, options, ETFs, cryptocurrency, or any other financial instrument has huge potential rewards and risks.
You must be aware of the risks and willing to accept them to invest in stocks, futures, forex, options, ETFs, or cryptocurrencies.
Don't trade with money you can't afford to lose.
This is not an offer or an offer to Buy/Sell stocks, futures, Forex, options, ETFs, cryptocurrencies, or any other financial instrument.
Do not represent that any account will or is likely to achieve profit or loss of any kind.
The past performance of any trading system or method is not necessarily indicative of future results.
My Scripts/Indicators/Ideas/Algos/Systems are only for educational purposes!
Strategy - Relative Volume GainersStrategy - Relative Volume Gainers
Overview:
This trading strategy, called "Relative Volume Gainers," is designed for Long Entry opportunities in the stock market. The strategy aims to identify potential trading candidates based on specific technical conditions, including volume, price movements, and indicator alignments.
Strategy Rules:
The strategy is focused solely on Long Entry positions.
The volume for the current trading day must be greater than or equal to the volume of the previous day.
The percentage change in price must be greater than or equal to 2.5%.
The Last Traded Price (LTP) must be greater than or equal to the Exponential Moving Average (EMA) 200.
The Relative Volume for the current trading day (calculated over the last 30 days) must be greater than or equal to the Simple Moving Average (SMA) of Relative Volume over the same 30 days.
The current candle on the chart should be Green or Bullish, indicating positive price movement.
The price difference between bid and ask prices should be kept to a minimum.
It's recommended to also analyze market depth for better insights.
Strategy Requirements:
Add the Exponential Moving Average (EMA) 200 to your trading chart.
This strategy can be applied on charts of any timeframe.
For intraday trading, particularly for early entry, consider using a 1-minute timeframe.
It is advisable to create a screener to identify potential trades in real-time market conditions.
Risk Warning:
Stocks that meet the strategy criteria might exhibit high volatility and a high beta, making them inherently risky to trade. Exercise caution and adhere to predetermined risk management strategies.
Determine your trading quantity based on your entry price and stop loss in order to manage risk effectively.
Quantity Calculation Formula:
Quantity calculation is crucial to manage risk and position sizing. The following formulas can be used based on your trading scenario:
Quantity with Leverage:
Quantity = (((Using Capital / 100) * Risk Percent) / (Entry Price - Stop Loss)) * Leverage
Eg: Quantity = (((10000 / 100) * 0.2) / (405.5 - 398.5)) * 5
Quantity = 14
Risk = Rs.100 (Rs.100 is 1% of Rs.10000. So the risk is 1%, means we lose only Rs.100 when the SL is hit. If SL is increased the Quantity will get reduced to maintain a fixed risk of Rs.100)
Quantity without Leverage:
Quantity = (((Using Capital / 100) * Risk Percent) / (Entry Price - Stop Loss))
Note:
Always stay informed about market conditions and be prepared for potential rapid price movements when trading stocks that meet the strategy criteria. Strictly adhere to your predefined risk management strategy to safeguard your capital.

Sublime Trading | Donchian Breakout SignalsWhat kind of traders/investors are we?
We are trend followers. Our scripts are designed to be used on the higher timeframes (weekly/daily) to catch the large moves/trends in the market.
Most have heard of long-term trend following. Few know how to execute the strategy.
Our scripts are designed specifically to identify and invest in long-term market trends.
What does this script do?
It produces entry signals in a confirmed bull and bear trend.
The logic is based on Donchian 20, which serves the following two purposes:
1. Confirms end-of-day entry points in a long-term trend
2. Filters out entry points in a sideways market
The signal is produced on a break and close of the Donchian 20 high in a bull trend and a break and close of the Donchian 20 low in a bear trend.
How is the entry price produced?
The entry is based on a percentage value of the range of the breakout bar added to the high of the bar in a bull trend.
In a bear trend, the percentage is subtracted from the low of the bar.
This gives an objective entry when placing a position once the OHLC of a bar is confirmed at the end of the trading day.
How is the stoploss price produced?
The script uses the formula ATR 15 x 4.
We use ATR as it produces a stoploss which is unique to the volatility of the asset. The more volatile the asset, the wider the stoploss.
We use ATR 15 as it brings an average reading across half a month, incorporating days of extreme volatility.
The multiplier 4 works well to avoid positions being stopped out prematurely on pullbacks.
When the stoploss is hit, there is when traders and investors may consider exiting positions.
What is the best timeframe to use the script?
We recommend the daily timeframe as this is where trader and investors identify and enter long-term market trends.
The higher timeframes are where traders and investors take fewer positions but hold for longer time periods.
As a result, trend followers place priority on the quality of the entry rather than quantity.
What makes this script unique?
This script has been coded specifically for the daily timeframe to:
Highlight the start of a potential long-term trends.
Confirm entry points at the end of the trading day, absorbing intraday noise.
Reduce fake breakouts in a trend.
Continue to create entry points as the trend develops to allow for compounding.
Filter out breakouts in a sideways market.
This entry signal script helps traders and investors focus on the quality of a potential position when investing in long-term market trends.

ATR Extension [QuantVue]The Moving Average ATR Extension Indicator offers a powerful blend of two key market elements: the Average True Range (ATR) and Moving Averages (MA), capturing the dynamics of market momentum and trend direction.
This indicator is used to measure market extension from a user-selected moving average based on multiples of the Average True Range (ATR). By doing this, it becomes remarkably straightforward to spot strength at breakout points or exhaustion near the end of a run.
As a market breaks out the extension indicates a surge in buying pressure, while an extension after a sizeable move can often be an indication of market exhaustion. This extended position essentially reflects over-enthusiastic buying and could be an early warning sign of a potential trend reversal.
Breakout Strength:
Exhaustion:
Give this indicator a BOOST and COMMENT your thoughts!
We hope you enjoy.
Cheers.

Price breakout and reversal [TCS] | PAThis indicator is designed to identify potential breaks and reversals in price movements for a financial instrument.
The indicator displays several elements to assist users in spotting specific market conditions:
1. High and Low Pivots : The indicator marks the highest and lowest points on the price chart within a customizable lookback period. These pivots represent important turning points in the price movement and serve as reference levels for potential breakouts and reversals.
2. Fair Value Line : A horizontal line is drawn at the midpoint between the high and low pivots. This line represents the "fair value" based on the recent price action. Traders may consider this level as a reference for evaluating the price's deviation from its average value.
3. Bullish Breakouts : When the closing price of the financial instrument crosses above the high pivot the indicator identifies a potential bullish breakout. This suggests a possible buying opportunity.
4. Bearish Breakouts : Conversely, a bearish breakout is identified when the closing price crosses below the low pivot. This may indicate a selling opportunity.
5. Fair Value Breakouts : In addition to regular breakouts, the indicator can detect breakouts based on the fair value line. If the closing price crosses above or below the fair value line, it may signal a fair value breakout, indicating the price's potential return to its average level.
6. Reversals : Reversal patterns are essential in technical analysis. The indicator identifies potential bullish and bearish reversals .
The indicator enhances its visual signals with geometric shapes (triangles and diamonds) placed above or below the price bars to represent different types of breakouts and reversals.
Moreover, the indicator can be configured to send alerts to the user when any of these specific events occur, helping traders stay informed and respond promptly to potential trading opportunities.
Please note that this code is for educational purposes only and should not be used for trading without further testing and analysis.

Relative Daily Change% by SUMIT
"Relative Daily Change%" Indicator (RDC)
The "Relative Daily Change%" indicator compares a stock's average daily price change percentage over the last 200 days with a chosen index.
It plots a colored curve. If the stock's change% is higher than the index, the curve is green, indicating it's doing better. Red means the stock is under-performing.
This indicator is designed to compare the performance of a stock with specific index (as selected) for last 200 candles.
I use this during a breakout to see whether the stock is performing well with comparison to it`s index. As I marked in the chart there was a range zone (red box), we got a breakout with good volume and it is also sustaining above 50 and 200 EMA, the RDC color is also in green so as per my indicator it is performing well. This is how I do fine-tuning of my analysis for a breakout strategy.
You can select Index from the list available in input
**Line Color Green = Avg Change% per day of the stock is more than the Selected Index
**Line Color White = Avg Change% per day of the stock is less than the Selected Index
If you want details of stocks for all index you can ask for it.
Disclaimer : **This is for educational purpose only. It is not any kind of trade recommendation/tips.

Breakout FilterIntroduction:
The Breakout Filter is a technical analysis indicator designed to identify potential breakout trading opportunities in the financial markets. It combines breakout conditions based on price and volume with the visualization of Exponential Moving Average (EMA) lines. This indicator can be a valuable tool for traders seeking to capture breakout movements while utilizing EMA lines for additional trend analysis.
Indicator Overview:
The Breakout Filter consists of three main filters: Filter 1, Filter 2, and Filter 3. Each filter has its own set of conditions that need to be met for a breakout signal to be generated. Additionally, the indicator plots EMA lines on the chart to provide further insights into the market trend.
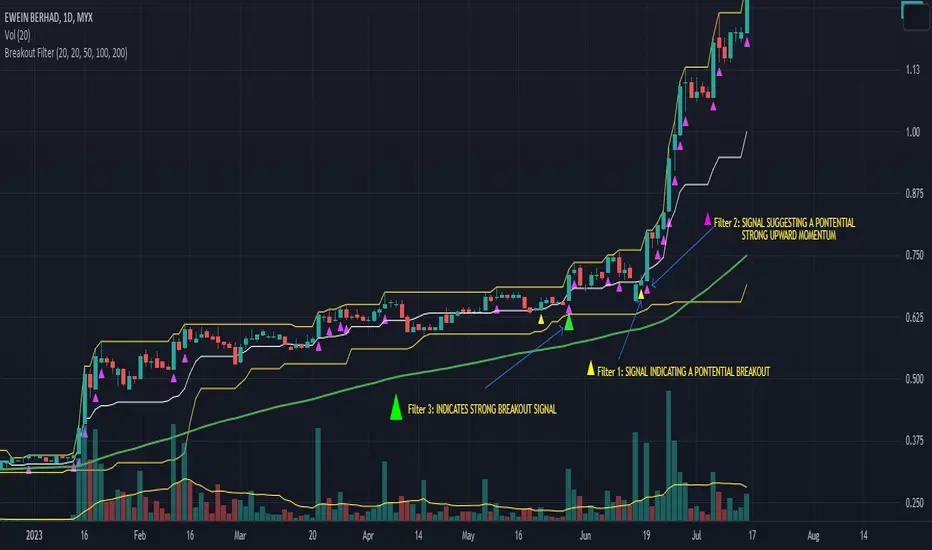
Filter 1: Price & Volume Breakout (Default symbol: Tiny Yellow Triangle)
Filter 1 focuses on identifying breakouts based on both price and volume criteria. It considers the following conditions:
- Price Breakout: The close price crosses above the Donchian Channel's middle line, indicating a potential upward breakout.
- Volume Breakout: The trading volume exceeds the moving average of volume, suggesting increased market participation during the breakout.
When both the price breakout and volume breakout conditions are met, Filter 1 generates a signal indicating a potential breakout in the market. This filter helps traders identify significant price movements accompanied by higher trading volumes.
Filter 2: Upper Band Breakout
Filter 2 specifically looks for breakouts above the upper band of the Donchian Channel. This condition suggests a potential strong upward momentum in the market. When the high price exceeds the upper band, Filter 2 generates a signal, indicating a breakout above the recent price range.
Filter 3: Combined Filter 1 and Filter 2
Filter 3 combines the conditions of both Filter 1 and Filter 2. It requires that both Filter 1 and Filter 2 generate signals simultaneously. When this happens, it indicates a strong breakout signal with price and volume confirming the upward momentum.
EMA Lines:
The Breakout Filter with EMA Lines also includes the visualization of Exponential Moving Average (EMA) lines on the chart. EMA is a popular technical indicator used to identify the overall trend in the market. The indicator plots three EMA lines with different periods: EMA1, EMA2, and EMA3. Traders can choose the periods for each EMA line based on their preference and trading strategy.
The EMA lines can provide additional insights into the market trend and potential support or resistance levels. By observing the interaction between the price and the EMA lines, traders can gain a better understanding of the prevailing market sentiment and make informed trading decisions.
How to screen these filters using Trading View Screener
Insert column "DONCHIAN20 UP" and set to "EQUAL HIGH"
Conclusion:
The Breakout Filter with EMA Lines is a comprehensive indicator that combines breakout conditions based on price and volume with the visualization of EMA lines. It helps traders identify potential breakout trading opportunities while providing insights into the market trend. By using this indicator, traders can enhance their trading strategies and potentially improve their trading outcomes.
Please note that this write-up is for informational purposes only and should not be considered as financial advice. Traders should conduct their own analysis and exercise caution when making trading decisions.
Main Market Opener Breakout [RH]Based on my observations while analyzing the crypto and forex charts, particularly BTCUSDT and EURUSD, I have noticed that the prices exhibit significant movements during most stock market sessions, particularly during New York main market session.
With the aim of capturing these moves, I embarked on extensive research. Through this research, I discovered that by considering the very first "15m" or "30m" candle of the main market trading session and marking that first candle's high and low points, we can create potential trigger points.
A break above the high point indicates a bullish signal, while a break below the low point suggests a bearish signal. To further refine our analysis and filter out some noise, we can incorporate the Average True Range (ATR) value of that candle.
Candle time is very important here. We will mark the candle when the actual trading begins in New York stock exchange. The trading hours for the New York Stock Exchange (NYSE) typically begin at 9:30 AM and end at 4:00 PM Eastern Time (ET), Monday through Friday. This is known as the "NYSE Regular Trading Session." However, it's important to note that there are also pre-market and after-hours trading sessions that occur outside of these core hours. We will not consider these pre and after-hours.
Example:
First break-above and break-below is marked automatically and alerts are also available for first breaks.
Example:
I have also added the option to add the, London Stock Exchange Main Market and Tokyo Stock Exchange Regular Trading Session. You can add those sessions also and test with different symbols.
Stocks symbols from different stock exchanges just mark the very first candle of the day(main market trading session).
Alerts are available.

Multi-Band Breakout IndicatorThe Multi-Band Breakout Indicator was created to help identify potential breakout opportunities in the market. It combines multiple bands (ATR-Based and Donchian) and moving averages to provide valuable insights into the underlying trend and potential breakouts. By understanding the calculations, interpretation, parameter adjustments, potential applications, and limitations of the indicator, traders can effectively incorporate it into their trading strategy.
Calculation:
The indicator utilizes several calculations to plot the bands and moving averages. The length parameter determines the period used for the Average True Range (ATR), which measures volatility. A higher length captures a longer-term view of price movement, while a lower length focuses on shorter-term volatility. The multiplier parameter adjusts the distance of the upper and lower bands from the ATR. A higher multiplier expands the bands, accommodating greater price volatility, while a lower multiplier tightens the bands, reflecting lower volatility. The MA Length parameter determines the period for the moving averages used to calculate the trend and trend moving average. A higher MA Length creates a smoother trend line, filtering out shorter-term fluctuations, while a lower MA Length provides a more sensitive trend line.
The Donchian calculations in the Multi-Band Breakout Indicator play a significant role in identifying potential breakout opportunities and providing additional confirmation for trading signals. In this indicator, the Donchian calculations are applied to the trend line, which represents the average of the upper and lower bands. To calculate the Donchian levels, the indicator uses the Donchian Length parameter, which determines the period over which the highest high and lowest low are calculated. A longer Donchian Length captures a broader price range, while a shorter length focuses on more recent price action. By incorporating the Donchian calculations into the Multi-Band Breakout Indicator, traders gain an additional layer of confirmation for breakout signals.
Interpretation:
The Multi-Band Breakout Indicator offers valuable interpretation for traders. The upper and lower bands represent dynamic levels of resistance and support, respectively. These bands reflect the potential price range within which the asset is expected to trade. The trend line is the average of these bands and provides a central reference point for the overall trend. When the price moves above the upper band, it suggests a potential overbought condition and a higher probability of a pullback. Conversely, when the price falls below the lower band, it indicates a potential oversold condition and an increased likelihood of a bounce. The trend moving average further smooths the trend line, making it easier to identify the prevailing direction.
The crossover of the trend line (representing the average of the upper and lower bands) and the trend moving average holds a significant benefit for traders. This crossover serves as a powerful signal for potential trend changes and breakout opportunities in the market. When the trend line crosses above the trend moving average, it suggests a shift in momentum towards the upside, indicating a potential bullish trend. This provides traders with an early indication of a possible upward movement in prices. Conversely, when the trend line crosses below the trend moving average, it indicates a shift in momentum towards the downside, signaling a potential bearish trend. This crossover acts as an early warning for potential downward price movement. By identifying these crossovers, traders can capture the initial stages of a new trend, enabling them to enter trades at favorable entry points and potentially maximize their profit potential.
Breakout Signals:
For bullish breakouts, the indicator looks for a bullish crossover between the trend line and the trend moving average. This crossover suggests a shift in momentum towards the upside. Additionally, it checks if the current price has broken above the upper band and the previous Donchian high. This confirms that the price is surpassing a previous resistance level, indicating further upward movement.
For bearish breakouts, the indicator looks for a bearish crossunder between the trend line and the trend moving average. This crossunder indicates a shift in momentum towards the downside. It also checks if the current price has broken below the lower band and the previous Donchian low. This confirms that the price is breaking through a previous support level, signaling potential downward movement.
When a bullish or bearish breakout is detected, it suggests a potential trading opportunity. Traders may consider initiating positions in the direction of the breakout, anticipating further price movement in that direction. However, it's important to remember that breakouts alone do not guarantee a successful trade. Other factors, such as market conditions, volume, and confirmation from additional indicators, should be taken into account. Risk management techniques should also be implemented to manage potential losses.
Coloration:
The coloration in the Multi-Band Breakout Indicator is used to visually represent different aspects of the indicator and provide valuable insights to traders. Let's break down the coloration components:
-- Trend/Basis Color : The tColor variable determines the color of the bars based on the relationship between the trend line (trend) and the closing price (close), as well as the relationship between the trend line and the trend moving average (trendMA). If the trend line is above the closing price and the trend moving average is also above the closing price, the bars are colored fuchsia, indicating a potential bullish trend. If the trend line is below the closing price and the trend moving average is also below the closing price, the bars are colored lime, indicating a potential bearish trend. If neither of these conditions is met, the bars are colored yellow, representing a neutral or indecisive market condition.
-- Moving Average Color : The maColor variable determines the color of the filled area between the trend line and the trend moving average. If the trend line is above the trend moving average, the area is filled with a lime color with 70% opacity, indicating a potential bullish trend. Conversely, if the trend line is below the trend moving average, the area is filled with a fuchsia color with 70% opacity, indicating a potential bearish trend. This coloration helps traders visually identify the relationship between the trend line and the trend moving average.
-- highColor and lowColor : The highColor and lowColor variables determine the colors of the high Donchian band (hhigh) and the low Donchian band (llow), respectively. These bands represent dynamic levels of resistance and support. If the highest point in the previous Donchian period (hhigh) is above the upper band, the highColor is set to olive with 90% opacity, indicating a potential resistance level. On the other hand, if the lowest point in the previous Donchian period (llow) is below the lower band, the lowColor is set to red with 90% opacity, suggesting a potential support level. These colorations help traders quickly identify important price levels and assess their significance in relation to the bands.
By incorporating coloration, the Multi-Band Breakout Indicator provides visual cues to traders, making it easier to interpret the relationships between various components and assisting in identifying potential trend changes and breakout opportunities. Traders can use these color cues to quickly assess the prevailing market conditions and make informed trading decisions.
Adjusting Parameters:
The Multi-Band Breakout Indicator offers flexibility through parameter adjustments. Traders can customize the indicator based on their preferences and trading style. The length parameter controls the sensitivity to price changes, with higher values capturing longer-term trends, while lower values focus on shorter-term price movements. By adjusting the parameters, such as the ATR length, multiplier, Donchian length, and MA length, traders can customize the indicator to suit different timeframes and trading strategies. For shorter timeframes, smaller values for these parameters may be more suitable, while longer timeframes may require larger values.
Potential Applications:
The Multi-Band Breakout Indicator can be applied in various trading strategies. It helps identify potential breakout opportunities, allowing traders to enter trades in the direction of the breakout. Traders can use the indicator to initiate trades when the price moves above the upper band or below the lower band, confirming a potential breakout and providing a signal to enter a trade. Additionally, the indicator can be combined with other technical analysis tools, such as support and resistance levels, candlestick patterns, or trend indicators, to increase the probability of successful trades. By incorporating the Multi-Band Breakout Indicator into their trading approach, traders can gain a better understanding of market trends and capture potential profit opportunities.
Limitations:
While the Multi-Band Breakout Indicator is a useful tool, it has some limitations that traders should consider. The indicator performs best in trending markets where price movements are relatively strong and sustained. During ranging or choppy market conditions, the indicator may generate false signals, leading to potential losses. It is crucial to use the indicator in conjunction with other analysis techniques and risk management strategies to enhance its effectiveness. Additionally, traders should consider external factors such as market news, economic events, and overall market sentiment when interpreting the signals generated by the indicator.
By combining multiple bands and moving averages, this indicator offers valuable insights into the underlying trend and helps traders make informed trading decisions. With customization options and careful interpretation, this indicator can be a valuable addition to any trader's toolkit, assisting in identifying potential breakouts, capturing profitable trades, and enhancing overall trading performance.

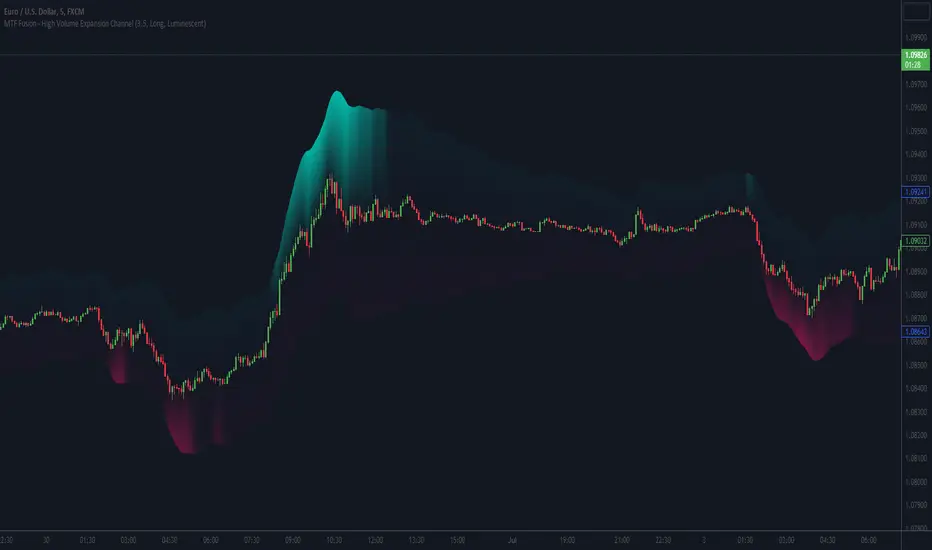
MTF Fusion - High Volume Expansion Channel [TradingIndicators]Exceptionally high volume and rapid price expansion are key markers of powerful moves, especially when they occur during a breakout or breakdown. The High Volume Expansion Channel (HVEC) uses our multi-timeframe fusion and price compression/expansion algorithms to look for high volume and rapid expansion from multiple higher timeframes at once. It uses this info to determine a high volume and expansion 'grade', and then encodes this result into a colored channel. This channel coloring varies in intensity based on how exceptionally high volume is and how rapidly price is expanding in either direction.
What is MTF Fusion?
Multi-Timeframe (MTF) Fusion is the process of combining calculations from multiple timeframes higher than the chart's into one 'fused' value or indicator. It is based on the idea that integrating data from higher timeframes can help us to better identify short-term trading opportunities within the context of long-term market trends.
How does it work?
Let's use the context of this indicator, which calculates a 'high volume and expansion grade' (let's call it HVEG), as an example to explain how MTF Fusion works and how you can perform it yourself.
Step 1: Selecting Higher Timeframes
The first step is to determine the appropriate higher timeframes to use for the fusion calculation. These timeframes should typically be chosen based on their ability to provide meaningful data and action which actively affect the price action of the smaller timeframe you're focused on. For example, if you are trading the 5 minute chart, you might select the 15 minute, 30 minute, and hourly timeframe as the higher timeframes you want to fuse in order to give you a more holistic view of the trends and action affecting you on the 5 minute. In this indicator, four higher timeframes are automatically selected depending on the timeframe of the chart it is applied to.
Step 2: Gathering Data and Calculations
Once the higher timeframes are identified, the next step is to calculate the data from these higher timeframes that will be used to calculate your fused values. In this indicator, for example, the HVEG value is calculated by determining the HVEG for all four higher timeframes.
Step 3: Fusing the Values From Higher Timeframes
The next step is to actually combine the values from these higher timeframes to obtain your 'fused' indicator values. The simplest approach to this is to simply average them. If you have calculated the HVEG value from three higher timeframes, you can, for example, calculate your 'multi-timeframe fused HVEG' as (HigherTF_HVEG_1 + HigherTF_HVEG_2 + HigherTF_HVEG_3) / 3.0.
Step 4: Visualization and Interpretation
Once the calculations are complete, the resulting fused indicator values are plotted on the chart. These values reflect the fusion of data from the multiple higher timeframes, giving a broader perspective on the market's behavior and potentially valuable insights without the need to manually consider values from each higher timeframe yourself.
What makes this script unique? Why is it closed source?
While the process described above is fairly unique and sounds simple, the truly important key lies in determining which higher timeframes to fuse together, and how to weight their values when calculating the fused end result in such a way that best leverages their relationship for useful TA.
This MTF Fusion indicator employs a smart, adaptive algorithm which automatically selects appropriate higher timeframes to use in fusion calculations depending on the timeframe of the chart it is applied to. It also uses a dynamic algorithm to adjust and weight the high volume and price expansion grade calculations depending on each higher timeframe's relationship to the chart timeframe. These algorithms are based on extensive testing and are the reason behind this script's closed source status.
Included Features
MTF Fusion high volume and expansion coloring
MTF Fusion ATR-based channel for visual effect
Channel width customization and explanatory labels
Pre-built color stylings
Options
Show Channel Lines: Show/hide the upper and lower lines of the channel
Fill Channel: Fill the channel with coloring depicting the current degree of high volume and rapid price expansion
Channel Width Multiplier: Sets the width of the ATR-based channel
Explanatory Labels: Show/hide explanatory labels describing the visuals
Lookback: Select how you want the degree of high volume expansion to be calculated (longer = long-term high volume and expansion, shorter = short-term high volume and expansion)
Pre-Built Color Styles: Use a pre-built color styling (uncheck to use your own colors)
Manual Color Styles: When pre-built color styles are disabled, use these color inputs to define your own
Flag FinderFlag Finder Indicator is a technical analysis tool to identify bull and bear flags.
What are flags
Flags are continuation patterns that occur within the general trend of the security. A bull flag represents a temporary pause or consolidation before price resumes it's upward movement, while a bear flag occurs before price continues its downward movement.
Both flag patterns consist of two components:
The Pole
The Flag
The pole is the initial strong upward surge or decline that precedes the flag. The pole is usually a fast move accompanied by heavy volume signaling significant buying or selling pressure.
The flag is then formed as price consolidates after the initial surge or decline from the pole. For a bull flag price will drift slightly downward to sideways, a bear flag will drift upward to sideways. The best flags often see volume dry up during this phase of the pattern.
Indicator Settings
Both components are fully customizable in the indicator so the user can adjust for any time frame or volatility. Select the minimum and maximum accepted limits from the % gain loss required for the pole, the maximum acceptable flag depth or rally and the minimum and maximum number of bars for each component.
Colors and what components are visible at any time are also user controlled.
Trading flags
Traders typically use flags to enter on breakouts. A breakout occurs when price moves above the left side high of a bull flag or below the left side low of a bear flag.
Alerts
The Flag Finder allows for four different types of alerts
New Bull Flag
New Bear Flag
Bull Flag Breakout
Bear Flag Breakout
Pine Script
On top of the indicator identifying bull and bear flags, throughout the source code I left notes on nearly every line to help anyone who is interested in pine script see my thought process and explain which each line of code does. This code isn't too complex, but it offers a look into many different concepts one might use when writing pinescript such as:
input groups
declaring and reassigning variables
for loops
plotshapes & lines
alerts

Banded Chikou Breakout — Quantifying Ichimoku MomentumTitle: Banded Chikou Breakout — Quantifying Ichimoku Momentum
Overview:
Banded Chikou Breakout (BCB) is a unique, algorithmic script designed to augment the capabilities of traders seeking substantial breakout opportunities. Constructed on the robust principles of the Ichimoku trading strategy, BCB is designed to quantify and filter the Chikou Span's significant breakouts above or below the price action. This script does not aim to replace the Ichimoku system; instead, it enhances it, providing an optimized tool for momentum trading.
Rationale:
Ichimoku traders often scrutinize the Chikou Span's position relative to price action to identify market trends. However, determining whether the Chikou Span is above or below due to a genuine trend or mere market noise can be challenging in choppy markets. BCB resolves this predicament by offering a unique way to interpret the Chikou Span's movement. It does so by quantifying the Chikou Span's momentum and utilizing Bollinger Bands to determine its significance. By effectively differentiating substantial movements from the insignificant, BCB can help traders better navigate the market and increase their potential for profitable trades.
How it Works:
BCB combines three key elements: a Momentum Script (simulating Chikou Span), a Bollinger Band Script, and a Timeframe Switcher, all working together to provide a refined trading perspective.
Momentum Script: Calculates the price difference between the current price and the price 'n' periods ago, transforming the Chikou Span into a quantifiable momentum value that signifies the strength and speed of a market move.
Bollinger Band Script: Computes a Simple Moving Average (SMA) around the momentum, plotting two 'bands' at a specified standard deviation from this SMA. This functionality allows traders to discern when the Chikou Span's momentum is abnormally high or low, signifying a potential significant breakout.
Timeframe Switcher: This feature lets traders apply the BCB script to a different timeframe from the one they are currently viewing. This capability can help traders identify higher timeframe breakouts and trade them with precision on the lower timeframe.
How to Use:
BCB is designed to complement the Ichimoku strategy for effective breakout identification.
Add the BCB script to your trading chart. It plots the momentum (yellow line) and Bollinger Bands (green lines) with the area between the bands shaded blue.
Utilize the Ichimoku strategy to identify larger and smaller timeframe trends.
Optional: Leverage the timeframe switcher to synchronize your trades with higher timeframe trends while operating on lower timeframes.
If the BCB momentum line crosses the upper Bollinger Band while the Ichimoku indicates a bullish trend, it signifies a potential significant upward breakout. Similarly, a cross below the lower band during a bearish trend could denote a significant downward breakout.
Remember, without the context provided by the Ichimoku system's trend analysis, BCB can yield false breakouts. It is, therefore, crucial to use these tools in tandem. I like to check for an Ichimoku trend on the 4H and 1H charts, and then use BCB on charts <60 minutes to capture trends with precision.

Volatility Compression BreakoutThe Volatility Compression Breakout indicator is designed to identify periods of low volatility followed by potential breakout opportunities in the market. It aims to capture moments when the price consolidates within a narrow range, indicating a decrease in volatility, and anticipates a subsequent expansion in price movement. This indicator can be applied to any financial instrument and timeframe.
When the close price is above both the Keltner Middle line and the Exponential Moving Average (EMA), the bars are colored lime green, indicating a potential bullish market sentiment. When the close price is positioned above the Keltner Middle but below the EMA, or below the Keltner Middle but above the EMA, the bars are colored yellow, signifying a neutral or indecisive market condition. Conversely, when the close price falls below both the Keltner Middle and the EMA, the bars are colored fuchsia, suggesting a potential bearish market sentiment.
Additionally, the coloration of the Keltner Middle line and the EMA provides further visual cues for assessing the trend. When the close price is above the Keltner Middle, the line is colored lime green, indicating a bullish trend. Conversely, when the close price is below the Keltner Middle, the line is colored fuchsia, highlighting a bearish trend. Similarly, the EMA line is colored lime green when the close price is above it, representing a bullish trend, and fuchsia when the close price is below it, indicating a bearish trend.
Parameters
-- Compression Period : This parameter determines the lookback period used to calculate the volatility compression. A larger value will consider a longer historical period for volatility analysis, potentially capturing broader market conditions. Conversely, a smaller value focuses on more recent price action, providing a more responsive signal to current market conditions.
-- Compression Multiplier : The compression multiplier is a factor applied to the Average True Range (ATR) to determine the width of the Keltner Channels. Increasing the multiplier expands the width of the channels, allowing for a larger price range before a breakout is triggered. Decreasing the multiplier tightens the channels and requires a narrower price range for a breakout signal.
-- EMA Period : This parameter sets the period for the Exponential Moving Average (EMA), which acts as a trend filter. The EMA helps identify the overall market trend and provides additional confirmation for potential breakouts. Adjusting the period allows you to capture shorter or longer-term trends, depending on your trading preferences.
How Changing Parameters Can Be Beneficial
Modifying the parameters allows you to adapt the indicator to different market conditions and trading styles. Increasing the compression period can help identify broader volatility patterns and major market shifts. On the other hand, decreasing the compression period provides more precise and timely signals for short-term traders.
Adjusting the compression multiplier affects the width of the Keltner Channels. Higher multipliers increase the breakout threshold, filtering out smaller price movements and providing more reliable signals during significant market shifts. Lower multipliers make the indicator more sensitive to smaller price ranges, generating more frequent but potentially less reliable signals.
The EMA period in the trend filter helps you align your trades with the prevailing market direction. Increasing the EMA period smoothes out the trend, filtering out shorter-term fluctuations and focusing on more sustained moves. Decreasing the EMA period allows for quicker responses to changes in trend, capturing shorter-term price swings.
Potential Downsides
While the Volatility Compression Breakout indicator can provide valuable insights into potential breakouts, it's important to note that no indicator guarantees accuracy or eliminates risk. False breakouts and whipsaw movements can occur, especially in volatile or choppy market conditions. It is recommended to combine this indicator with other technical analysis tools and consider fundamental factors to validate potential trade opportunities.
Making It Work for You
To maximize the effectiveness of the Volatility Compression Breakout indicator, consider the following:
-- Combine it with other indicators : Use complementary indicators such as trend lines, oscillators, or support and resistance levels to confirm signals and increase the probability of successful trades.
-- Practice risk management : Set appropriate stop-loss levels to protect your capital in case of false breakouts or adverse price movements. Consider implementing trailing stops or adjusting stop-loss levels as the trade progresses.
-- Validate with price action : Analyze the price action within the compression phase and look for signs of building momentum or weakening trends. Support your decisions by observing candlestick patterns and volume behavior during the breakout.
-- Backtest and optimize : Test the indicator's performance across different timeframes and market conditions. Optimize the parameters based on historical data to find the most suitable settings for your trading strategy.
Remember, no single indicator can guarantee consistent profitability, and it's essential to use the Volatility Compression Breakout indicator as part of a comprehensive trading plan. Regularly review and adapt your strategy based on market conditions and your trading experience. Monitor the indicator's performance and make necessary adjustments to parameter values if the market dynamics change.
By adjusting the parameters and incorporating additional analysis techniques, you can customize the indicator to suit your trading style and preferences. However, it is crucial to exercise caution, conduct thorough analysis, and practice proper risk management to increase the likelihood of successful trades. Remember that no indicator can guarantee profits, and continuous learning and adaptation are key to long-term trading success.

Base Finder DailyThe Base Finder Daily is the companion tool to the original Base Finder which is used to identify consolidation periods in a stock's advance. The Base Finder Daily allows traders to zoom in from the weekly chart and get a more precise view of the daily price action during a basing period.
Base Finder Daily identifies three different types of bases (Flat Base, High Tight Flag, Consolidation) and provides key information about the consolidation such as the depth, length, and pivot point. This information allows traders to compare and analyze the best basing patterns quickly and easily.
This tool helps traders of all levels train their eye to identify potential trading opportunities that might have otherwise gone unnoticed.
Base Finder is a must-have tool for any trader, especially those that have studied the work of William O’Neil. Base Finder stacks up base for base with MarketSmith.
Easily customize the settings, from the look to the intricacies of a consolidation.
Default base settings:
Flat Base
length: 25 days minimum
depth: <= 15%
High Tight Flag
Flag Pole: up 80% or more in less than 40 days
Flag: Less than 25% correction in 10-20 days
Consolidation:
length: minimum 30 days
depth: <= 35%
Notes
This indicator is meant to be used on the daily timeframe.
In order to see the stats labels hover your mouse over the left side high of the consolidation and please make sure the indicator is brought to the front using the visual order of your chart. If the visual order is not correct you will not be able to see the stats label.
Disclaimer:
This indicator is for informational and educational purposes only. Do your own research before making any trade decisions. We accept no liability for any loss or damage, including without limitation any loss of profit, which may arise directly or indirectly from use of or reliance on this indicator.

BANKNIFTY position screenerThe script takes present day's price range of the stocks (stocks of the Index being tracked included in this screener) into account, to hint strength or weakness in the underlying Index (for example: BANKNIFTY here). The day's price range of a stock is gauged on a scale of 0-100, where 0 is Day's price low and 100 is day's price high.
If a stock is in 90-100 price range section the cell with title "90" illuminates hinting the stock is trading near day's high.
Likewise, if a stock is in 0-10 price range section the cell with title "10" illuminates hinting that the stock is trading near day's low.
The price range of 10-25 is represented in the cell titled "25"
The price range of 75-90 is represented in the cell titled "75"
Only one cell from the day's range illuminates at a time for a stock, signaling the present position of that stock in the Day's range at that instant.
The script works best above 10 second time frame.
Idea: If majority of the heavy weight stocks of the Index being tracked are trading near Day's high the underlying Index must be going strong at that very instant and Vice versa.
Disclaimer: Only for studying Index movement ideas intraday, trading is not advised.

Psychological levels (Bank levels) PsychoLevels v3 - TartigradiaPsychological levels (Bank levels) plots the closest "round" price levels above and below current price, based on neuroscience research of how humans intuitively calculate in logarithms.
Psychological levels, also called bank levels, are "round" price numbers, by truncating after the nth leftmost digits, around which price often experience resistance or support, because traders and investors tend to set orders around these round numbers.
The calculation done here is fully automatic and dynamic, contrary to other similar scripts, this one uses a mathematical calculation that extracts the 1, 2 or 3 leftmost digits and calculate the previous and next level by incrementing/decrementing these digits. This means it works for any symbol under any price range.
This approach is based on neuroscience research, which found that human brains intuitively approximate numbers on a logarithmic scale, adults and children alike, and similarly to macaques, for more info see Numerical Cognition , Weber-Fechner Law , Zipf law .
For example, if price is at 0.0421, the next major price level is 0.05 and medium one is 0.043. For another asset currently priced at 19354, the next and previous major price levels are 20000 and 10000 respectively, and the next/previous medium levels are 20000 and 19000, and the next/previous weak levels are 19400 and 19300.
IMPORTANT: Please enable "Scale price chart only" in the chart's scale's options, as otherwise major levels may make the chart's scale very small and hard to read.
How it works
At any time, there are 3 levels of strength (1 leftmost digit, 2 leftmost digits, 3 leftmost digits) represented by different sizes, and 3 directional levels for each of these strengths (level above, level below, and half-level) represented by different colors and positions, around current price.
Indeed, contrary to other similar price levels scripts, we do not plot ALL price levels at all times, because otherwise the chart becomes wayyy too cluttered, and also it's highly processing intensive to plot so many lines. So we here use a dynamical approach: we plot only the relevant levels, the closest ones according to current price.
Hence, when a level disappears, it does not mean that it does not exist anymore, but simply that we are not drawing it right now because it is not pertinent for the current price movement (ie, too far away).
Breakouts can be detected in two different ways depending on if SMA is set to a value higher than 1 or not: if SMA == 1, then there is no smoothing, so the levels adapt instantaneously to the current price, so to detect breakout, you should refer to the levels at the previous tick and whether they were broken by current tick's price; if SMA > 1, then there is some smoothing, and so the levels will stay in-place even if there is a breakout, so it's easier to spot breakouts without having to look at the previous ticks, but on the other hand you won't see the new levels for the new price range until after a few more ticks for the smoothing window to adapt. Hence, by default, smoothing is disabled, so that you can see the currently pertinent levels at all time, even right after or during a breakout.
By default, the strong above level is in green, strong below level is in red, medium above level is in blue, medium below level is in yellow, and weak levels aren't displayed but can be. Half levels are also displayed, in a darker color. Strong levels are increments of the first leftmost digit (eg, 10000 to 20000), medium levels are increments of the second leftmost digit (eg, 19000 to 20000), and weak levels of the third leftmost digit (eg, 19100 to 19200). Instead of plotting all the psychological levels all at once as a grid, which makes the chart unintelligible, here the levels adapt dynamically around the current price, so that they show the above/below/half levels relatively to the current price.
Indeed, "half-levels" are also displayed (eg, medium level can also display 19500 instead of only 19000 or 20000). This was made because otherwise the gap between two levels was too big, especially for the strongest levels (eg, there was no major level between 20000 and 30000, but with a half-step we also get a half-level at 25000, and empirically price tends to respect these half levels - I also tried quarter levels but empirically the results were not good). In addition to this hard-coded half-level, you can also create more subdivisions (eg, quarter levels) by setting the simple moving average to a value higher than 1.
The script can be made to run on the daily timeframe whatever the current chart's timeframe is, to reduce the variability in levels, to make it less noisy than intraday price movement. But by default, the chart resolution is used, because I empirically found that the levels found with this indicator work on all time resolutions quite well.
The step can be adjusted to increase the gap between levels, eg, if you want to display one every 2 levels then input step = 2 (eg, 22000, 24000, 26000, etc), or if you want to display quarter levels, input 0.25 (eg, 22000, 22250, 22500, etc). The default values should fit most use cases and cover most psychological levels.
How to read
Focust first on bigger dotted levels, they are stronger and more likely to cause a rebound or a major event or price to stay at this level.
Remember that it's not enough to just look at levels, the context is important, because levels have various effects depending on current price movement: if price is above a level, the level is a support on which price can rebound; if price is below a level, the level is a resistance on which price can rebound (or break); and finally sometimes price also stays hovering around a level for some time.
Levels closer to 9 are less weaker, and levels closer to 0 are stronger, according to Zipf law. This is now reflected since v3 in the transparency, levels that are closer to 9 will be more transparent.
The switch in color for the same level illustrates how a level switches from being a support to a resistance and inversely. Eg, if a major level turns from green to red, then it changed from being a resistance (above) to a support (below).
As is well known in trading, longer standing levels are stronger. This indicator provides a direct illustration: in practice, the number of consecutive dots on the same line influences the strength of the level: the longer the chain of dots, the more you can expect this price level to be significant. The length does not mean the level will necessarily hold, but that other traders are likely to monitor if it holds, and if not then price will break down. Hence, longer levels are good spots to place stop losses, or to enter trades depending on your strategy. In general, a single dot is not enough to consider a level significant, but 2 or more is a good enough level, and 10+ is a strong level. Intuitively, this makes sense, and is what pro traders do: the longer a level is tested, the stronger it is. This indicator can visually represent this intuition and allows to use it as a more systematic trading signal.
Motivation
I initially made the first version of the PsychoLevels indicator mainly to train with PineScript, but I found it surprisingly accurate to define levels that are respected by price movements. So I guess it can be useful for new traders and experienced traders alike, as it's easy to forget that psychological levels can often be as strong if not stronger than technical levels. It can also be used to quickly screen other minor assets for trading opportunities. For example, a hybrid strategy would be to manually define levels on BTCUSD but using this script to automatically define levels in crypto altcoins and quickly screen them for a trade opportunity that can be greater than with BTCUSD but with the same trend.
Personally, although initially I did not believe an automated tool would work well for this purpose, I could now empirically verify that it is quite reliable for the purpose of detecting levels, and so I use it all the time to find the levels automatically and help me monitor them like a hawk, so that I only have to draw uber major levels, the ones that last between cycles and that are hard to autodetect, but otherwise all daily/weekly levels are usually covered. However, trendlines must still be drawn manually or with another indicator (but note that up to now I have found none that worked well enough), as PsychoLevels only draws levels (ie, horizontal lines, not oblique ones!).
Differences with the previous version PsychoLevels v2
price levels now have a transparency according to their importance for the human brain: numbers closer to 9 are weaker, and numbers closer to 0 are stronger and represent a major psychological threshold (eg, that's why prices marked as $9.99 sell better than $10.00). This option can be disabled to get the exact same behavior as v2.
modularized and typed code
PsychoLevels v2 can be found here:

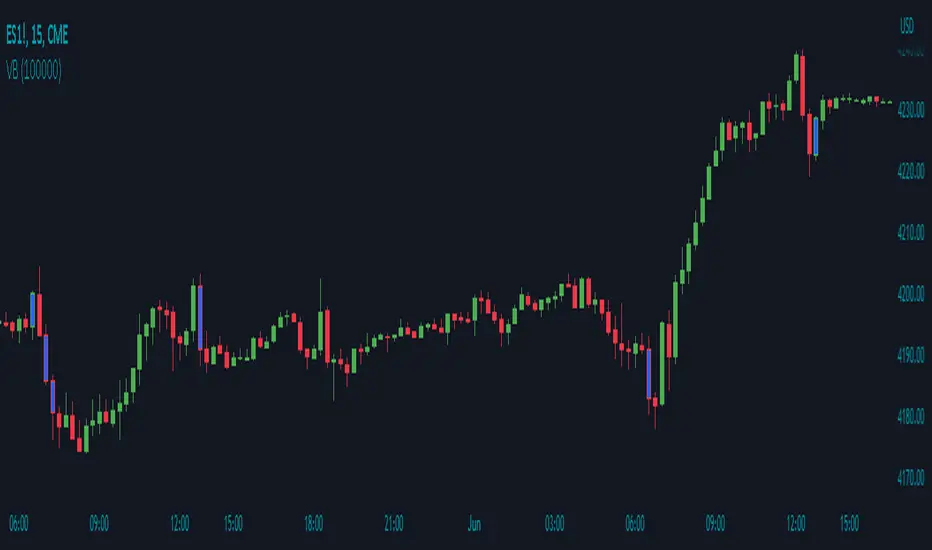
Volume Breakout by Chosen VolumeDescription:
The Volume Breakout indicator (VB) is a technical analysis tool that highlights candles with significant trading volume. It helps traders identify potential breakout periods characterized by high volume activity.
How it Works:
The Volume Breakout indicator compares the volume of each candle with a user-defined minimum volume threshold. If the volume of a candle exceeds or is equal to the specified minimum volume requirement, the indicator identifies it as a volume breakout and marks it accordingly.
Usage:
To effectively utilize the Volume Breakout indicator, follow these steps:
1. Apply the VB indicator to your chart by adding it from the available indicators.
2. Customize the minimum required volume parameter according to your trading preferences. This parameter determines the threshold volume level that a candle must meet or exceed to be considered a breakout candidate.
3. Observe the candles on the chart:
- Candles that meet or exceed the minimum required volume are highlighted with a specific color (yellow by default), indicating potential breakout periods.
4. Pay attention to the volume breakout indications within the candles, as they suggest periods of increased trading activity.
5. Analyze the price action accompanying the volume breakout candles. Breakouts often indicate a surge in buying or selling pressure, potentially leading to significant price moves or trend reversals.
6. Combine the analysis of volume breakout candles with other technical analysis tools, such as trend lines, support and resistance levels, or indicators, to confirm potential trade setups.
7. Implement appropriate risk management strategies, including setting stop-loss orders and position sizing, to manage your trades effectively and protect your capital.
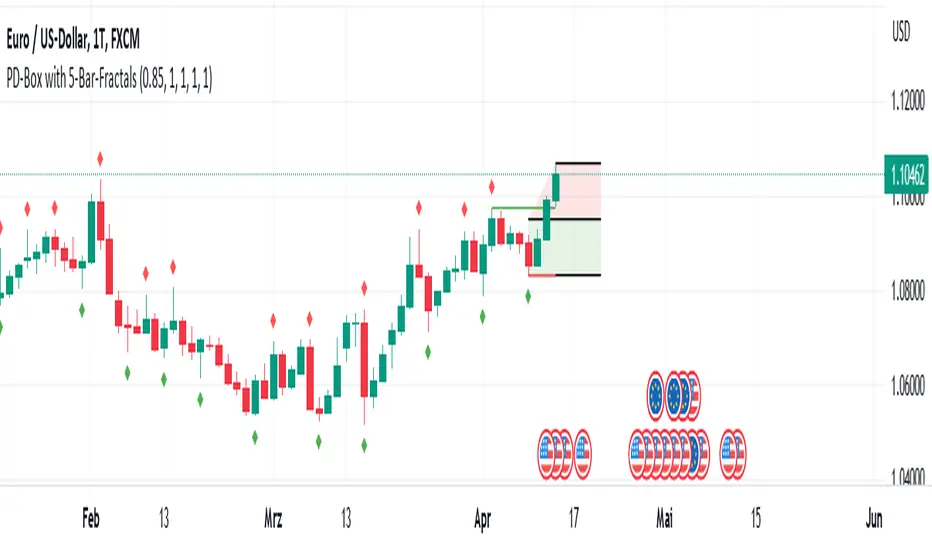
PD-Box with Fractal Points V1 (by Jonny86FXPro)PD-Box with Fractal Points V1 (by Jonny86FXPro)
This indicator has several functions:
Premium/Discount Box: The two most recent fractal highs and lows form a premium/discount box that provides valuable information about potential price movements.
Fractal Breaker Lines: Two fractal breaker lines are integrated for the high and low points to better visually represent the break of a fractal point.
Customizable: The genius of this indicator is that you can customize everything to your own needs. Whether you want to display lines, or change the colors of the box or lines, everything is possible.
Automatic Adjustment: Once a fractal point is broken, the premium discount automatically adjusts to the current price. Once a new fractal point is formed, the box is automatically adjusted again.
HTF Analysis: Use this indicator for your HTF analysis and determine in which direction the price could develop.
Premium Discount Box Information: When the price is in the premium range, there is a higher probability of a sell-off. However, if the price breaks upward, there is a good chance that it will continue to rise. The opposite is true for the discount range.
Power Behind Each Move: It is important how the price hits the fractal point. If there is power behind each move, the chances are very good that it will continue in that direction. If there is no real power behind it, it could be an indication of a trend reversal.
Weak Breaks: In the premium range, a weak upward break could lead to a bearish move, and in the discount range, a weak downward break through the fractal low point could lead to a move in the bullish direction.
As you can see, this powerful indicator has many functions that can help you determine trend direction and potential price movements.
Quick overview of functions:
Designed for higher timeframes such as 4H chart.
Identifies the last two fractal highs and lows to create a premium/discount box.
Includes two fractal breaker lines for the high and low points to better visually represent fractal breaks.
Customizable to fit individual needs, including the ability to show/hide lines and change box/line colors.
Automatically adjusts premium/discount levels to current price when a fractal point is broken.
Can be used for higher timeframe analysis to determine potential price direction.
Premium/discount box provides insight into potential market direction based on price movement within its range.
Fractal break with strong market momentum indicates a higher chance of trend continuation.
Fractal break with weak market momentum may suggest a potential trend reversal.
A powerful indicator that can greatly assist in determining trend direction.
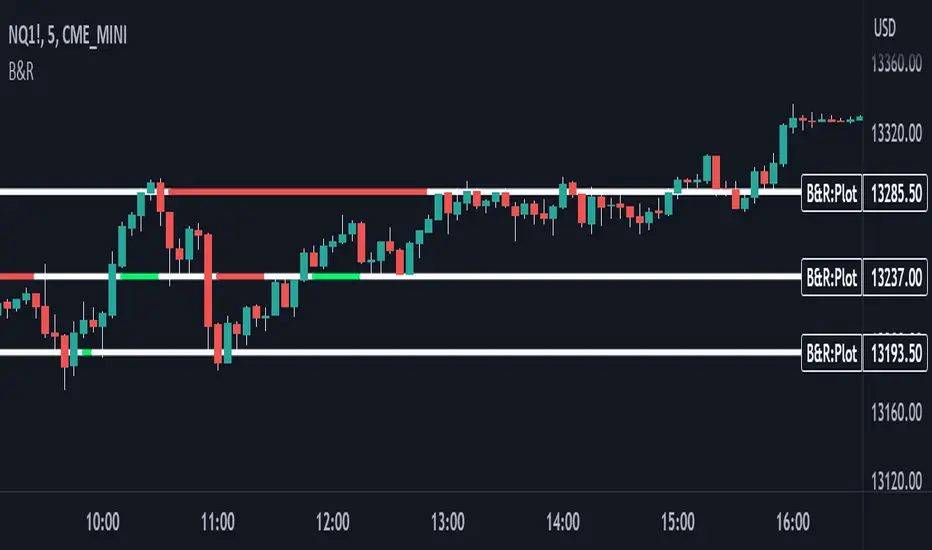
Support & Resistance With Breakout & RetestIntro
The Breakout Retest Indicator is a valuable tool utilized to confirm the occurrence of a proper breakout so you know when to enter on a retest. It analyses the price movement of an asset and identifies a breakout when the price level surpasses the inputted support and resistance values.
Conditions
The indicator operates based on simple yet reliable conditions. Once a candle closes above or below the specified line, the next candle's closure above or below without touching the high or low levels confirms the breakout. The indicator subsequently changes its color, signaling a long or short position. Upon retesting, it reverts to its original color.
Need Your Help
I am sharing this indicator to solicit your input in improving it. As a committed developer, I have ambitious plans for enhancing the indicator's functionality. To that end, I welcome your suggestions and ideas to build indicators that can contribute to the success of people's strategies.
Future Ideas
Some of the potential improvements that I plan to incorporate include the implementation of zones. Users will be able to define zones that require breaking above or below for a confirmed breakout. Additionally, a volume check will provide additional confirmation by evaluating the volume level relative to the breakout. Lastly, close above or below feature will ensure that a certain number of ticks, percentage, or price level has been breached to confirm the breakout.
Days in rangeThis script is a little widget that I made to do some homework on the VIX.
As you can see in the chart I was analyzing the 2008 market crash and the stats that followed it after until the market started to recover.
You can see that theory in my "Ideas" tab.
This is an interactive set of lines that you can use to count the the bars inside and outside of your chosen range, and the percentage outside that range.
You should initially enter the price range of your product in the menu and set some arbitrary dates that you can easily see on your chart.
Drag and drop the lines around to suit what price and the dates you are analyzing.
The table will display the bar count inside and outside of the range, the total bars, and the percentage outside that range.
I personally used this as a tool to study the overall average of the product, compared with the behavior during major market events.
It is currently my opinion that post 2020 analysis needs to take into account the behavior of any given product prior to 2020 when the
VIX was in its comfort zone. Not to say that a price valuation hasn't been set, but that the movement to that price was outside of "Normal Market Conditions,"
and the time factor to return to that value might be skewed. Other factors would need to be considered at that point pertaining to your specific product or corelating indicator.
I could see this tool being useful to Forex and commodities traders. But that isn't my field so that that for what it is. I do think it would perform best on something that is more
pegged to a price range. I personally would use it on product's, like the VIX, that I use as an indicator product. That is what it was designed for.
But I suppose it could be used for Mean price and time related analysis, maybe with a Vwap, SMA or other breakout style indicators.
Volume analysis might be pretty sporty. Possibly time patterns... the possibilities could be endless. Or... limited.
I am publishing this for my trade group so that it can be tinkered with to find other helpful ways to use it.
If anyone finds something interesting with other indicators, please drop a comment below and I could consider creating a script to integrate with this tool.

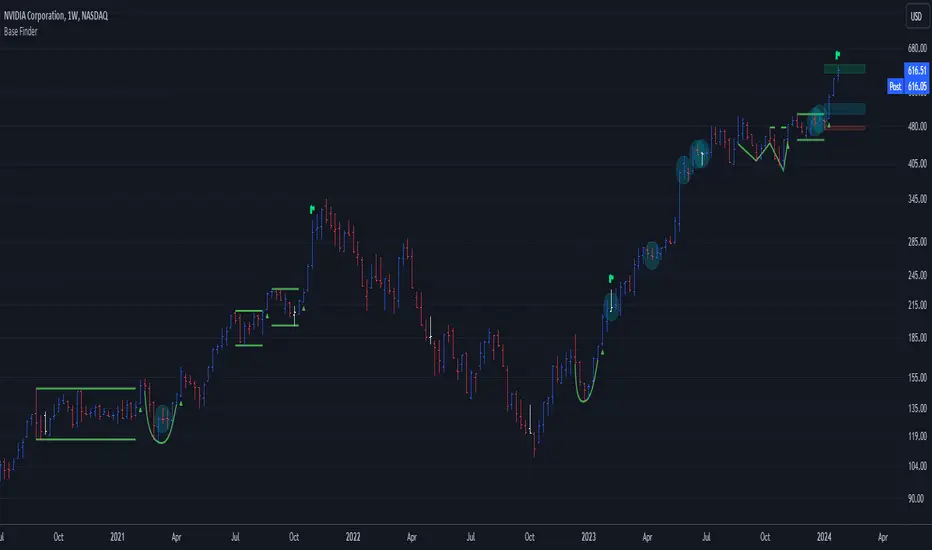
Base FinderThe Base Finder is a powerful tool to identify consolidation periods in a stock's advance. With this indicator, traders can effortlessly spot consolidation patterns on their charts providing them with a deeper understanding of the stock's price action.
Base Finder goes beyond identifying consolidation patterns, as it also offers key information about the consolidation such as the depth, length, pivot point, and the number of accumulation or distribution weeks throughout the pattern. This information allows traders to compare and analyze the best basing patterns quickly and easily.
With Base Finder, traders can differentiate between a Flat Base, a High Tight Flag, or a consolidation, like a cup with handle or double bottom base.
This tool helps traders of all levels train their eye to identify potential trading opportunities that might have otherwise gone unnoticed.
Base Finder is a must-have tool for any trader, especially those that have studied the work of William O’Neil. Base Finder stacks up base for base with MarketSmith.
Easily customize the settings, from the look to the intricacies of a consolidation.
Default base and accumulation/distribution settings:
Flat Base
length: 5 weeks minimum
depth: <= 15%
High Tight Flag
Flag Pole: up 80% or more in less than 8 weeks
Flag: Less than 25% correction in 2-4 weeks
Consolidation:
length: minimum 6 weeks
depth: <= 35%
Accumulation Week:
Current candle closes lower, but in the upper half of the weekly closing range on above average volume. OR Current candle closes positive in the upper 40% of the weekly closing range on above average volume.
Distribution Week:
Current candle closes positive, but in the lower quartile of the weekly closing range on above average volume. OR Current candle closes down on the week in the lower half of the weekly closing range on above average volume.
Notes
This indicator is meant to be used on the weekly timeframe.
In order to see the stats labels hover your mouse over the left side high of the consolidation and please make sure the indicator is brought to the front using the visual order of your chart. If the visual order is not correct you will not be able to see the stats label.
Disclaimer:
This indicator is for informational and educational purposes only. Do your own research before making any trade decisions. We accept no liability for any loss or damage, including without limitation any loss of profit, which may arise directly or indirectly from use of or reliance on this indicator.
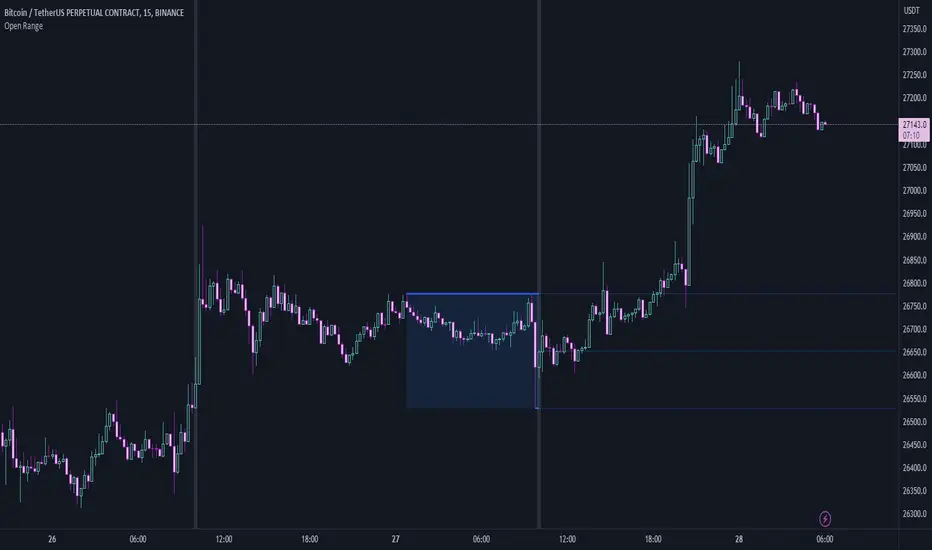
Open RangeThis is a simple script that will look back a set number of candles at a specified time (example: Ny Open) and find the "High and Low " of the range/ market in the given look back period. It will then draw two lines and the range zone as a box. Breakout traders can use these levels to help find interesting areas for a breakout. Reversal traders can use these levels to help locate false breakouts.
Simple type in your time zone Example: GMT-4
Set the time you want the indicator to draw the start line Example: 8:30am
then set the candle look back Example: 60
Hope this script helps spark some ideas
Happy trading