Trend Break Targets [MarkitTick]Trend Break Targets
Trend Break Targets is a technical analysis tool designed to assist traders in identifying trendline breakouts and projecting potential price targets based on market geometry. Unlike fully automated indicators that guess trendlines, this tool provides you with precise control by allowing you to manually Pivot Point the trendline to specific points in time, while automating the complex math of target projection and structure mapping.
Theoretical Basis & Concepts
This indicator is grounded in classic technical analysis principles found in foundational trading literature. It automates the following methodology:
Drawing a trend line between two key points to represent dynamic support or resistance.
Identifying a breakout when the price closes above or below this line, potentially signaling a change in trend.
Calculating a price target by measuring the vertical distance between the breakout line and the last high/low (pivot), then projecting that same distance in the direction of the breakout.
This concept is based on methods and "Measured Move" theories explained in classic books such as "Technical Analysis of Stock Trends" by Edwards & Magee, "Technical Analysis of the Financial Markets" by John Murphy, and in Thomas Bulkowski's Price Pattern Studies.
How It Works
Pivot Pointed Trendline Construction The script draws a trendline between two user-defined points in time (Start Date and End Date). It calculates the slope between these points and extends the line infinitely to the right, allowing you to define the exact structure (e.g., a resistance trendline on a wedge).
Breakout Detection The script monitors the "Price Source" (High, Low, or Close) relative to the extended trendline.
A Bullish Breakout (BC) occurs when the Close crosses above a bearish trendline.
A Bearish Breakout (BC) occurs when the Close crosses below a bullish trendline.
Dynamic Target Projection (The Math) Upon a confirmed breakout, the script automatically calculates three distinct targets by identifying the most significant "Swing Point" (Pivot) prior to the breakout.
Distance (D): The vertical distance between the Trendline and the Pivot Price at the specific bar where the pivot occurred.
Target 1 (T1): The Breakout Price +/- (Distance × 1.0). This represents a classic 1:1 measured move.
Target 2 (T2): The Breakout Price +/- (Distance × 1.618). Based on the Golden Ratio extension.
Target 3 (T3): The Breakout Price +/- (Distance × 2.618).
Market Structure (CHOCH) The script includes an optional Change of Character (CHOCH) module. This runs independently of the trendline logic, identifying local Swing Highs and Swing Lows based on the "Swing Detection Length." It plots dashed lines and labels to visualize immediate shifts in market structure.
How to Use This Tool
This is an interactive tool that requires user input to define the setup.
Identify a Setup: Locate a clear trend, wedge, or flag pattern on your chart.
Set Pivot Points: Go to the Indicator Settings. Input the exact Start Date and End Date corresponding to the two main touches of your trendline.
Monitor for Breakout: The script will extend the line. Wait for a "BC" label to appear.
Trade Management: Once "BC" prints, the T1, T2, and T3 lines will instantly render. These can be used as potential take-profit zones or areas to tighten stop-losses.
Settings & Configuration
Indicator Settings
Start/End Date: The timestamp Pivot Points for your trendline.
Price Source: Determines what price (High or Low) Pivot Points the line and triggers the breakout.
Pivot Left/Right: Adjusts the sensitivity for finding the "Pivot Before Break" used for target calculations.
Extend Target Line: How far forward the target lines are drawn.
Visual Style
Colors: Fully customizable colors for the Trendline, Breakout Labels, and each Target level (T1, T2, T3).
Gold Bullish Reversal
This analysis dissects a confirmed bullish reversal on Gold using a custom Trend Break system. The setup identifies a transition from a bearish corrective phase to bullish momentum, validated by a structural break and a geometric target projection.
Trend Identification (The Pivot Points) The descending white trendline serves as the primary dynamic resistance, defining the bearish correction.
Pivot Points: The line is drawn connecting two significant swing highs, marked by Label 1 and Label 2.
Logic: These points represent the "lower highs" characteristic of the previous downtrend. As long as price remained below this trajectory, the bearish bias was intact.
The Trigger: Breakout & Confirmation The transition occurs at the candle marked BC (Breakout Candle).
Breakout Criteria: The indicator logic dictates that a signal is only valid when the bar closes above the trendline. This filters out intraday wicks and ensures genuine buyer commitment.
CHOCH Confluence: Immediately following the breakout, a CHOCH (Change of Character) label appears. This signals a shift in market structure, indicating that the internal lower-high/lower-low sequence has been violated, adding probability to the reversal.
Target Projection: The Measured Move The vertical green lines (T1, T2) represent profit objectives derived from the depth of the prior move. The logic calculates the distance between the breakout line and the lowest pivot prior to the break.
T1 (Standard Target): This is a 1:1 projection of the pre-breakout volatility. We see price action initially stalling near this level, confirming it as a zone of interest.
T2 (Golden Ratio Extension): The second target is calculated as the initial distance multiplied by 1.618 (Fibonacci Golden Ratio). The chart shows the price rallying aggressively through T1 to tap the T2 zone, often considered an exhaustion or major take-profit level in harmonic extensions.
Conclusion Gold has successfully invalidated the 4-hour bearish trendline. The confluence of a confirmed close above resistance (BC) and a structural shift (CHOCH) provided a high-probability long setup. The price has now fulfilled the T2 (1.618) extension, suggesting traders should watch for consolidation or a reaction at this key Fibonacci resistance level.
Bearish Trendline Breakdown
The image displays a Bearish Trendline Breakdown on the Gold (XAUUSD) 4-hour chart. The indicator is actually functioning in "Low" mode here (connecting swing lows to form support), which triggers the bearish logic found in the code. Here is the step-by-step breakdown:
The Setup: Pivot Points & Trendline
Visual: The Blue Labels "1" and "2" connected by a white diagonal line.
Code Logic: These are the user-defined start and end points.
Pivot Point 1 (startDate): The starting pivot of the trendline.
Pivot Point 2 (endDate): The ending pivot.
Trendline: The code draws a line between these two points and extends it to the right (extend.right). In this specific image, the line acts as a Support Trendline.
The Trigger: Break Candle (BC)
Visual: The Red Label "BC" appearing just below the white trendline.
Code Logic: This is the execution signal. The code detects a "Down Break" (dnBreak) because the Price Source was likely set to "Low" and the candle's Close was lower than the Trendline Price at that specific bar (close < currLinePrice). This confirms the support level has been breached.
The Projection: Targets (T1 & T2)
Visual: The Green Labels "T1" and "T2" with dotted horizontal lines projected downward.
Code Logic: These are profit targets based on a "Measured Move."
Pivot Calculation: The script looks back for a recent "Pivot High" (the peak before the crash) to calculate the volatility/distance (dist) between that peak and the trendline.
T1 (Conservative): The price is projected downward by 1x that distance (currLinePrice - dist).
T2 (Extended): The price is projected downward by 1.618x that distance (Golden Ratio extension).
Market Context: CHOCH
Visual: The small Red/Orange "CHOCH" labels appearing above the price action.
Code Logic: This is a secondary confirmation system running independently of the trendline. It detects a Change of Character (structural shift). The red labels indicate a "Bearish CHOCH," meaning the price broke below a significant prior swing low (last_swing_low). This supports the bearish bias of the trendline break.
Disclaimer This tool is for educational and technical analysis purposes only. Breakouts can fail (fake-outs), and past geometric patterns do not guarantee future price action. Always manage risk and use this tool in conjunction with other forms of analysis.
Breakouts

Visible Range / POC / Volume / SNR Detector PROVisible Range POC & Volume SNR Detector PRO
Visible Range POC & Volume SNR Detector PRO is a professional-grade volume-based market structure tool designed to identify institutional Support & Resistance zones, Point of Control (POC), and Value Areas directly from the visible chart range.
This indicator goes beyond traditional swing highs and lows by analyzing real traded volume, revealing where large players are active, where price finds fair value, and where high-probability reactions are most likely to occur.
🔍 Core Features
📊 Visible Range Volume Profile
🔹Builds a full Volume Profile using only the visible chart range
🔹Splits price into configurable precision bins for maximum accuracy
🔹Detects true volume clusters instead of subjective price levels
🎯 Point of Control (POC)
🔹 Automatically identifies the highest-volume price level
🔹Acts as a magnet price where market participants agree on value
🔹Fully customizable line style, width, and color
🔹 Optional label with timeframe + price + volume (K / M / B)
📦 Value Area (VAH / VAL)
* Calculates Value Area High & Low around the POC
* Default **70% volume range** (institutional standard)
* Optional Value Area fill for clear fair-value visualization
* Helps distinguish **range conditions vs trending moves**
🧱 Volume-Based Support & Resistance Zones
🔹Automatically detects high-impact S&R zones from volume behavior
🔹Zones are visually classified by strength:
🔹 🟢 Strong
🔹 🟡 Medium
🔹 🔴 Weak
🔹Clean box rendering with customizable borders:
🔹 Solid / Dashed / Dotted
🔹 Zones extend dynamically into the future for planning trades
🔄 Dynamic Flip Logic (PRO Standard)
🔹 Advanced Dynamic Flip system:
🔹 Support ➜ Resistance after a breakdown
🔹Resistance ➜ Support after a breakout
🔹 Reflects real market structure shifts
🔹Eliminates outdated static levels
🔁 True Retest & Zone Intelligence
🔹Each zone includes detailed contextual data:
🔹🔄 True Retest Count (price leaves zone and comes back)
🔹⏳ Zone Age (minutes / hours / days)
🔹💪 Strength Classification
🔹🔁 Flip Status
🔹⏱️ Timeframe
🔹💲 Exact price level
🔹All information is displayed in a single clean label.
🔔 Smart Alerts System
🔹Never miss key interactions:
🔹🟢 Touch Alert — price enters a zone
🔹⬇️⬆️ Break Alert — zone failure or breakout
🔹🔄 Retest Alert — classic break & retest setup
Alerts trigger on confirmed bars to reduce noise and false signals.
📋 Professional Dashboard
🔹At-a-glance market overview:
🔹Total Support & Resistance zones
🔹🎯 POC level
🔹📦 VA High / VA Low
🔹💪 Strong / Medium / Weak zone distribution
🔹📍 Nearest Support & Resistance
🔹📏 Distance to key levels
🔹 🎨 Auto / Dark / Light theme support
🔹 📐 Adjustable size & position

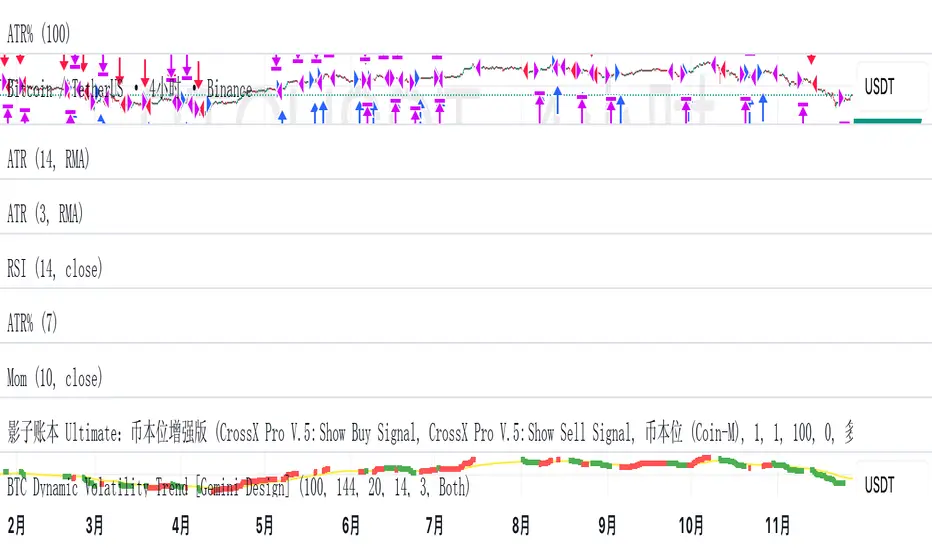
BTC Dynamic Volatility Trend Backtested from 2017 to present, this strategy has delivered a staggering 7100%+ cumulative return. It doesn't just track the market; it dominates it. By capturing major trends and strictly limiting drawdowns, it has significantly outperformed the standard 'Buy & Hold' BTC strategy, proving its ability to generate massive alpha across multiple bull and bear cycles.
自 2017 年至今,本策略实现了惊人的 7100%+ 累计收益率。它不仅仅是跟随市场,更是超越了市场。通过精准捕捉主升浪并严格控制回撤,该策略在穿越多轮牛熊周期后,大幅度跑赢了比特币‘买入持有’(Buy & Hold)的基准收益,展现了极致的阿尔法(Alpha)捕捉能力。"
Introduction :Simplicity is the ultimate sophistication. This strategy is designed specifically for Bitcoin (BTC), capturing its unique characteristics: high volatility, frequent fakeouts, and massive trend persistence. It abandons complex indicators in favor of a robust logic: "Follow the Trend, Filter the Noise, Let Profits Run."
Core Logic
Trend Filter (Fibonacci EMA 144): We use the 144-period Exponential Moving Average as the baseline. Longs are only taken above this line, and shorts only below. This keeps you on the right side of the major trend.
Volatility Breakout (Donchian Channel 20): Entries are triggered only when price breaks the 20-day high (for longs) or low (for shorts). This confirms momentum and avoids trading in chop.
Dynamic Risk Management (ATR Chandelier Exit):
Instead of fixed % stops, we use Average True Range (ATR) to calculate stop losses.
The Ratchet Mechanism: The stop loss moves up with the price but never moves down (for longs). This locks in profits automatically as the trend develops and exits immediately when volatility turns against you.
Why Use This Strategy?
Zero Repainting: All signals are confirmed.
No Curve Fitting: Uses classic parameters (144, 20) that have worked for decades.
Mental Peace: The strategy handles the exit. You don't need to guess where to sell. It holds through minor corrections and exits only when the trend truly reverses.
Settings
Leverage %: Adjust your position size based on equity (default 100% = 1x).
Timeframe: Recommended for 4H charts.
中文版 (Chinese Version)
简介 :大道至简。本策略专为 比特币 (BTC) 设计,针对其高波动、假突破多但趋势爆发力强的特点,摒弃了复杂的过度拟合指标,回归交易本质:“顺大势,滤噪音,截断亏损,让利润奔跑”。
核心逻辑
趋势过滤器 (斐波那契 EMA 144): 使用 144 周期指数移动平均线作为多空分水岭。价格在均线之上只做多,之下只做空。这能有效过滤掉大部分震荡市的噪音。
波动率突破 (唐奇安通道 20): 只有当价格突破过去 20 根 K 线的最高价(做多)或最低价(做空)时才进场。这确保了我们只在趋势确立的瞬间入场。
动态风控 (ATR 吊灯止损):
拒绝固定点数止损,使用 ATR(平均真实波幅)根据市场热度动态计算安全距离。
棘轮机制: 止损线会跟随价格上涨而上移,但绝不会下移(做多时)。这实现了自动化的“利润锁定”,既能扛住正常的波动回调,又能在大势反转时果断离场。
策略优势
绝不重绘: 所有信号均为收盘确认或实时触价。
拒绝拟合: 使用经过数十年市场验证的经典参数组合。
心态管理: 策略全自动管理出场。你不需要纠结何时止盈,它会帮你吃到完整的鱼身,直到趋势结束。
使用建议
资金管理: 可通过参数调整仓位占比(默认 100% = 1倍杠杆)。
推荐周期: 建议在4小时 图表上运行效果最佳。
Dynamic Breakout Odds [RayAlgo]█ OVERVIEW
Dynamic Breakout Odds is a probability-based breakout tool that uses ATR and pattern matching to estimate how likely price is to expand up or down from the current candle.
Instead of guessing, the indicator scans historical candles that look like the current one and measures how often price broke above or below by a volatility-based amount.
It then projects those probabilities forward as clean levels and a bias dashboard on your chart.
Use it to quickly answer:
• “Is the next move statistically more likely up or down?”
• “How far does price typically travel from here, in ATR terms?”
█ CONCEPTS
Candle Profile Matching
The script builds a “profile” of the current setup using two elements:
• The color of the previous candle (bullish close vs bearish close)
• The trend environment (above/below EMA, if the filter is enabled)
Only historical candles with the same profile are used for statistics. This keeps the probabilities specific to the current context instead of mixing all market conditions together.
ATR-Based Expansion
For every matching historical candle, the script checks how far price moved away from the open using ATR:
• Upward move thresholds
• Moderate expansion (≈ 0.5 ATR above the open)
• Stronger expansion (≈ 1.0 ATR above the open)
• Downward move thresholds
• Moderate expansion (≈ 0.5 ATR below the open)
• Stronger expansion (≈ 1.0 ATR below the open)
It counts how often each expansion happened, then converts those counts into probabilities.
Normalized Probability Scores
The indicator doesn’t just show raw percentages; it normalizes them so that all scenarios together form a consistent probability set.
Internally it tracks four outcomes for similar candles:
• Chance of a moderate move upward
• Chance of a strong move upward
• Chance of a moderate move downward
• Chance of a strong move downward
These are then normalized so the total is roughly 100%. From this, two main metrics are derived:
• Bullish Strength = combined normalized odds of upside moves
• Bearish Strength = combined normalized odds of downside moves
Whichever side has the higher score defines the current directional bias .
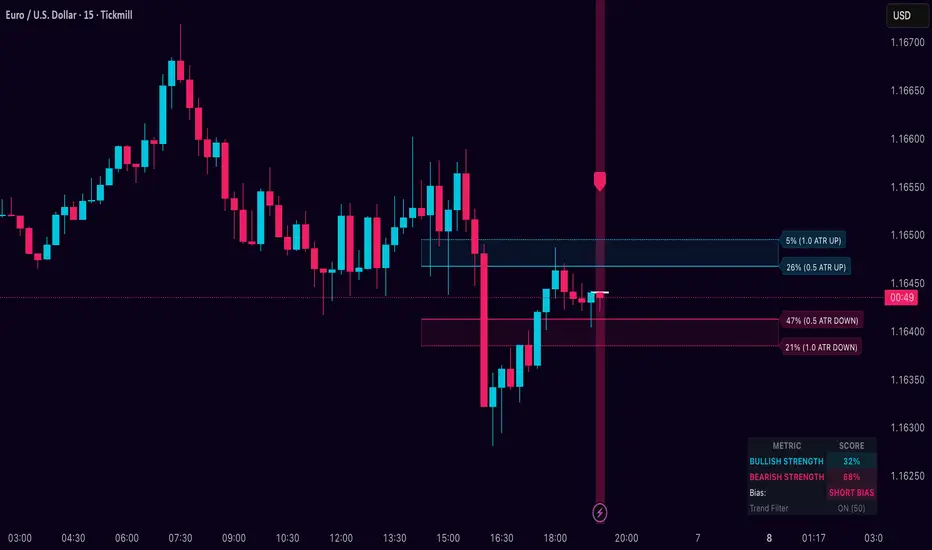
█ WHAT YOU SEE ON THE CHART
1. Breakout Projection Levels
Four horizontal levels are projected around the open of the current bar:
• Two upside levels
• Nearer upside expansion (~0.5 ATR above the open)
• Further upside expansion (~1.0 ATR above the open)
• Two downside levels
• Nearer downside expansion (~0.5 ATR below the open)
• Further downside expansion (~1.0 ATR below the open)
Each line extends a configurable number of bars into the future, so you visually see a breakout “corridor” above and below price.
2. Probability Labels
At the right edge of each line, you’ll see a label such as:
• “X% – near upside”
• “Y% – further downside”
These labels tell you how frequently similar candles in the chosen lookback reached that expansion. You immediately know which scenario has been more common historically.
3. Breakout Zones
Between the paired upside lines and the paired downside lines, shaded “probability zones” can be shown:
• The upper shaded band highlights the typical upside expansion range
• The lower shaded band highlights the typical downside expansion range
These zones visually group probable target areas instead of just single lines.
4. Background Tint
The background behind price is softly tinted towards:
• Bullish color when Bullish Strength > Bearish Strength
• Bearish color when Bearish Strength > Bullish Strength
The stronger the statistical imbalance between the two, the more pronounced the tint. This gives you an instant feel for whether conditions lean more Long, more Short, or are nearly Neutral.
5. Directional Bias Arrow
On the last bar the script can plot a clean arrow:
• Up-arrow below price when bullish odds dominate
• Down-arrow above price when bearish odds dominate
The arrow is positioned beyond all projection lines, making it easy to see even on cluttered charts and reminding you of the current statistical bias without text.
6. Origin Marker
A small horizontal mark is drawn at the open of the current candle.
This acts as the “starting point” from which all ATR-based expansions above and below are measured.
7. Dashboard Panel
A compact dashboard is drawn in a corner of the chart (location configurable). It displays:
• Bullish Strength – combined normalized probability for upside expansions
• Bearish Strength – combined normalized probability for downside expansions
• Bias – “Long Bias”, “Short Bias”, or “Neutral”
• Trend Filter – shows whether EMA-based filtering is ON or OFF and which length is used
This gives you a quick, text-based summary of the current statistical environment.
█ SETTINGS
Analysis Lookback Period
• Controls how many historical bars the script inspects when searching for similar candles.
• Larger values = more history, smoother statistics, slower adaptation.
• Smaller values = faster adaptation, but more noise and less stability.
ATR Length
• The period used to compute ATR volatility.
• Defines how “big” 0.5 ATR and 1.0 ATR moves are on your current symbol and timeframe.
Trend Filter (EMA)
• Filter by Trend?
• When ON, only historical candles in a similar trend regime are used.
• When OFF, all past candles with similar color are considered, regardless of trend.
• Trend EMA Length
• EMA period used to classify trend.
• Price above EMA → uptrend environment.
• Price below EMA → downtrend environment.
This filter helps you separate behavior in uptrends from downtrends, which can significantly change breakout dynamics.
Visual Settings
• Projection Width (bars)
• How far the lines and zones extend into the future.
• Show Probability Zones
• Toggle shaded bands between each pair of levels.
• Label Size
• Choose smaller or larger text for the probability labels on the right.
• Tint Background by Bias
• Turn the bias-based background on or off.
• Show Bias Marker on Last Candle
• Toggle the up/down arrow marker.
• Dashboard Location
• Select top/bottom left/right corner for the panel.
█ HOW TO USE IT
1. Start With the Dashboard
Look at Bullish Strength vs Bearish Strength:
• If bullish is clearly larger → environment statistically favors upside expansion.
• If bearish is clearly larger → environment statistically favors downside expansion.
• If they are close → treat the situation as Neutral; consider reducing position size or waiting for more clarity.
2. Use Levels as Dynamic Targets
The projected lines and zones can serve as:
• Profit targets based on typical expansion distance
• Logical regions for scaling out
• Areas where you expect price behavior to change (e.g., loss of momentum)
Short-term traders often focus on the nearer expansion levels, while swing traders may use the farther levels as extended targets.
3. Align With Trend (Optional)
With the trend filter ON:
• Prefer Long setups when price is above the EMA and bullish probabilities dominate.
• Prefer Short setups when price is below the EMA and bearish probabilities dominate.
With the filter OFF, you get pure color-plus-pattern statistics across the whole lookback, which can be useful if you deliberately trade counter-trend or range conditions.
4. Combine With Your Existing System
Dynamic Breakout Odds is best used as a confirmation and targeting layer :
• Combine it with structure (support/resistance, supply/demand, order blocks).
• Combine it with volume or orderflow tools if you use them.
• Use the probability zones to validate whether your planned target is realistic relative to recent volatility.
It is not designed to be a standalone “buy/sell” signal generator, but a statistical map around your entries.
█ PRACTICAL EXAMPLES
Example A – Bullish, Moderate Expansion Frequently Hit
• Bullish Strength significantly higher than Bearish Strength.
• The nearer upside level shows a strong historical hit rate.
Interpretation: similar setups often produce at least a moderate push upward before failing.
Use case: trade pullbacks in the direction of the bias, targeting the nearer upside projection as an initial take-profit.
Example B – Bearish, Deeper Downside Often Reached
• Bearish Strength clearly dominant.
• Both the nearer and farther downside levels show decent probabilities.
Interpretation: similar conditions historically saw follow-through to the downside.
Use case: use rallies against the direction of the bias to position into shorts, planning partial exits around the first downside projection and runners toward the second.
Example C – Neutral, Balanced Probabilities
• Bullish and Bearish Strength scores are close.
• Background tint is very light or absent.
Interpretation: the market is statistically indecisive; expansions up or down are similarly likely.
Use case: consider range trading tactics, mean-reversion ideas, or simply standing aside until a clearer skew develops.
█ BEST PRACTICES
• Use on liquid symbols and reasonable timeframes to avoid distorted ATR behavior.
• Don’t overfit lookback length to a single instrument; test across markets.
• Let the indicator provide context, not absolute certainty.
• Always combine with proper risk management (position sizing, max loss per trade, etc.).
• Be cautious with very small sample sizes (e.g., very short lookbacks on low-volume assets).
█ LIMITATIONS & NOTES
• All probabilities are based on historical behavior ; markets can change regime.
• ATR distances are relative to recent volatility and may shrink/expand over time.
• The script intentionally does not guarantee any direction or target; it only reports what has been most common in similar past situations.
█ DISCLAIMER
This tool is for educational and informational purposes only.
It does not constitute financial advice or a guarantee of performance.
Always do your own research, test on demo or historical data, and use appropriate risk management when trading live capital.
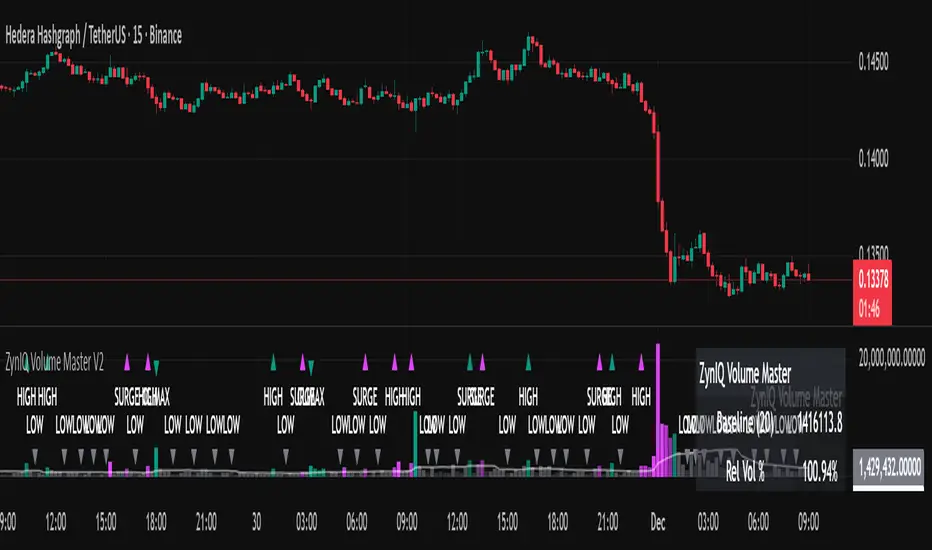
ZynIQ Volume Surge Master v2 - (Lite Pack)Overview
ZynIQ Volume Surge Master v2 (Lite) highlights abnormal increases in trading volume and identifies moments when market participation expands significantly. It provides clean, visual alerts that help traders spot shifts in activity that often precede directional moves.
Key Features
• Surge detection based on volatility-adjusted volume thresholds
• Configurable sensitivity for different markets or timeframes
• Clear labels showing surge conditions
• Optional HUD panel with surge status
• Lightweight visuals designed for intraday charting
• Works alongside trend, breakout or momentum tools for confirmation
Use Cases
• Spotting volume expansion during breakouts
• Identifying exhaustion vs. continuation conditions
• Filtering entries based on participation strength
• Assessing when a move has real momentum behind it
Notes
This tool highlights volume surges for context and confirmation. It is not a standalone trading system. Use it together with your preferred market structure tools and risk management.
Adaptive Trend Mapper-ATM (Arjo)Adaptive Trend Mapper (ATM) is a multi-factor trend, momentum, and compression-analysis tool designed to help traders visually map the strength and direction of market pressure.
Instead of simply combining existing indicators, ATM creates a new composite framework that blends momentum imbalance, directional strength, volatility contraction, and adaptive smoothing into a single, unified model.
Originality and usefulness
Adaptive Trend Mapper (ATM) does not replicate any one indicator.
It generates two custom indices— Bull Pressure Index and Bear Pressure Index —derived from a mathematical combination of RSI, inverse-RSI, and ADX. These indices behave differently from traditional oscillators:
They represent directional pressure on a 0–100 scale , not momentum.
They are designed to converge/diverge, forming a basis for the built-in Squeeze Detection Engine.
They can be optionally step-compressed , making the movement easier to read on fast or small charts.
The script also integrates a custom SuperSmoother trend model (not TradingView’s built-in function), which acts as an adaptive trend curve on the chart.
All calculations are combined intentionally—not as a mashup—to create a framework that allows traders to understand trend strength, compression phases, and micro-trend shifts in one place.
How the Indicator Works
1. Bull & Bear Pressure Indices:
These indices measure directional imbalance:
Bull Index = ADX strength weighted against inverse-RSI
Bear Index = ADX strength weighted against normal RSI
This produces two opposing pressure curves that rise or fall depending on whether buyers or sellers dominate.
You can optionally smooth these using:
SMA / EMA / WMA / RMA via the “Smoothing Settings” panel.
2. Squeeze & Compression Detection:
A squeeze is detected when:
ADX stays below a user-defined threshold
Bull–Bear Index difference shrinks
Average difference is falling (convergence)
This is a volatility-contraction model inspired by squeeze logic but applied to directional pressure, not Bollinger Bands/Keltner Channels .
3. Adaptive Trend Curve (SuperSmoother Engine)
The indicator applies a two-pole SuperSmoother filter to the price, then smooths it again using EMA.
The slope color flips between bullish and bearish and is displayed using:
A thin SuperSmoother curve
A thicker band for visual context
4. EMA-50 Trend Context:
An optional EMA-50 helps identify broad directional bias .
5. Step-Based Scaling
You can quantize the Bull/Bear indices using custom step intervals.
This makes the indicator easier to read on noisy intraday charts.
How to Use the Indicator
1. Trend Analysis
A rising Bull Index shows strengthening upward pressure
A rising Bear Index shows strengthening downward pressure
Wide divergence between the indices signals a strong trend
2. Compression / Squeeze Analysis
Yellow background = volatility compression + pressure convergence
Breakouts from this zone often precede directional expansion
3. Trendline Reading
SuperSmoother line color flip = micro trend shift
EMA-50 slope gives macro-trend direction
Perfect for combining trend and momentum maps on the same chart
4. Visual Interpretation
Cyan/teal → strong bullish pressure
Purple/red/orange → various levels of bearish control
Neutral/teal background → weak ADX
Yellow background → squeeze zone
Open-Source Notes
This script uses:
TradingView built-in RSI, ADX/DMI, and smoothing functions
A SuperSmoother implementation based on known DSP filter coefficients
All remaining logic, signal methods, composite indices, and compression model are original developments by ARJO .
The script is published open-source to comply with TradingView’s reuse policy.
Disclaimer
This tool is for educational and analytical purposes only.
It does not generate buy or sell signals.
Always use proper risk management.
Happy Trading (ARJO)

Trendlines with Breaks Oscillator [LuxAlgo]The Trendlines with Breaks Oscillator is an oscillator based on the Trendlines with Breaks indicator, and tracks the maximum distance on price from bullish and bearish trendline breakouts.
The oscillator features divergences and trendline breakout detection.
🔶 USAGE
This tool is based on our Trendlines with Breaks indicator, which detects bullish and bearish trendlines and highlights the breaks on the chart. Now, we bring you this tool as an oscillator.
The oscillator calculates the maximum distance between the price and the break of each trendline, for both bullish and bearish cases, then calculates the delta between both.
When the oscillator is above 0, the market is in an uptrend; when it is below 0, it is in a downtrend. An ascending slope indicates positive momentum, and a descending slope indicates negative momentum.
Trendline breaks are displayed as green and red dots on the oscillator. A green dot corresponds to a bullish break of a descending trendline, and a red dot corresponds to a bearish break of an ascending trendline.
The oscillator calculation depends on two parameters from the settings panel: short and long alpha length. These parameters are used to calculate a synthetic EMA with a variable alpha for both bullish and bearish breaks. The final result is the difference between the two averages.
As shown in the image, using the same trend detection parameters but different alphas can produce very different results. The larger the alphas, the smoother the oscillator becomes, detecting bigger trends but making it less reactive.
This tool features the same trendline detection system as the Trendlines with Breaks indicator, which is based on three main parameters: swing length, slope, and calculation method.
As we can see in the image above, the data collected for the oscillator calculation will be different when using different parameters. A larger length detects larger trends. A larger slope or a different calculation method also impacts the final result.
🔹 Signal Line
The signal line is a smoothed version of the oscillator; traders can choose the smoothing method and length used from the settings panel.
In the image, the signal line crossings are displayed as vertical lines. As we can see, the market usually corrects downward after a bearish crossing and corrects upward after a bullish crossing.
Traders can choose among 10 different smoothing methods for the signal line. In the image, we can see how different methods and lengths give different outputs.
🔹 Divergences
The tool features a divergence detector that helps traders understand the strength behind price movements. Traders can adjust the detection length from the settings panel.
As shown in the image, a bearish divergence occurs when the price prints higher highs, but the momentum on the histogram prints lower highs. A bullish divergence occurs when the price prints lower lows, but the histogram prints higher lows.
By adjusting the length of the divergence detector, traders can filter out smaller divergences, allowing the tool to only detect more significant ones.
The image above depicts divergences detected with different lengths; the larger the length, the bigger the divergences are detected.
🔶 SETTINGS
🔹 Trendlines
Swing Detection Lookback: The size of the market structure used for trendline detection.
Slope: Slope steepness, a value of 0 gives horizontal levels, values larger than 1 give a steeper slope
Slope Calculation Method: Choose how the slope is calculated
🔹 Oscillator
Short Alpha Length: Synthetic EMA short period
Long Alpha Length: Synthetic EMA long period
Smoothing Signal: Choose the smoothing method and period
Divergences: Enable or disable divergences and select the detection length.
🔹 Style
Bullish: Select bullish color.
Bearish: Select bearish color.

1st 4H Candle [ApexFX]Overview
This indicator identifies the very first 4-hour candle of the trading day and plots its high and low as horizontal lines. These levels are designed to act as key support and resistance for the rest of the 24-hour session.
The lines are calculated using 4-hour data but display on any timeframe, allowing you to see these key daily levels while trading on lower timeframes like the 15-minute or 5-minute chart. The lines extend for the first six 4-hour candles (24 hours) before stopping.
Features
Flexible Timezone: A simple dropdown menu to select your local timezone (e.g., "America/New_York", "Europe/London", "UTC") to ensure the candle is always correctly identified.
Asset Presets: Instantly set the correct start time for major asset classes:
Forex (23:00)
Indices (00:00)
Crypto (21:00)
Fully Custom: A "Custom" option lets you define any hour and minute for the start of your session, giving you full control for other assets like Gold or Oil.
Custom Colors: Change the color of the high and low lines from the settings menu.
How to Use
Add the indicator to your chart.
Open the indicator's "Settings".
In the "Your Timezone" dropdown, select the same timezone you use for your chart (e.g., "America/New_York").
In the "Asset Type Preset" dropdown, choose the asset you are trading (e.g., "Indices").
The indicator will wait for the first 4-hour candle (e.g., the 00:00 candle for Indices) to close, and then it will automatically draw the high and low lines.

Pulsar Trading System-LITE📡 Pulsar Trading System
OVERVIEW
Pulsar is a comprehensive breakout trading system that combines dynamic support/resistance detection, trend filtering, and volume confirmation to identify high-probability entry opportunities. Unlike simple breakout indicators, Pulsar uses multi-timeframe analysis and adaptive ATR-based calculations to filter false signals and provide complete trade management from entry to exit.
WHAT MAKES THIS ORIGINAL
This indicator is unique in its integration of multiple complementary systems:
-Adaptive ATR Zones: Support and resistance levels are not static—they dynamically adjust based on current market volatility (ATR), creating entry zones that expand and contract with market conditions rather than using fixed price levels.
-Multi-Timeframe SuperTrend Filter: The trend filter operates on a higher timeframe than the chart (e.g., 5-minute SuperTrend on a 1-minute chart) to prevent counter-trend trades while maintaining granular entry precision. The visual ribbon with humorous warning text ("🚫 Don't Short - Trend is Your Friend! 📈") provides immediate trend awareness.
-Intelligent Cooldown System: After any trade exit (stop loss or take profit), the system enters a configurable cooldown period, preventing overtrading during choppy or consolidating market conditions—a critical feature often missing in breakout systems.
-Dynamic Trailing Stops: The trailing stop uses ATR multipliers to lock in profits while adapting to volatility, moving only in the favorable direction and never loosening.
-Comprehensive Dashboard: Real-time analysis displays trade status, entry prices, distances to targets in both points and ATR multiples, volume confirmation status, and cooldown countdown.
HOW IT WORKS
Core Detection Logic:
Pulsar identifies breakout opportunities by monitoring price interaction with dynamically calculated support and resistance levels:
Support/Resistance Calculation: Uses ta.lowest() and ta.highest() over a configurable lookback period to identify key levels, then adds ATR-based buffers (0.5 × ATR) to create entry zones.
Breakout Conditions:
Long Entry: Price closes above support buffer AND recent low touched support AND volume exceeds threshold
Short Entry: Price closes below resistance buffer AND recent high touched resistance AND volume exceeds threshold
SuperTrend Filter: A separate higher-timeframe SuperTrend calculation determines overall trend direction. Entries only trigger when breakout direction aligns with SuperTrend (bullish breakout + bullish trend, or bearish breakout + bearish trend).
Volume Confirmation: Current volume must exceed a configurable multiple of the 14-period SMA (default 1.0×) to confirm genuine interest in the breakout.
Cooldown Mechanism: After exit, the system tracks bars elapsed and blocks new signals until the cooldown period completes, preventing rapid-fire entries in ranging markets.
Trade Management:
Stop Loss: Calculated as entry zone ± (ATR × SL Multiplier)
Take Profit 1: Entry zone ± (ATR × TP1 Multiplier)
Take Profit 2: Entry zone ± (ATR × TP2 Multiplier)
Trailing Stop (optional): Updates every bar, moving the stop closer by maintaining distance of (ATR × Trailing Multiplier) from current price, but only in favorable direction
SuperTrend Calculation:
The SuperTrend uses standard methodology:
Upper Band = (High + Low) / 2 + (Multiplier × ATR)
Lower Band = (High + Low) / 2 - (Multiplier × ATR)
Direction changes when price crosses opposite band
The ribbon visualization adds a width offset (ATR × Ribbon Width) to create a filled zone rather than a single line.
HOW TO USE
Setup:
Add Pulsar to your chart (works best on liquid instruments like NQ, ES, CL)
Configure timeframe-specific settings (see recommendations below)
Enable SuperTrend Filter for trend-following mode, or disable for pure breakout mode
Set up alerts for Entry, TP1, TP2, and Stop Loss events
Recommended Settings by Timeframe:
1-Minute Charts:
Lookback Period: 10-15
SuperTrend Timeframe: 5 min
ATR Timeframe: 5 min (for stability)
Cooldown: 8-12 bars
Trailing Stop: Enabled with 0.8-1.0 multiplier
5-Minute Charts:
Lookback Period: 15-20
SuperTrend Timeframe: 15 min
ATR Timeframe: current chart
Cooldown: 5-8 bars
Trailing Stop: Optional
15-Minute+ Charts:
Lookback Period: 20-30
SuperTrend Timeframe: 1 hour
ATR Timeframe: current chart
Cooldown: 3-5 bars
Trailing Stop: Optional
Interpreting Signals:
Long/Short Zone Box: Green (long) or red (short) box appears when breakout conditions are met
Blue Entry Line: Shows your entry price
Red/Orange SL Line: Red = fixed stop, Orange = trailing stop (moves in real-time)
Green TP Lines: TP1 (closer) and TP2 (further) targets
SuperTrend Ribbon: Green = bullish trend (favor longs), Red = bearish trend (favor shorts)
Dashboard Status: Monitor trade state, distances, volume confirmation, and cooldown
Best Practices:
Use SuperTrend Filter: Significantly reduces false signals by avoiding counter-trend trades
Enable Cooldown on Fast Timeframes: Prevents overtrading on 1-5 minute charts
Volume Confirmation is Critical: Don't lower volume multiplier below 0.9 on futures
Use Higher Timeframe ATR: On 1-minute charts, use 5-minute ATR for stability
Avoid Major News Events: Disable during FOMC, NFP, CPI releases
Scale Out Strategy: Consider taking partial profits at TP1, letting remainder run to TP2
Parameter Optimization:
Start conservative and adjust based on results:
Too many stop-outs: Increase SL multiplier or SuperTrend multiplier
Missing good trades: Decrease volume multiplier or cooldown period
Too many false signals: Increase volume multiplier, lookback period, or cooldown
Profits not protected: Enable trailing stop or reduce trailing multiplier
KEY FEATURES
✅ Dynamic ATR-Based Zones: Entry, stop loss, and take profit levels automatically adjust to market volatility
✅ Multi-Timeframe Trend Filter: Uses higher timeframe SuperTrend to eliminate counter-trend trades
✅ Volume Confirmation: Filters low-volume false breakouts
✅ Intelligent Cooldown: Prevents overtrading with configurable post-trade waiting period
✅ Trailing Stop System: Optional dynamic stops that lock in profits using ATR distance
✅ Real-Time Dashboard: 13-row analysis showing trade status, targets, distances, volume, and cooldown
✅ Visual Ribbon Warnings: Humorous trend-following reminders on SuperTrend ribbon
✅ Complete Alert System: Notifications for entries, TP1, TP2, fixed stops, and trailing stops
✅ Customizable Visuals: Adjustable colors, dashboard position, text size, and line lengths
✅ Non-Repainting: Uses lookahead = barmerge.lookahead_off for all multi-timeframe calculations
SETTINGS EXPLAINED
SuperTrend Filter:
Enable: Toggle trend filtering on/off
Timeframe: Higher timeframe for trend analysis (recommended 3-5x chart timeframe)
ATR Period: Period for ATR calculation in SuperTrend (10-14 standard)
Multiplier: Distance from center band (2.5-3.5 for most markets)
Ribbon Width: Visual thickness of trend ribbon (0.2-0.5)
Core Parameters:
Lookback Period: Bars used to identify support/resistance (lower = more sensitive)
ATR Period: Bars for Average True Range calculation (14 is standard)
ATR Timeframe: Use higher timeframe ATR for smoother calculations on fast charts
Volume Multiplier: Required volume vs average (1.0 = average, 1.5 = 50% above average)
TP/SL:
SL Multiplier: Stop loss distance in ATR units (1.0-2.0 typical)
TP1 Multiplier: First target in ATR units (1.5-2.5 typical)
TP2 Multiplier: Second target in ATR units (2.0-3.5 typical)
Trailing Stop:
Enable: Activate dynamic trailing stop
Multiplier: Distance from current price in ATR units (0.8-1.5 typical)
Cooldown:
Enable: Prevent new signals after trade exit
Bars: Number of bars to wait before allowing next trade (higher on fast timeframes)
IMPORTANT NOTES
⚠️ Not a Holy Grail: No indicator is perfect. Pulsar is a tool that requires proper risk management, position sizing, and trading discipline.
⚠️ Backtest First: Test settings on historical data before live trading. Results vary by instrument, timeframe, and market conditions.
⚠️ Market Conditions Matter: Breakout systems perform best in trending markets. Consider reducing size or disabling during known choppy periods.
⚠️ Stop Loss is Mandatory: Always use the provided stop loss levels. Markets can move against you rapidly.
⚠️ Volume Data Required: This indicator requires volume data to function properly. It will display a warning if volume is unavailable.
⚠️ No Repainting: All multi-timeframe calls use non-repainting settings. What you see in real-time is what will be plotted historically.
TECHNICAL SPECIFICATIONS
Version: Pine Script v6
Type: Indicator (overlay = true)
Max Boxes: 500 (for zone visualization)
Max Lines: 500 (for TP/SL levels)
Max Labels: Unlimited (for annotations)
Repainting: None (uses lookahead = barmerge.lookahead_off)
COMPATIBLE INSTRUMENTS
Works best on liquid instruments with reliable volume data:
✅ Futures: NQ, MNQ, ES, MES, YM, MYM, RTY, M2K, CL, GC
✅ Forex: Major pairs (EUR/USD, GBP/USD, etc.)
✅ Stocks: Large-cap stocks with high volume
⚠️ Crypto: Works but requires higher ATR multipliers
❌ Low Volume Stocks: May produce unreliable signals
SUPPORT
For questions, suggestions, or to report issues, please comment below. I actively maintain this indicator and appreciate feedback from the community.
Enjoy trading with Pulsar! 🌟

LucciThis indicator identifies trade setups based on session liquidity levels and price structure analysis during New York trading sessions.
Unlike basic support/resistance indicators, this system tracks untested session extremes and monitors their interaction with price. It combines break-and-retest mechanics with bounce detection at key liquidity zones, providing multiple entry methodologies within a single framework.
METHODOLOGY:
The system maps high/low points from each trading session (Asia: 6PM-3AM, London: 3AM-8AM, NY: 8AM-5PM EST) and monitors price behavior around these levels. It identifies two primary setup types: momentum continuation after level breaks and reversal bounces at untested extremes. Visual differentiation shows which levels remain untested (darker) versus swept levels (lighter).
SETUP IDENTIFICATION:
Break & Retest Signals:
- Detects breaks of NY Open range (15-minute candle at 8:00 AM EST)
- Waits minimum bars after break before validating retest
- Triggers when price returns to level within tolerance zone
Bounce Signals:
- Identifies approaches to untested session highs/lows
- Optional wick confirmation for reversal validation
- Signals when price rejects from liquidity zone
CONFIGURATION OPTIONS:
Entry Parameters:
- Min Bars After Break: 1-10 (delay before retest valid)
- Retest Tolerance: 0.1-10 points (precision of level test)
- Bounce Zone: 0.5-5 points (distance from level)
- Wick Confirmation: On/off reversal filter
Risk Management:
- Risk Reward Options: 1:3, 1:5, or Custom (1:1 to 1:10)
- Stop Loss: Configurable in points
- Max Daily Signals: 1-5 trade limiter
- Trading Hours: Customizable active window
Visual Elements:
- Session Levels: Orange (Asian), Yellow (London), Blue (NY)
- Signal Markers: Triangles (B&R), Diamonds (Bounce)
- TP/SL Lines: Automatic calculation and display
- Info Table: Shows bias, untested levels, daily signals
OPTIMAL USAGE:
Trading Windows:
- 9:30-11:00 AM EST: Primary trading window
- First touch of untested levels: Highest probability
- 15-minute timeframe: Recommended for futures
- Volume filter: Optional quality enhancement
Signal Prioritization:
- Untested levels provide stronger reactions
- Multiple confirmations increase probability
- Respect market structure and session context
- Combine with volume for filtering
TECHNICAL SPECIFICATIONS:
- Multi-timeframe: Uses 15-minute data for NY Open
- Session-based: Resets levels at session transitions
- Alert system: Detailed messages with levels
- Position tracking: Manages active trades visually
IMPORTANT NOTES:
This tool maps liquidity zones based on session extremes and price structure. No trading system guarantees profits. Combine with market context and proper risk management. Designed for active intraday trading on liquid instruments.
The indicator provides objective level identification while requiring trader discretion for optimal results.

Candle Breakout StrategyShort description (one-liner)
Candle Breakout Strategy — identifies a user-specified candle (UTC time), draws its high/low range, then enters on breakouts with configurable stop-loss, take-profit (via Risk:Reward) and optional alerts.
Full description (ready-to-paste)
Candle Breakout Strategy
Version 1.0 — Strategy script (Pine v5)
Overview
The Candle Breakout Strategy automatically captures a single "range candle" at a user-specified UTC time, draws its high/low as a visible box and dashed level lines, and waits for a breakout. When price closes above the range high it enters a Long; when price closes below the range low it enters a Short. Stop-loss is placed at the opposite range boundary and take-profit is calculated with a user-configurable Risk:Reward multiplier. Alerts for entries can be enabled.
This strategy is intended for breakout style trading where a clearly defined intraday range is established at a fixed time. It is simple, transparent and easy to adapt to multiple symbols and timeframes.
How it works (step-by-step)
On every bar the script checks the current UTC time.
When the first bar that matches the configured Target Hour:Target Minute (UTC) appears, the script records that candle’s high and low. This defines the breakout range.
A box and dashed lines are drawn on the chart to display the range and extended to the right while the range is active.
The script then waits for price to close outside the box:
Close > Range High → Long entry
Close < Range Low → Short entry
When an entry triggers:
Stop-loss = opposite range boundary (range low for longs, range high for shorts).
Take-profit = entry ± (risk × Risk:Reward). Risk is computed as the distance between entry price and stop-loss.
After entry the range becomes inactive (waitingForBreakout = false) until the next configured target time.
Inputs / Parameters
Target Hour (UTC) — the hour (0–23) in UTC when the range candle is detected.
Target Minute — minute (0–59) of the target candle.
Risk:Reward Ratio — multiplier for computing take profit from risk (0.5–10). Example: 2 means TP = entry + 2×risk.
Enable Alerts — turn on/off entry alerts (string message sent once per bar when an entry occurs).
Show Last Box Only (internal behavior) — when enabled the previous box is deleted at the next range creation so only the most recent range is visible (default behavior in the script).
Visuals & On-chart Info
A semi-transparent blue box shows the recorded range and extends to the right while active.
Dashed horizontal lines mark the range high and low.
On-chart shapes: green triangle below bar for Long signals, red triangle above bar for Short signals.
An information table (top-right) displays:
Target Time (UTC)
Active Range (Yes / No)
Range High
Range Low
Risk:Reward
Alerts
If Enable Alerts is on, the script sends an alert with the following formats when an entry occurs:
Long alert:
🟢 LONG SIGNAL
Entry Price:
Stop Loss:
Take Profit:
Short alert:
🔴 SHORT SIGNAL
Entry Price:
Stop Loss:
Take Profit:
Use TradingView's alert dialog to create alerts based on the script — select the script’s alert condition or use the alert() messages.
Recommended usage & tips
Timeframe: This strategy works on any timeframe but the definition of "candle at target time" depends on the chart timeframe. For intraday breakout styles, use 1m — 60m charts depending on the session you want to capture.
Target Time: Choose a time that is meaningful for the instrument (e.g., market open, economic release, session overlap). All times are handled in UTC.
Position Sizing: The script’s example uses strategy.percent_of_equity with 100% default — change default_qty_value or strategy settings to suit your risk management.
Filtering: Consider combining this breakout with trend filters (EMA, ADX, etc.) to reduce false breakouts.
Backtesting: Always backtest over a sufficiently large and recent sample. Pay attention to slippage and commission settings in TradingView’s strategy tester.
Known behavior & limitations
The script registers the breakout on close outside the recorded range. If you prefer intrabar breakout rules (e.g., high/low breach without close), you must adjust the condition accordingly.
The recorded range is taken from a single candle at the exact configured UTC time. If there are missing bars or the chart timeframe doesn't align, the intended candle may differ — choose the target time and chart timeframe consistently.
Only a single active position is allowed at a time (the script checks strategy.position_size == 0 before entries).
Example setups
EURUSD (Forex): Target Time 07:00 UTC — captures London open range.
Nifty / Index: Target Time 09:15 UTC — captures local session open range.
Crypto: Target Time 00:00 UTC — captures daily reset candle for breakout.
Risk disclaimer
This script is educational and provided as-is. Past performance is not indicative of future results. Use proper risk management, test on historical data, and consider slippage and commissions. Do not trade real capital without sufficient testing.
Change log
v1.0 — Initial release: range capture, box and level drawing, long/short entry by close breakout, SL at opposite boundary, TP via Risk:Reward, alerts, info table.
If you want, I can also:
Provide a short README version (2–3 lines) for the TradingView “Short description” field.
Add a couple of suggested alert templates for the TradingView alert dialog (if you want alerts that include variable placeholders).
Convert the disclaimer into multiple language versions.

Smart Inside Bar Zones by Dinkan🔹 How It Works
An Inside Bar is formed when a candle’s high and low are completely within the previous candle’s range.
The indicator detects this structure in real time, creates a visual box around it, and extends the zone until the pattern is broken.
Inside Bar candles can be optionally highlighted with a custom color to make them stand out clearly on the chart.
🔹 Features
✅ Automatic Inside Bar detection
✅ Dynamic Inside Bar zone boxes with custom fill & border color
✅ Inside candle body highlighting with user-defined color
✅ Adjustable transparency and border style
✅ Option to display only the latest Inside Bar zone for cleaner charts
🔹 Usage
Traders can use Inside Bar zones to:
Study price compression and breakout regions
Observe range behavior and trend continuation setups
Combine with other tools like volume or support/resistance analysis
🔹 Customization
Change box fill and border color
Adjust Inside Candle color for better visibility
Set transparency and choose whether to show all or only the latest box
⚠️ Disclaimer
This script is intended for market structure visualization and educational purposes only.
It does not generate trading signals or financial advice.
Always perform your own analysis and risk management before making trading decisions.

HTF Cross Breakout [CHE] HTF Cross Breakout — Detects higher timeframe close crossovers for breakout signals, anchors VWAP for trend validation, and flags continuations or traps with visual extensions for delta percent and stop levels.
Summary
This indicator spots moments when the current chart's close price crosses a higher timeframe close, marking potential breakouts only when the current bar shows directional strength. It anchors a volume-weighted average price line from the breakout point to track trend health, updating labels to show if the move continues or reverses into a trap. Extensions add a dotted line linking the breakout level to the current close with percent change display, plus a stop-loss marker at the VWAP end. Signals gain robustness from higher timeframe confirmation and anti-repainting options, reducing noise in live bars compared to simple crossover tools.
Motivation: Why this design?
Traders often face false breakouts from intrabar wiggles on lower timeframes, especially without higher timeframe alignment, leading to whipsaws in volatile sessions. This design uses higher timeframe close as a stable reference for crossover detection, combined with anchored volume weighting to gauge sustained momentum. It addresses these by enforcing bar confirmation and directional filters, providing clearer entry validation and risk points without overcomplicating the chart.
What’s different vs. standard approaches?
Reference baseline
Standard crossover indicators like moving average crosses operate solely on the chart timeframe, ignoring higher timeframe context and lacking volume anchoring.
Architecture differences
- Higher timeframe data pulls via security calls with optional repainting control for stability.
- Anchored VWAP resets at each signal, accumulating from the breakout bar only.
- Label dynamics update in real-time for continuation checks, with extensions for visual delta and stop computation.
- Event-driven line finalization prunes old elements after a set bar extension.
Practical effect
Charts show persistent lines and labels that extend live but finalize cleanly on new events, avoiding clutter. This matters for spotting trap reversals early via label color shifts, and extensions provide quick risk visuals without manual calculations, improving decision speed in trend trades.
How it works (technical)
The indicator first determines a higher timeframe based on user selection, pulling its close price securely. It checks for crossovers or crossunders of the current close against this higher close, but only triggers on confirmed bars with matching directional opens and closes. On a valid event, a horizontal line and label mark the higher close level, while a dashed VWAP line starts accumulating typical price times volume from that bar onward. During the active phase, the breakout line extends to the current bar, the label repositions and updates text based on whether the current close holds above or below the level for bulls or bears. A background tint warns if the close deviates adversely from the current VWAP. Extensions draw a vertical dotted line at the last bar between the breakout level and close, placing a midpoint label with percent difference; separately, a label at the VWAP end shows a computed stop price. Persistent variables track the active state and accumulators, resetting on new events after briefly extending old elements. Repaint risk from security calls is mitigated by confirmed bar gating or user opt-in.
Parameter Guide
Plateau Length (reserved for future, currently unused): Sets a length for potential plateau detection in extensions; default 3, minimum 1. Higher values would increase stability but are not active yet—leave at default to avoid tuning.
Line Width: Controls thickness of breakout, VWAP, and extension lines; default 2, range 1 to 5. Thicker lines improve visibility on busy charts but may obscure price action—use 1 for clean views, 3 or more for emphasis.
+Bars after next HTF event (finalize old, then delete): Extends old lines and labels by this many bars before deletion on new signals; default 20, minimum 0. Shorter extensions keep charts tidy but risk cutting visuals prematurely; longer aids review but builds clutter over time.
Evaluate label only on HTF close (prevents gray traps intrabar): When true, label updates wait for higher timeframe confirmation; default true. Enabling reduces intrabar flips for stabler signals, though it may delay feedback—disable for faster live trading at repaint cost.
Allow Repainting: Permits real-time security data without confirmation offset; default false. False ensures historical accuracy but lags live bars; true speeds updates but can repaint on HTF closes.
Timeframe Type: Chooses HTF method—Auto Timeframe (dynamic steps up), Multiplier (chart multiple), or Manual (fixed string); default Auto Timeframe. Auto adapts to chart scale for convenience; Multiplier suits custom scaling like 5 times current; Manual for precise like 1D on any chart.
Multiplier for Alternate Resolution: Scales chart timeframe when Multiplier type selected; default 5, minimum 1. Values near 1 mimic current resolution for subtle shifts; higher like 10 jumps to broader context, increasing signal rarity.
Manual Resolution: Direct timeframe string like 60 for 1H when Manual type; default 60. Match to trading horizon—shorter for swing, longer for positional—to balance frequency and reliability.
Show Extension 1: Toggles dotted line and delta percent label between breakout level and current close; default true. Disable to simplify for basic use, enable for precise momentum tracking.
Dotted Line Width: Thickness for Extension 1 line; default 2, range 1 to 5. Align with main Line Width for consistency.
Text Size: Size for delta percent label; options tiny, small, normal, large; default normal. Smaller reduces overlap on dense charts; larger aids glance reads.
Decimals for Δ%: Precision in percent change display; default 2, range 0 to 6. Fewer decimals speed reading; more suit low-volatility assets.
Positive Δ Color: Hue for upward percent changes; default lime. Choose contrasting for visibility.
Negative Δ Color: Hue for downward percent changes; default red. Pair with positive for quick polarity scan.
Dotted Line Color: Color for Extension 1 line; default gray. Neutral tones blend well; brighter for emphasis.
Background Transparency (0..100): Opacity for delta label background; default 90. Higher values fade for subtlety; lower solidifies for readability.
Show Extension 2: Toggles stop-loss label at VWAP end; default true. Turn off for entry focus only.
Stop Method: Percent from VWAP end or fixed ticks; options Percent, Ticks; default Percent. Percent scales with price levels; Ticks suits tick-based instruments.
Stop %: Distance as fraction of VWAP for Percent method; default 1.0, step 0.05, minimum 0.0. Tighter like 0.5 reduces risk but increases stops; wider like 2.0 allows breathing room.
Stop Ticks: Tick count offset for Ticks method; default 20, minimum 0. Adjust per asset volatility—fewer for tight control.
Price Decimals: Rounding for stop price text; default 4, range 0 to 10. Match syminfo.precision for clean display.
Text Size: Size for stop label; options tiny, small, normal, large; default normal. Scale to chart zoom.
Text Color: Foreground for stop text; default white. Ensure contrast with background.
Inherit VWAP Color (BG tint): Bases stop label background on VWAP hue; default true. True maintains theme; false allows custom black base.
BG Transparency (0..100): Opacity for stop label background; default 0. Zero for no tint; up to 100 for full fade.
Reading & Interpretation
Breakout lines appear green for bullish crosses or red for bearish, extending live until a new event finalizes them briefly then deletes. Labels start blank, updating to Bull Cont. or Bear Cont. in matching colors if holding the level, or gray Bull Trap/Bear Trap on reversal. VWAP dashes yellow for bulls, orange for bears, sloping with accumulated volume weight—deviations trigger faint red background warnings. Extension 1's dotted vertical shows at the last bar, with midpoint label green/red for positive/negative percent from breakout to close. Extension 2 places a left-aligned label at VWAP end with stop price and method note, tinted to VWAP for context.
Practical Workflows & Combinations
For trend following, enter long on green Bull Cont. labels above VWAP with higher highs confirmation, filtering via rising structure; short on red Bear Cont. below. Pair with volume surges or RSI above 50 for bulls to avoid traps. For exits, trail stops using the Extension 2 level, tightening on warnings or gray labels—aggressive on continuations, conservative post-trap. In multi-timeframe setups, use default Auto on 15m charts for 1H signals, scaling multiplier to 4 for daily context on hourly; test on forex/stocks where volume is reliable, avoiding low-liquidity assets.
Behavior, Constraints & Performance
Signals confirm on bar close with HTF gating when strict mode active, but live bars may update if repainting enabled—opt false for backtest fidelity, true for intraday speed. Security calls risk minor repaints on HTF closes, mitigated by confirmation offsets. Resources cap at 1000 bars back, 50 lines/labels total, with event prunes to stay under budgets—no loops, minimal arrays. Limits include VWAP lag in low-volume periods and dependency on accurate HTF data; gaps or holidays may skew anchors.
Sensible Defaults & Quick Tuning
Defaults suit 5m-1H charts on liquid assets: Auto HTF, no repaint, 1% stops. For choppy markets with excess signals, enable strict eval and bump multiplier to 10 for rarer triggers. If sluggish in trends, shorten extend bars to 10 and allow repainting for quicker visuals. On high-vol like crypto, widen stop % to 2.0 and use Ticks method; for stables like indices, tighten to 0.5% and keep Percent.
What this indicator is—and isn’t
This is a signal visualization layer for breakout confirmation and basic risk marking, best as a filter in discretionary setups. It isn’t a standalone system or predictive oracle—combine with price structure, news awareness, and sizing rules for real edges.
Disclaimer
The content provided, including all code and materials, is strictly for educational and informational purposes only. It is not intended as, and should not be interpreted as, financial advice, a recommendation to buy or sell any financial instrument, or an offer of any financial product or service. All strategies, tools, and examples discussed are provided for illustrative purposes to demonstrate coding techniques and the functionality of Pine Script within a trading context.
Any results from strategies or tools provided are hypothetical, and past performance is not indicative of future results. Trading and investing involve high risk, including the potential loss of principal, and may not be suitable for all individuals. Before making any trading decisions, please consult with a qualified financial professional to understand the risks involved.
By using this script, you acknowledge and agree that any trading decisions are made solely at your discretion and risk.
Do not use this indicator on Heikin-Ashi, Renko, Kagi, Point-and-Figure, or Range charts, as these chart types can produce unrealistic results for signal markers and alerts.
Best regards and happy trading
Chervolino

Total Info Indicator by MikePenzin
Install & Add to Chart
• Copy the script into Pine Editor → click Add to Chart .
• Open the ⚙️ Settings → Inputs to customize.
What It Does
• Displays key info in a floating table — trend, volume, ATR, RSI, stop loss, and more.
• Detects breakouts , smart SELL signals , and opening strength .
• Uses emojis and colours to make trends easy to read: 🟢 good, 🟡 neutral, 🔴 risky.
For Swing Traders
• Works best on Daily or 4H charts.
• Watch for 🟢 Uptrend + ⚡BUY / 🔥BUY breakout signals.
• Use ATR-based Stop Loss (shown in table).
• Avoid new entries a few days before earnings.
Suggested Setup
• 20/50/150 MA Lines: ON
• 200 MA Line: optional
• ATR Multiplier: 1.3
• Breakout Detection: ON (Volume + RSI + Trend filters)
• Smart SELLs: ON (RSI 70, EMA 20)
• Pivots: ON for quick swing levels
How to Read
• MA Row: 🟢 = price above MA (bullish).
• ATR/Stop Loss: Suggests where to place protective stop.
• Volume Info: Today’s vs 20-day average, plus pace.
• RSI & CCI: Shows momentum and overbought/oversold levels.
• Breakouts: ⚡BUY (early), 🔥BUY (confirmed).
• Smart SELLs: RSI🔴 / DIV🟣 / EMA🔵 mean potential exit zones.
Example Use
1️⃣ Find stocks with Uptrend 🟢 , rising volume, and ⚡BUY signal.
2️⃣ Enter near breakout; set Stop = shown level.
3️⃣ Take profits or trail when Smart SELLs appear or RSI peaks.
Tips
• Choose table corner under “Table Visualization.”
• Reduce clutter on small timeframes (turn off Pivots/200 MA).
• Use “Volume speed” to spot surging interest before breakouts.
• Compatible with most equities and ETFs.
Disclaimer
This script is for education & analysis only .
Not financial advice — always manage your own risk.

Pivot Trend Flow [BigBeluga]🔵 OVERVIEW
Pivot Trend Flow turns raw swing points into a clean, adaptive trend band. It averages recent pivot highs and lows to form two dynamic reference levels; when price crosses above the averaged highs, trend flips bullish and a green band is drawn; when it crosses below the averaged lows, trend flips bearish and a red band is drawn. During an uptrend the script highlights breakouts of previous pivot highs with ▲ labels, and during a downtrend it flags breakdowns of previous pivot lows with ▼ labels—making structure shifts and continuation signals obvious.
🔵 CONCEPTS
Pivot-Based Averages : Recent pivot highs/lows are collected and averaged to create smoothed upper/lower reference levels.
if not na(ph)
phArray.push(ph)
if not na(pl)
plArray.push(pl)
if phArray.size() > avgWindow
upper := phArray.avg()
phArray.shift()
if plArray.size() > avgWindow
lower := plArray.avg()
plArray.shift()
Trend State via Crosses : Close above the averaged-highs ⇒ bullish trend; close below the averaged-lows ⇒ bearish trend.
Trend Band : A colored band (green/red) is plotted and optionally filled to visualize the active regime around price.
Structure Triggers :
In bull mode the tool watches for prior pivot-high breakouts (▲).
In bear mode it watches for prior pivot-low breakdowns (▼).
🔵 FEATURES
Adaptive Trend Detection from averaged pivot highs/lows.
Clear Visuals : Green band in uptrends, red band in downtrends; optional fill for quick read.
Breakout/Breakdown Labels :
▲ marks breaks of previous pivot highs in uptrends
▼ marks breaks of previous pivot lows in downtrends
Minimal Clutter : Uses compact lines and labels that extend only on confirmation.
Customizable Colors & Fill for trend states and band styling.
🔵 HOW TO USE
Pivot Length : Sets how swing points are detected. Smaller = more reactive; larger = smoother.
Avg Window (pivots) : How many recent pivot highs/lows are averaged. Increase to stabilize the band; decrease for agility.
Read the Band :
Green band active ⇒ prioritize longs, pullback buys toward the band.
Red band active ⇒ prioritize shorts, pullback sells toward the band.
Trade the Triggers :
In bull mode, ▲ on a prior pivot-high break can confirm continuation.
In bear mode, ▼ on a prior pivot-low break can confirm continuation.
Combine with Context : Use HTF trend, S/R, or volume for confluence and to filter signals.
Fill Color Toggle : Enable/disable band fill to match your chart style.
🔵 CONCLUSION
Pivot Trend Flow converts swing structure into an actionable, low-lag trend framework. By blending averaged pivots with clean breakout/breakdown labels, it clarifies trend direction, timing, and continuation spots—ideal as a core bias tool or a confirmation layer in any trading system.

Trend Fib Zone Bounce (TFZB) [KedArc Quant]Description:
Trend Fib Zone Bounce (TFZB) trades with the latest confirmed Supply/Demand zone using a single, configurable Fib pullback (0.3/0.5/0.6). Trade only in the direction of the most recent zone and use a single, configurable fib level for pullback entries.
• Detects market structure via confirmed swing highs/lows using a rolling window.
• Draws Supply/Demand zones (bearish/bullish rectangles) from the latest MSS (CHOCH or BOS) event.
• Computes intra zone Fib guide rails and keeps them extended in real time.
• Triggers BUY only inside bullish zones and SELL only inside bearish zones when price touches the selected fib and closes back beyond it (bounce confirmation).
• Optional labels print BULL/BEAR + fib next to the triangle markers.
What it does
Finds structure using confirmed swing highs/lows (you choose the confirmation length).
Builds the latest zone (bullish = demand, bearish = supply) after a CHOCH/BOS event.
Draws intra-zone “guide rails” (Fib lines) and extends them live.
Signals only with the trend of that zone:
BUY inside a bullish zone when price tags the selected Fib and closes back above it.
SELL inside a bearish zone when price tags the selected Fib and closes back below it.
Optional labels print BULL/BEAR + Fib next to triangles for quick context
Why this is different
Most “zone + fib + signal” tools bolt together several indicators, or fire counter-trend signals because they don’t fully respect structure. TFZB is intentionally minimal:
Single bias source: the latest confirmed zone defines direction; nothing else overrides it.
Single entry rule: one Fib bounce (0.3/0.5/0.6 selectable) inside that zone—no counter-trend trades by design.
Clean visuals: you can show only the most recent zone, clamp overlap, and keep just the rails that matter.
Deterministic & transparent: every plot/label comes from the code you see—no external series or hidden smoothing
How it helps traders
Cuts decision noise: you always know the bias and the only entry that matters right now.
Forces discipline: if price isn’t inside the active zone, you don’t trade.
Adapts to volatility: pick 0.3 in strong trends, 0.5 as the default, 0.6 in chop.
Non-repainting zones: swings are confirmed after Structure Length bars, then used to build zones that extend forward (they don’t “teleport” later)
How it works (details)
*Structure confirmation
A swing high/low is only confirmed after Structure Length bars have elapsed; the dot is plotted back on the original bar using offset. Expect a confirmation delay of about Structure Length × timeframe.
*Zone creation
After a CHOCH/BOS (momentum shift / break of prior swing), TFZB draws the new Supply/Demand zone from the swing anchors and sets it active.
*Fib guide rails
Inside the active zone TFZB projects up to five Fib lines (defaults: 0.3 / 0.5 / 0.7) and extends them as time passes.
*Entry logic (with-trend only)
BUY: bar’s low ≤ fib and close > fib inside a bullish zone.
SELL: bar’s high ≥ fib and close < fib inside a bearish zone.
*Optionally restrict to one signal per zone to avoid over-trading.
(Optional) Aggressive confirm-bar entry
When do the swing dots print?
* The code confirms a swing only after `structureLen` bars have elapsed since that candidate high/low.
* On a 5-min chart with `structureLen = 10`, that’s about 50 minutes later.
* When the swing confirms, the script plots the dot back on the original bar (via `offset = -structureLen`). So you *see* the dot on the old bar, but it only appears on the chart once the confirming bar arrives.
> Practical takeaway: expect swing markers to appear roughly `structureLen × timeframe` later. Zones and signals are built from those confirmed swings.
Best timeframe for this Indicator
Use the timeframe that matches your holding period and the noise level of the instrument:
* Intraday :
* 5m or 15m are the sweet spots.
* Suggested `structureLen`:
* 5m: 10–14 (confirmation delay \~50–70 min)
* 15m: 8–10 (confirmation delay \~2–2.5 hours)
* Keep Entry Fib at 0.5 to start; try 0.3 in strong trends, 0.6 in chop.
* Tip: avoid the first 10–15 minutes after the open; let the initial volatility set the early structure.
* Swing/overnight:
* 1h or 4h.
* `structureLen`:
* 1h: 6–10 (6–10 hours confirmation)
* 4h: 5–8 (20–32 hours confirmation)
* 1m scalping: not recommended here—the confirmation lag relative to the noise makes zones less reliable.
Inputs (all groups)
Structure
• Show Swing Points (structureTog)
o Plots small dots on the bar where a swing point is confirmed (offset back by Structure Length).
• Structure Length (structureLen)
o Lookback used to confirm swing highs/lows and determine local structure. Higher = fewer, stronger swings; lower = more reactive.
Zones
• Show Last (zoneDispNum)
o Maximum number of zones kept on the chart when Display All Zones is off.
• Display All Zones (dispAll)
o If on, ignores Show Last and keeps all zones/levels.
• Zone Display (zoneFilter): Bullish Only / Bearish Only / Both
o Filters which zone types are drawn and eligible for signals.
• Clean Up Level Overlap (noOverlap)
o Prevents fib lines from overlapping when a new zone starts near the previous one (clamps line start/end times for readability).
Fib Levels
Each row controls whether a fib is drawn and how it looks:
• Toggle (f1Tog…f5Tog): Show/hide a given fib line.
• Level (f1Lvl…f5Lvl): Numeric ratio in . Defaults active: 0.3, 0.5, 0.7 (0 and 1 off by default).
• Line Style (f1Style…f5Style): Solid / Dashed / Dotted.
• Bull/Bear Colors (f#BullColor, f#BearColor): Per-fib color in bullish vs bearish zones.
Style
• Structure Color: Dot color for confirmed swing points.
• Bullish Zone Color / Bearish Zone Color: Rectangle fills (transparent by default).
Signals
• Entry Fib for Signals (entryFibSel): Choose 0.3, 0.5 (default), or 0.6 as the trigger line.
• Show Buy/Sell Signals (showSignals): Toggles triangle markers on/off.
• One Signal Per Zone (oneSignalPerZone): If on, suppresses additional entries within the same zone after the first trigger.
• Show Signal Text Labels (Bull/Bear + Fib) (showSignalLabels): Adds a small label next to each triangle showing zone bias and the fib used (e.g., BULL 0.5 or BEAR 0.3).
How TFZB decides signals
With trend only:
• BUY
1. Latest active zone is bullish.
2. Current bar’s close is inside the zone (between top and bottom).
3. The bar’s low ≤ selected fib and it closes > selected fib (bounce).
• SELL
1. Latest active zone is bearish.
2. Current bar’s close is inside the zone.
3. The bar’s high ≥ selected fib and it closes < selected fib.
Markers & labels
• BUY: triangle up below the bar; optional label “BULL 0.x” above it.
• SELL: triangle down above the bar; optional label “BEAR 0.x” below it.
Right-Panel Swing Log (Table)
What it is
A compact, auto-updating log of the most recent Swing High/Low events, printed in the top-right of the chart.
It helps you see when a pivot formed, when it was confirmed, and at what price—so you know the earliest bar a zone-based signal could have appeared.
Columns
Type – Swing High or Swing Low.
Date – Calendar date of the swing bar (follows the chart’s timezone).
Swing @ – Time of the original swing bar (where the dot is drawn).
Confirm @ – Time of the bar that confirmed that swing (≈ Structure Length × timeframe after the swing). This is also the earliest moment a new zone/entry can be considered.
Price – The swing price (high for SH, low for SL).
Why it’s useful
Clarity on repaint/confirmation: shows the natural delay between a swing forming and being usable—no guessing.
Planning & journaling: quick reference of today’s pivots and prices for notes/backtesting.
Scanning intraday: glance to see if you already have a confirmed zone (and therefore valid fib-bounce entries), or if you’re still waiting.
Context for signals: if a fib-bounce triangle appears before the time listed in Confirm @, it’s not a valid trade (you were too early).
Settings (Inputs → Logging)
Log swing times / Show table – turn the table on/off.
Rows to keep – how many recent entries to display.
Show labels on swing bar – optional tags on the chart (“Swing High 11:45”, “Confirm SH 14:15”) that match the table.
Recommended defaults
• Structure Length: 10–20 for intraday; 20–40 for swing.
• Entry Fib for Signals: 0.5 to start; try 0.3 in stronger trends and 0.6 in choppier markets.
• One Signal Per Zone: ON (prevents over trading).
• Zone Display: Both.
• Fib Lines: Keep 0.3/0.5/0.7 on; turn on 0 and 1 only if you need anchors.
Alerts
Two alert conditions are available:
• BUY signal – fires when a with trend bullish bounce at the selected fib occurs inside a bullish zone.
• SELL signal – fires when a with trend bearish bounce at the selected fib occurs inside a bearish zone.
Create alerts from the chart’s Alerts panel and select the desired condition. Use Once Per Bar Close to avoid intrabar flicker.
Notes & tips
• Swing dots are confirmed only after Structure Length bars, so they plot back in time; zones built from these confirmed swings do not repaint (though they extend as new bars form).
• If you don’t see a BUY where you expect one, check: (1) Is the active zone bullish? (2) Did the candle’s low actually pierce the selected fib and close above it? (3) Is One Signal Per Zone suppressing a second entry?
• You can hide visual clutter by reducing Show Last to 1–3 while keeping Display All Zones off.
Glossary
• CHOCH (Change of Character): A shift where price breaks beyond the last opposite swing while local momentum flips.
• BOS (Break of Structure): A cleaner break beyond the prior swing level in the current momentum direction.
• MSS: Either CHOCH or BOS – any event that spawns a new zone.
Extension ideas (optional)
• Add fib extensions (1.272 / 1.618) for target lines.
• Zone quality score using ATR normalization to filter weak impulses.
• HTF filter to only accept zones aligned with a higher timeframe trend.
⚠️ Disclaimer This script is provided for educational purposes only.
Past performance does not guarantee future results.
Trading involves risk, and users should exercise caution and use proper risk management when applying this strategy.

Pro BTB Pour Samadi Indicator [TradingFinder] Back To Breakeven🔵 Introduction
The Pro BTB (Professional Back To Breakeven) strategy is one of the most advanced price action setups, designed and taught by Mohammad Ali Poursamadi, an international Iranian trader and a well-known instructor of financial market analysis.
The main logic of this strategy is based on the natural behavior of the market :
Breakout of a key level: Price moves beyond an important support or resistance.
Retest / Back To Breakeven: Price returns to the broken level.
Continuation of the main trend: Entry at this point allows alignment with the dominant market direction.
To better understand Pro BTB, it is necessary to first know the concept of a Spike. A spike refers to a sudden and powerful movement of price in one direction, usually caused by heavy order flow. Such a move creates an Imbalance between buyers and sellers. Because the market does not have enough time to distribute orders fairly, it leaves an Inefficiency on the chart.
The direct result of this process is the formation of a Fair Value Gap (FVG) a gap between candles that shows trades were not distributed evenly. In simple terms: the spike is the cause, and Imbalance, Inefficiency, and FVG are its consequences.
In practice, Pro BTB works effectively in both bullish and bearish structures. In a Bullish Setup, a bullish spike first breaks a resistance level. Then, when price returns to that same level, a safe and low-risk buying opportunity is created. Conversely, in a Bearish Setup, a bearish spike breaks a support level, and when price comes back to the broken level, it provides the best conditions for a short entry. These two examples illustrate how Pro BTB logic provides precise, low-risk entries in both directions of the market.
🔵 How to Use
The Pro BTB (Back To Breakeven) strategy allows traders to enter precisely after price returns to the breakout level; this way the entry aligns with the natural market flow while risk is minimized. In practice, this method is simple yet powerful: first, identify a valid breakout on a key level, then wait for price to return to that level, and finally, take the entry in the direction of the main trend.
🟣 Bullish Setup
When a bullish spike occurs and a key resistance is broken, price usually returns to the same level. This level, now acting as support, provides the best opportunity for a long entry. In this scenario, the stop-loss is placed behind the breakout candle or slightly below the broken level, and the take-profit target should be defined with at least a 1:2 risk-to-reward ratio. With strong momentum, higher targets can also be considered.
🟣 Bearish Setup
In a bearish scenario, a bearish spike breaks a key support. After the breakout, price usually returns to the same level, which now acts as resistance. This creates the best conditions for a short entry. The stop-loss is placed behind the breakout candle or slightly above the broken level, while the take-profit target is set with a risk-to-reward ratio greater than 1:2.
🟣 General Rules of Pro BTB
To apply Pro BTB correctly, several key rules must be followed :
The breakout must be valid and occur on a key level.
Always wait for the retest; do not enter immediately after the breakout.
Entry should only happen when price touches the broken level and shows candlestick confirmation.
The stop-loss (SL) must be placed behind the breakout candle or the broken level.
The take-profit (TP) must always be at least twice the trade risk.
For higher reliability, the breakout should align with the trend on higher timeframes.
🟣 Six Entry Methods in Pro BTB
For greater flexibility, Pro BTB offers six standard entry methods :
Market Entry : Enter immediately at the breakout level.
Limit Order : Place a limit order on the breakout level.
Stop Order : Enter only after confirmation of continuation.
Confirmation Candle : Enter after a confirmation candle closes on the level.
Pattern Entry : Enter based on candlestick patterns such as Pin Bar or Engulfing.
Zone Entry : Enter from a zone instead of an exact point to account for market noise.
🔵 Setting
🟣 Spike Filter | Movement
Minimum Spike Bars : Defines the minimum number of consecutive candles required for a valid spike.
Movement Power : Enables or disables the momentum-based spike filter.
Movement Power Level : Sets the strength threshold; higher values filter out weaker moves and only detect strong spikes.
🟣 Spike Filter | Gap
Gap Filter : Enables or disables the gap filter.
Gap Type : Selects which type of gap should be detected (All Gaps, Significant, Structural, Major).
🟣 Spike Filter | Doji
Doji Tolerance : Defines whether doji candles are allowed within a spike.
Max Doji Body Ratio : Maximum ratio of body-to-total candle size for classifying a candle as a doji.
Max Doji in Spike Ratio : Maximum percentage of doji candles allowed within a spike.
🟣 Position Management
Stop-Loss Threshold : Enables or disables the stop-loss threshold feature.
Stop-Loss Threshold Value : Defines the value of the stop-loss threshold for risk management.
Risk-Reward Ratio : Sets the desired risk-to-reward ratio (e.g., 1:1 or 1:2).
Include SL Threshold in R:R : Determines whether the stop-loss threshold is included in risk-to-reward calculations.
🟣 Display Settings
Display Mode : Chooses between Setup (showing setups) or Signal (showing trade signals).
Show Entry Levels: Displays entry levels on the chart (buy/sell zones) when enabled
Only Display the Last Position : Displays only the most recent position on the chart when enabled.
Setup Width Drawing : Adjusts the visual width of the setup drawings on the chart for better visibility.
🟣 Alert
Alert : Enables alert notifications. When turned on, you can set TradingView alerts to receive notifications once the setup or signal conditions are met
🔵 Conclusion
The Pro BTB (Back To Breakeven) strategy is a smart and structured entry method based on natural market behavior after a breakout and retest of the broken level. It helps traders avoid emotional, high-risk entries by waiting for market confirmation and entering precisely at a point that aligns with the main trend and sits closest to the key level.
The simplicity of its rules, flexibility in entry methods, and a risk-to-reward ratio above 2 have made Pro BTB one of the most popular tools among price action traders. Nevertheless, as with any strategy, it is recommended to practice it in demo accounts or through personal backtesting before applying it to real trading, in order to find the entry conditions that best suit your trading style.
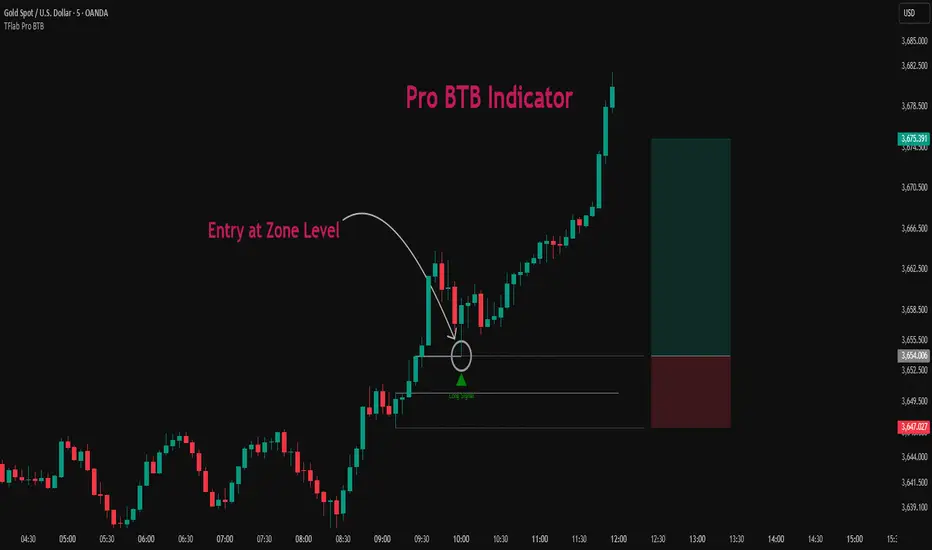
TF Sys-1Richard Dennis (Prince of the Pit) invested 1,600 dollar and reportedly made 350 Million dollars (within 10 years). The key is that, fortunes are caught by catching the big moves and catching them before they are plainly visible to the crowd.
This Trend Following Indicator combine both Trend Following Calculation and Stage Analysis to provide the clarity of trend direction and the complete plan how to trade by risking only 2%. It provides the position sizing, breakout location, stop loss and Pyramiding strategy (Conservative or Aggressive). I will provide a complete guide how to utilize the indicator and trend following Philosophy in my store in Whop.
Next time, when someone recommend any ticker you will see in which stage the ticker is and the breakout point. This indicator will not provide financial advice, it is a tool for decision making and your partner to achieve your goal (to be a successful trend following trader) where fortune lays.

Stacey Burke Signal Day LTE“Previously published as ‘Day Zero Fakeout Detector MTF’”
Stacey Burke Signal Day LTE
Automatic detection of Day Zero, Inside Days, and Outside Days for Stacey Burke’s intraday playbook
🔎 Stacey Burke’s Signal Days
This indicator highlights the key daily patterns that often lead to high-probability intraday setups in Stacey Burke’s methodology:
1️⃣ Day Zero
The reset days within a 3-day cycle (e.g. breakout → continuation → exhaustion/reversal).
Can mark the beginning of a new directional phase.
Trades back inside the prior range after a Peak Formation High (PFH) or Peak Formation Low (PFL).
Bias: Look for measured parabolic session moves. When combined with trend following indicators, these signal days can be very powerful.
2️⃣ Inside Day
A day where the entire range is contained within the prior day’s range.
Signals consolidation and energy build-up.
Often leads to explosive breakouts in the next session.
Bias: Trade breakouts of the inside day’s high/low or breakout reversal in the session at key timings in the direction of higher timeframe bias. When combined with trend following indicators, these signal days can be very powerful.
3️⃣ Outside Day (Engulfing Day)
`
A day where the range is larger than the prior day’s range, engulfing both high and low.
Marks trapped traders and fakeouts on both sides.
Often precedes strong continuations or sharp reversals from outside of the ranges.
Bias: Align trades with the true continuation move. When combined with trend following indicators, these signal days can be very powerful.
📌 How They Work Together
Day Zero → Signals the new cycle after PFH/PFL.
Inside Day → Signals compression → expect breakout setups.
Outside Day → Signals exhaustion/fakeouts → expect reversals or continuations.
Together, they give traders a clear daily roadmap for where liquidity sits and when to expect the highest-probability setups.
✅ Example in Practice
Market rallies for 3 days → PFH forms → Day Zero short bias.
Next day prints an Inside Day → watch for breakout continuation short, and breakout reversals.
Later, an Outside Day traps both longs and shorts → the following session offers a clean intraday reversal or continuation trade in line with the underlying MTF trend/bias.
⚙️ Features of This Indicator
Automatic detection of Day Zero, Inside Days, and Outside Days
Multi-Timeframe (MTF) support for cycle alignment
Visual markers for PFH/PFL and consolidation zones
Measured move projections for breakout targets
👉 Stacey Burke Signal Day LTE gives traders just a few of the most important signal days — Day Zero, Inside Day, and Outside Day — to structure their intraday trades around fake outs, breakouts, and reversals within the daily cycles of the week. (This is work in progress: Next up, FRD/FGD's, 3-day cycle detecting, 3DLs, 3DSs).

Sentinel 5 — OHL daybreak signals [KedArc Quant]Overview
Sentinel 5 plots the first-bar high/low of each trading session and gives clean, rules-based signals in two ways:
1) OHL Setups at the close of the first bar (Open equals/near High for potential short; Open equals/near Low for potential long).
2) Breakout Signals later in the session when price breaks the first-bar High/Low, with optional body/penetration filters.
Basic workflow
1. Wait for the first session bar to finish.
*If O≈H (optionally by proximity) → short setup. •
*If O≈L → long setup. • If neither happens, optionally allow later breakouts.
2. Optional: Act only on breakouts that penetrate a minimum % of that bar’s range/body.
3. Skip the day automatically if the first bar is abnormally large (marubozu-like / extreme ATR / outsized vs yesterday).
Signals & Markers
Markers on the chart:
▲ O=L (exact) / O near L (proximity) – long setup at first-bar close.
▼ O=H (exact) / O near H (proximity) – short setup at first-bar close.
▲ Breakout Long – later bar breaks above first-bar High meeting your penetration rule.
▼ Breakout Short – later bar breaks below first-bar Low meeting your penetration rule.

Peak Reversal v3# Peak Reversal v3
## Summary
Peak Reversal v3 adds new configurability, clearer visuals, and a faster trader workflow. The release introduces a new Squeeze Detector , expanded Keltner Channels , and streamlined Momentum signals , with no repaints and improved performance. The menus have been reorganized and simplified. Color swatches have been added for better customization. All other colors will be derived from these swatches.
## Highlights
New Squeeze Detector to mark low-volatility periods and prepare for breakouts.
New: Bands are now fully configurable with independent MA length, ATR length, and multipliers.
Five moving average bases for bands: EMA (from v2), SMA, RMA, VMA, HMA.
Simplified color system: three swatches drive candles, on-chart marks, and band fill.
Reorganized menu with focused sections and tooltips for each parameter making the entire trader experience more intuitive.
No repaints and faster performance across calculations.
## Overview
Configuration : Pick from three color swatches and apply them to candles, plotted characters, and band fill for consistent chart context. Use the reorganized menu to reach Keltner settings, momentum signals, and squeeze detection without extra clicks; tooltips clarify each input.
Bands and averages: Choose the band basis from EMA, SMA, RMA, VMA, or HMA to match your strategy. Configure two bands independently by setting MA length, ATR length, and band multipliers for the inner and outer envelopes.
Signals : Select the band responsible for momentum signals. Choose wick or close as the price source for entries and exits. Control the window for extreme momentum with “Max Momentum Bars,” a setting now exposed in v3 for direct tuning.
Squeeze detection : The Squeeze Detector normalizes band width and uses percentile ranking to highlight volatility compression. When the market falls below a user-defined threshold, the indicator colors the region with a gradient to signal potential expansion.
## Details about major features and changes
### New
Squeeze Detector to highlight low-volatility conditions.
Five MA bases for bands: EMA, SMA, RMA, VMA, HMA.
“Max Momentum Bars” to cap the bars used for extreme momentum.
### Keltner channel improvements
Refactored Keltner settings for flexible inner and outer band control.
MA type selection added; band calculations updated for consistency.
Removed the third Keltner band to reduce noise and simplify setup.
### Display and signals
Gradient fills for band breakouts, mean deviations, and squeeze periods.
“Show Mean EMA?” set to true and default “Signal Band” set to “Inner.”
Clearer tooltips and input descriptions.
### Reliability and performance
No more repaints. The indicator waits for confirmation before drawing occurs.
Faster execution through targeted refactors.
All algorithms have been reviewed and now use a consistent logic, naming, and structure.

ORB Breakouts with alerts"ORB Breakouts with Alerts" is a utility indicator that highlights an Opening Range Breakout (ORB) setup during a user-defined intraday time window. It allows traders to visualize price consolidation ranges and receive alerts when price breaks above or below the session high/low.
🔧 Features:
*Customizable session time (start and end), adjustable to local time using a timezone offset.
*Automatically plots:
*A shaded box around the session's high and low.
*Horizontal lines at session high and low levels.
*Optional "BUY"/"SELL" labels to mark breakout directions.
*Visual breakout signals when price crosses above or below the session range.
*Built-in alerts to notify when breakouts occur.
*Configurable styling options including box color, highlight color, and label placement.
⚙️ How It Works:
*During the defined time range, the script tracks the highest high and lowest low.
*After the session ends:
*A box is drawn to represent the opening range.
*Breakouts above the high or below the low trigger visual markers and optional alerts.
*Alerts are limited to one per direction per day to reduce noise.
⚠️ This indicator is a technical analysis tool only and does not provide financial advice or trade recommendations. Always use with proper risk management and in conjunction with your trading plan.

Key Daily LevelsKey Daily Levels Indicator
This lightweight indicator is designed to automatically plot the most essential price levels for intraday traders, helping you visualize key areas of support and resistance without cluttering your chart.
Features:
Opening Range (ORB) : Calculates and displays the high and low of a user-defined opening period (e.g., the first 30 minutes). The levels appear only after the range is established.
Pre-Market High & Low : Identifies the highest and lowest prices from the pre-market session and draws a line segment for each level from the 9:30 AM open until 11:00 AM. These lines remain visible for the rest of the day for reference.
Previous Day's High & Low (PDH/PDL) : Plots the prior day's final high and low, which are critical reference points for the current session.
Current Day's High & Low (CDH/CDL) : Tracks and plots the current session's high and low in real-time.
Customization : All levels can be toggled on or off. Optional text labels are available to clearly identify each line on the chart.
Intraday Focus : The indicator is automatically enabled on intraday timeframes and disabled by default on daily or higher charts to ensure a clean workspace.
