SmartPlusSmartPlus
Overview
The SmartPlus indicator is a complete framework for intraday traders. It combines key market reference points (VWAP, moving averages, and the first 15-minute high/low range) with predictive levels based on historical daily moves. Together, these elements allow traders to build directional bias, spot breakouts, and manage risk throughout the session.
Key Features
1. VWAP (Volume-Weighted Average Price)
- Plots the intraday VWAP in real time.
- VWAP acts as a central “fair value” reference point for institutional order flow.
- Price trading above VWAP generally suggests bullish bias, while below VWAP leans bearish.
2. Exponential Moving Averages (EMAs)
- Two configurable EMAs are included:
- Fast EMA (default: 21 periods)
- Slow EMA (default: 34 periods)
- Each EMA is plotted with a single, user-selectable color for clarity.
- Crossovers or alignment between price, VWAP, and EMAs help define market structure.
3. Smart Bar Coloring
- Candles automatically change color when conditions align:
- Bull Zone: Price above VWAP, Fast EMA, and Slow EMA.
- Bear Zone: Price below VWAP, Fast EMA, and Slow EMA.
- Fluorescent bar coloring helps highlight momentum zones visually without additional analysis.
4. First 15-Minute High/Low/Mid (Automatic)
- Automatically detects the first 15 minutes of each new trading day (no manual input required).
- Plots horizontal lines for:
- First 15-Minute High (green)
- First 15-Minute Low (red)
- Midpoint of that range (gray)
- Once the initial 15-minute window ends, these levels remain projected throughout the session as breakout or support/resistance zones.
- Alerts trigger when price breaks above the high or below the low after the window.
5. Daily Support/Resistance Forecast
- Uses a rolling lookback of recent daily ranges (default: 126 days).
- Tracks average up moves and down moves from the daily open.
- Optionally incorporates standard deviation for wider confidence bands.
- Plots forecast levels above/below the current day’s open for reference.
Trading Logic (How to Use)
- Bullish Bias:
- Price is above VWAP, above both EMAs, and ideally above the first 15-minute high.
- This setup suggests trend continuation or breakout opportunities on the long side.
- Bearish Bias:
- Price is below VWAP, below both EMAs, and ideally below the first 15-minute low.
- This setup suggests downward pressure or breakout opportunities on the short side.
- Neutral / Caution Zone:
- Price caught between VWAP, EMAs, or inside the 15-minute range often signals indecision.
- Best to wait for confirmation or breakout before committing to trades.
Expectations After Using It
- The script provides context and structure, not trading signals.
- It highlights where price is relative to meaningful market levels so traders can act with greater confidence.
- Combining VWAP, EMAs, and the 15-minute breakout framework helps traders stay aligned with the market’s natural rhythm.
Disclaimer
This script is a tool for market analysis and educational purposes only.
It does not constitute financial advice, trading recommendations, or guaranteed profitability.
Markets are inherently risky, and past patterns do not ensure future results.
Always combine this tool with sound risk management, personal research, and professional guidance before making any trading decisions.
Breakouts

SONIC R BREAK FINAL (VER5)
Purpose: Capture breakouts through Support/Resistance (S/R) zones based on Pivot and filter signals using EMA 34 (High/Low/Close), EMA 89, volume, and candle structure. Includes a Higher Timeframe (H4) RSI risk warning (visual only, does not block entries).
How it works
S/R zones from Pivot
Draws Resistance and Support using ta.pivothigh/ta.pivotlow with Left/Right Bars.
S/R lines are locked with offset to reduce repaint.
EMA trend filters
EMA34 High/Low/Close build a “EMA 34 band”.
EMA89 works as the main trend filter.
Trend conditions:
Long: close above all EMA34 High/Low/Close and EMA89.
Short: close below all EMA34 High/Low/Close and EMA89.
Volume filter (optional)
Signal valid only if Volume > SMA(Volume, n).
Wick filter
Each wick (upper/lower) ≤ 50% of candle range to avoid weak breakouts.
Higher TF RSI risk (H4)
Fetches RSI from a higher timeframe (default H4).
If RSI exceeds threshold, breakout labels turn gray (risk warning only).
Anti-repeat mechanism
Each new pivot resets trigger.
Each S/R level triggers only once until the next pivot is formed.
Signals & Alerts
Label “B” (green) below candle: breakout above Resistance, valid EMA/Volume/Wick conditions.
Label “S” (red) above candle: breakout below Support, valid EMA/Volume/Wick conditions.
Gray labels = H4 RSI risk warning.
Unified alert: “S/R Breakout (Unified)” with message B=Buy, S=Sell, Gray=Risk.
Parameters
Show Breaks: toggle breakout detection.
Left/Right Bars: pivot sensitivity.
Require Volume > Average + Volume MA Length: volume filter.
Use H4 RSI Risk Warning: enable higher TF RSI check.
RSI Length, Higher TF (minutes), RSI thresholds for Buy/Sell risk.
Usage tips
Prioritize trades in the same direction as EMA89 and EMA34 trend.
Works on M5 to H4; best combined with RSI H4 when trading M15/M30.
Place SL behind the S/R just broken, TP by fixed RR or EMA trailing.
Increase Left/Right Bars for stronger zones and less noise in sideways markets.
Notes
Pivot still has repaint element (mitigated by offset).
This indicator is not financial advice. Always combine with proper risk management.
Version
Clean v4: added wick ≤50% filter, H4 RSI risk coloring, volume filter, anti-repeat pivot trigger, unified alert, EMA34 H/L/C background shading.
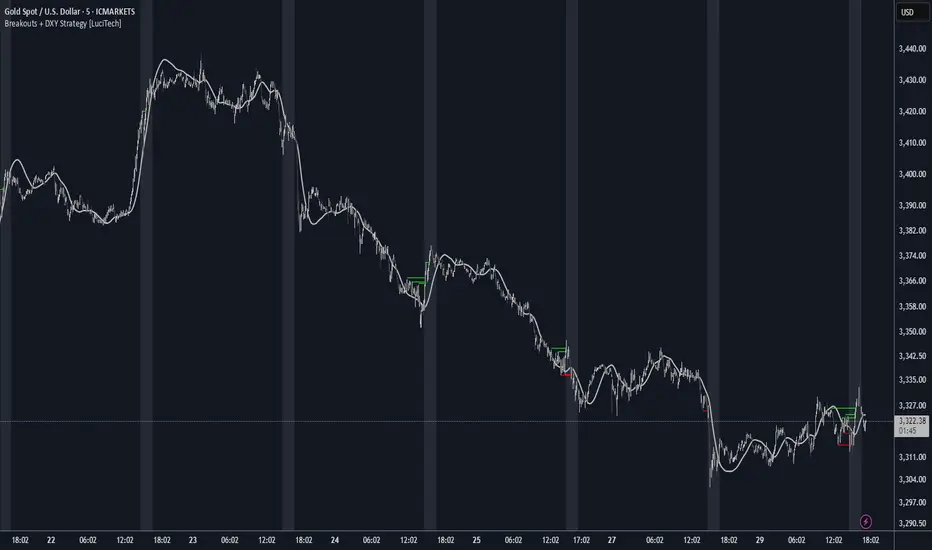
Breakouts With DXY Filter Strategy [LuciTech]This advanced breakout strategy combines pivot-based breakout detection with an innovative DXY (US Dollar Index) inverse correlation filter to enhance trade selection quality. The strategy identifies breakouts from recent pivot highs and lows while using DXY movements as a confirmation filter, based on the principle that USD strength/weakness often inversely correlates with other asset movements.
Key Features
Core Breakout Logic
- Pivot-Based Detection: Identifies breakouts above recent pivot highs (bullish) and below recent pivot lows (bearish)
- Customizable Lookback: Adjustable pivot length for different market conditions
- Visual Breakout Lines: Optional display of breakout levels with customizable colors
DXY Inverse Correlation Filter
- Smart USD Filter: Uses DXY movements to confirm breakout signals
- Inverse Logic: Long signals require DXY bearishness, short signals require DXY bullishness
- Threshold Control: Minimum DXY movement percentage required for signal confirmation
- Real-time DXY Data: Pulls live DXY data for accurate correlation analysis
Moving Average Filter
- Multiple MA Types: Support for SMA, EMA, WMA, VWMA, and HMA
- Trend Confirmation: Only takes trades in the direction of the selected moving average
- Customizable Parameters: Adjustable length and source for the moving average
Advanced Risk Management
- Multiple Stop Loss Types:
- ATR-based stops with customizable multiplier
- Candle-based stops using previous candle levels
- Fixed point-based stops
- Risk-Reward Optimization: Configurable risk-reward ratios (1:1 to 1:10)
- Breakeven Function: Automatic stop loss adjustment to breakeven after specified R-multiple
- Position Sizing: Percentage-based risk management with automatic position calculation
Time-Based Trading
- Session Filter: Trade only during specified time windows
- London Time Zone: Uses Europe/London timezone for consistency
- Visual Session Highlighting: Optional background fill for active trading hours
Alert System
- Webhook Integration: JSON-formatted alerts for automated trading
- Telegram Support: Pre-formatted messages for Telegram bot integration
- Multiple Formats: Standard, Telegram, and Concise Telegram alert options
- Real-time Notifications: Instant alerts on breakout signals
How It Works
1. Breakout Detection: The script continuously monitors for closes above recent pivot highs or below recent pivot lows
2. DXY Confirmation: When a breakout occurs, the script checks if DXY is moving in the opposite direction with sufficient momentum
3. MA Filter: If enabled, ensures the breakout aligns with the overall trend direction
4. Time Filter: Validates that the signal occurs within the specified trading hours
5. Risk Calculation: Automatically calculates position size based on the defined risk percentage and stop loss distance
6. Trade Execution: Places trades with predetermined stop loss and take profit levels
Unique Advantages
- Multi-Timeframe Approach: Combines asset-specific breakouts with broader USD market sentiment
- False Breakout Reduction: DXY filter helps eliminate breakouts that lack fundamental backing
- Comprehensive Risk Management: Multiple stop loss methods and automatic position sizing
- High Customization: Extensive parameters for different trading styles and market conditions
- Professional Alert System: Ready for automated trading integration
High Volume Buyers/Sellers+High Volume Buyers/Sellers+
This indicator helps traders spot bars where unusually high or extreme volume occurs, indicating strong buying or selling pressure.
How it works:
Calculates a volume moving average (SMA) over a user-defined period.
Marks bars where the current volume exceeds:
High Volume Multiplier → small green circle (bullish) or red circle (bearish).
Extreme Volume Multiplier → small green up-triangle (bullish) or red down-triangle (bearish).
Settings:
Volume MA Period → Number of bars used to calculate the average volume.
High Volume Multiplier → Threshold to define high volume.
Extreme Volume Multiplier → Threshold to define extreme volume.
Show Extreme Volume Signals → Option to enable or disable extreme volume markers.
Usage tips:
Apply this indicator on a clean chart to visually highlight momentum bursts or exhaustion points.
It works well for both intraday and swing trading strategies where volume confirmation matters.
⚠ Note: This script only displays on-chart markers and does not plot any lines or indicators.

Adaptive Squeeze Momentum +Adaptive Squeeze Momentum+ (Auto-Timeframe Version)
Overview
Adaptive Squeeze Momentum+ is an enhanced volatility and momentum indicator designed to identify compression and expansion phases in price action. It is inspired by the classic Squeeze Momentum Indicator by LazyBear but introduces automatic parameter adaptation to any timeframe, making it simpler to use across different markets without manual configuration.
Concepts and Methodology
The script combines Bollinger Bands (BB) and Keltner Channels (KC) to detect periods when volatility contracts (squeeze) or expands (release).
A squeeze occurs when BB are inside KC, suggesting low volatility and potential breakout scenarios.
A squeeze release is detected when BB expand outside KC.
Momentum is derived using a linear regression applied to the difference between price and a midrange reference level.
Original Improvements
Compared to the original Squeeze Momentum Indicator, this version offers several enhancements:
Automatic Adaptation: BB and KC lengths and multipliers are dynamically adjusted based on the chart’s timeframe (from 1 minute up to 1 month), removing the need for manual tuning.
Simplified Visualization: A clean, minimalist histogram and clear squeeze state cross markers allow for faster interpretation.
Flexible Application: Designed to work consistently on intraday, daily, and higher timeframes across crypto, forex, stocks, and indices.
Features
Dynamic Squeeze Detection:
Gray Cross: Neutral (no squeeze detected)
Blue Cross: Active squeeze
Yellow Cross: Squeeze released
Momentum Histogram:
Positive/negative momentum shown with slope-based coloring.
Timeframe-Aware Parameters:
Automatically sets optimal BB/KC configurations.
Usage
Watch for blue crosses indicating an active squeeze phase that may precede a directional move.
Use the histogram color and slope to gauge momentum strength and direction.
Combine squeeze release signals with momentum confirmation for potential entries or exits.
Credits and Licensing
This script was inspired by LazyBear’s OLD “Squeeze Momentum Indicator” (). The implementation here significantly expands upon the original by introducing auto-adaptive parameters, restructured logic, and a new visualization approach. Published under the Mozilla Public License 2.0.
Disclaimer
This indicator is for educational purposes only and does not constitute financial advice. Use at your own risk.

IL - Inside Bar Detector - v01Indicator: IL - Inside Bar Detector - v01
Product: An Indigo Lynx Indicator
Copyright: © Indigo Lynx, v01, 2025-07-04
Description:
This indicator identifies Inside Bar candlestick patterns, which can signal
consolidation or indecision in the market, often preceding breakouts.
It offers multiple definitions for what constitutes an Inside Bar, an
optional volume filter, and differentiates markers and display for
bullish or bearish closing inside bars.
Features:
- Detects Inside Bar patterns.
- Configurable Inside Bar Definitions (via "Inside Bar Definition" input):
1. "Body (O/C)": Current O/C body within previous O/C body.
2. "Range (H/L - Standard)": Current H/L within previous H/L.
3. "Super (Range & Body)": Requires BOTH conditions.
- Optional Volume Filter: Inside Bar volume < SMA of volume.
- Display Toggles: Separate options to show/hide Bullish closing IBs
and Bearish closing IBs.
- Customizable Visuals: Bar color and optional plotshape markers (differentiated
for bullish/bearish closing inside bars using "BI" and "BRI" text).
- Data Logging: Option to log detected pattern details.
How to Use & Interpret:
- Configure definition, volume filter, and display options.
- Inside Bars are highlighted by bar color if their type (bullish/bearish closing) is enabled.
- Optional shapes: Green up-triangle (BI) for bullish-closing Inside Bars,
Red down-triangle (BRI) for bearish-closing Inside Bars, if enabled.
- Use with other analysis methods for confirmation.
Disclaimer: Trading involves substantial risk of loss and is not suitable for all investors.
Past performance is not indicative of future results.

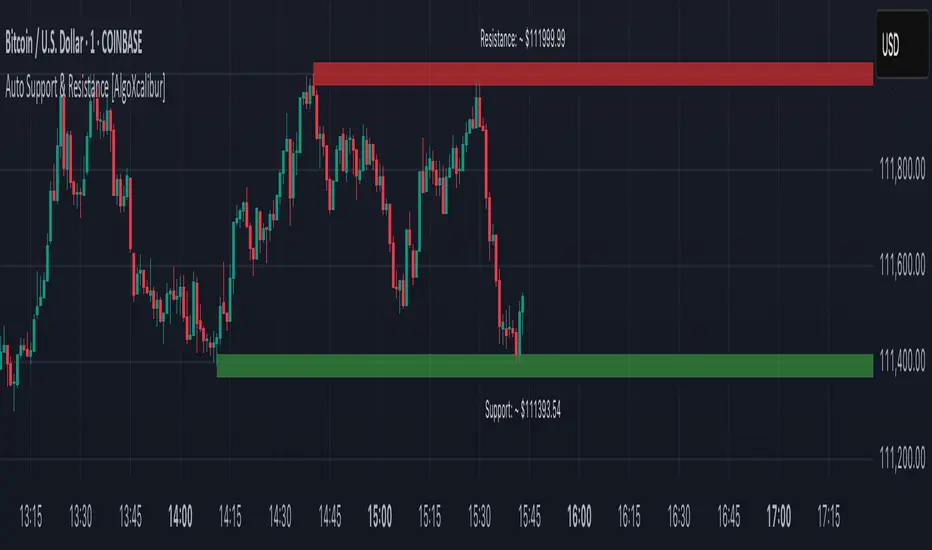
Auto Support & Resistance [AlgoXcalibur]Instantly visualize support and resistance levels with adaptive breakout prediction and zero chart clutter.
Combining reliable pivot level detection, relative volume, and price action confirmation, this tool delivers intelligent S/R zones that adapt to current market conditions. Whether you’re trading breakouts, navigating ranges, or using key levels to manage profits and risk — this indicator automatically identifies important levels for you, reducing your workload so you can better focus on your trades and decision-making.
🧠 Algorithm Logic
This ultra-refined Auto Support & Resistance indicator does more than just display reliable support and resistance levels — it applies a minimalist approach to display only the most relevant and actionable zones, while dynamically tracking their structural integrity in real time. The algorithm features unique Breakout Probability Detection — automatically switching lines from solid to dashed when volume and price action suggest a high probability that a breakout will occur. If a level is broken, the next relevant support or resistance level is immediately displayed on the chart, keeping the levels current and actionable so you do not miss critical insight. Optional Price Labels display the price of each level — practical if using these areas for setting take-profits or stop-losses. This algorithm keeps Support & Resistance what they are supposed to be — simple and useful — effortlessly providing a clean, adaptive view of evolving market structure.
⚙️ User-Selectable Features
• Breakout Probability Detection: When enabled, lines automatically switch from solid to dashed when volume and price action suggest a high breakout probability.
• Price Labels: When enabled, price labels display the price of the S/R for practical reference.
📊 Minimalistic Sophistication
Most automated support and resistance tools clutter the chart with dozens of static levels that do not react to price action. This tool displays only the single most relevant support and resistance level at a time, continuously monitoring for breaks and automatically updating when a level is invalidated. With breakout detection built in, it offers a modern, intuitive way to track structural integrity. This tool is designed to prioritize accuracy, adaptability, and visual simplicity — delivering a smart and refined tool for automatically identifying key levels with confidence.
🔐 To get access or learn more, visit the Author’s Instructions section.
Live Breakout Zones (No Repaint)The Live Breakout Zones indicator is a non-repainting, real-time breakout detection tool designed to help traders identify critical price breakouts as they happen — without lag and without repainting past signals.
This indicator scans recent price action to determine the highest high and lowest low over a user-defined lookback period. When price closes above the recent high or below the recent low, it immediately plots a breakout zone on the chart and provides a visual confirmation through labels and optional alerts.
🔍 Key Features:
✅ No Repainting – Signals are locked in as soon as a breakout happens; no future bar confirmation is needed.
⏱️ Minimal Lag – Reacts on breakout of recent range highs/lows without waiting for pivots or candle confirmation.
📦 Breakout Zones – Automatically draws colored rectangles showing the breakout level and zone width for clearer analysis.
🔔 Real-Time Alerts – Alerts for both bullish and bearish breakouts help you stay informed without watching the screen.
⚙️ Customizable – Adjustable lookback length, zone width, and color settings to match your strategy or chart style.
📈 Use Cases:
Identify key breakout moments for entry or retest zones.
Confirm breakout-based strategies in trending or consolidating markets.
Use zones for setting risk-reward areas, SL/TP levels, or re-entry planning.
⚙️ Settings:
Lookback Range (High/Low): Defines how many previous bars are checked for breakout levels.
Zone Width: Number of bars to extend the breakout box forward.
Bullish/Bearish Zone Color: Choose custom colors for breakout visualization.
🧠 Trading Tip:
Combine this tool with volume spikes, tail candles, or support/resistance for more reliable breakout setups.

Disparity Index with Volatility ZonesDisparity Index with Volatility Zones
is a momentum oscillator that measures the percentage difference between the current price and its simple moving average (SMA). This allows traders to identify overbought/oversold conditions, assess momentum strength, and detect potential trend reversals or continuations.
🔍 Core Concept:
The Disparity Index (DI) is calculated as:
DI = 100 × (Price − SMA) / SMA
A positive DI indicates the price is trading above its moving average (potential bullish sentiment), while a negative DI suggests the price is below the average (potential bearish sentiment).
This version of the Disparity Index introduces a dual-zone volatility framework, offering deeper insight into the market's current state.
🧠 What Makes This Version Unique?
1. High Volatility Zones
When DI crosses above +1.0% or below –1.0%, it often indicates the start or continuation of a strong trend.
Sustained readings beyond these thresholds typically align with trending phases, offering opportunities for momentum-based entries.
A reversal back within ±1.0% after exceeding these levels can suggest a shift in momentum — similar to how RSI exits the overbought/oversold zones before reversals.
These thresholds act as dynamic markers for breakout confirmation and potential trend exhaustion.
2. Low Volatility Zones
DI values between –0.5% and +0.5% define the low-volatility zone, shaded for visual clarity.
This area typically indicates market indecision, sideways price action, or consolidation.
Trading within this range may favor range-bound or mean-reversion strategies, as trend momentum is likely limited.
The logic is similar to interpreting a flat ADX, tight Bollinger Bands, or contracting Keltner Channels — all suggesting consolidation.
⚙️ Features:
Customizable moving average length and input source
Adjustable thresholds for overbought/oversold and low-volatility zones
Optional visual fill between low-volatility bounds
Clean and minimal chart footprint (non-essential plots hidden by default)
📈 How to Use:
1. Trend Confirmation:
A break above +1.0% can be used as a bullish continuation signal.
A break below –1.0% may confirm bearish strength.
Long periods above/below these thresholds support trend-following entries.
2. Reversal Detection:
If DI returns below +1.0% after exceeding it, bullish momentum may be fading.
If DI rises above –1.0% after falling below, bearish pressure may be weakening.
These shifts resemble overbought/oversold transitions in oscillators like RSI or Stochastic, and can be paired with divergence, volume, or price structure analysis for higher reliability.
3. Sideways Market Detection:
DI values within ±0.5% indicate low volatility or a non-trending environment.
Traders may avoid breakout entries during these periods or apply range-trading tactics instead.
Observing transitions out of the low-volatility zone can help anticipate breakouts.
4. Combine with Other Indicators:
DI signals can be enhanced using tools like MACD, Volume Oscillators, or Moving Averages.
For example, a DI breakout beyond ±1.0% supported by a MACD crossover or volume spike can help validate trend initiation.
This indicator is especially powerful when paired with Bollinger Bands:
A simultaneous price breakout from the Bollinger Band and DI moving beyond ±1.0% can help identify early trend inflection points.
This combination supports entering positions early in a developing trend, improving the efficiency of trend-following strategies and enhancing decision-making precision.
It also helps filter false breakouts when DI fails to confirm the move outside the band.
This indicator is designed for educational and analytical purposes and works across all timeframes and asset classes.
It is particularly useful for traders seeking a clear framework to identify momentum strength, filter sideways markets, and improve entry timing within a larger trading system.

RTB - Momentum Breakout Strategy V3
📈 RTB - Momentum Breakout Strategy V3 is a directional breakout strategy based on momentum. It combines exponential moving averages (EMAs), RSI, and recent support/resistance levels to detect breakout entries with trend confirmation. The system includes dynamic risk management using ATR-based stop-loss and trailing stop levels. Webhook alerts are supported for external automated trading integrations.
🔎 The strategy was backtested using default parameters on BTCUSDT Futures (Bybit) with 4-hour timeframe and a 0.05% commission per trade.
⚠️ This script is for educational purposes only and does not constitute financial advice. Always do your own research before trading.

Trading Session Highs and LowsTrading Session Highs and Lows
This script provides an intuitive way to visualize key market levels from major trading sessions: Asia, London, New York, and New York Close. By automatically plotting the high and low of each session, it helps traders quickly identify important price levels that could impact market behavior.
Features include:
Session Marking: The script marks the high and low for each major session (Asia, London, New York, and New York Close).
Customizable Lines and Labels: You can adjust the line style, width, and color for each session’s high/low markers. The session name (e.g., "London", "New York") and the PDH/PDL (Prior Day High and Low) are also shown to give clear context.
Real-Time Updates: The levels are updated in real-time to reflect the current price action, helping you gauge price movement throughout the trading day.
Customizable Indicators: Easily adjust the visibility of the different sessions and the labels to focus on the session that matters most to your trading strategy.
This tool is designed to help day traders spot important levels for potential breakouts or reversals, making it easier to base your trading decisions on well-established price points. Ideal for scalpers, swing traders, and anyone who trades across multiple sessions.

False Breakout PRO📌 False Breakout PRO – Enhanced False Breakout Detection Tool
False Breakout PRO is an advanced version of the original "False Breakout (Expo)" indicator by .
This tool is designed to help traders detect bullish and bearish false breakouts with high precision. By offering a more customizable and smarter interface, it helps reduce noise and false signals through various filtering and visualization options.
🔍 How It Works
The script continuously scans for new highs or lows based on a user-defined period.
It identifies false breakouts when price briefly breaks out of a recent high/low but then quickly reverses. These are often seen as market traps, and this indicator aims to highlight them early.
✅ Key Features in the PRO Version
📌 Toggle to display all signals or only the most recent one
💬 Price labels with clean text and optional visibility
📊 Smart summary table for instant signal reference
📈 Auto-extended lines that follow price action
⚡ Lightweight and optimized for speed and real-time responsiveness
🛠 Configurable Settings
False breakout detection period
Signal validity window (how long a signal is considered active)
Smoothing types: Raw (💎), WMA, or HMA
Aggressive mode for early signal generation
Enable or disable:
Price labels
Summary table
Only latest signal mode
⚠️ License Notice
This script is derived from @Zeiierman’s original work and is published under the Creative Commons BY-NC-SA 4.0 license.
🔒 Commercial use is NOT allowed. Attribution to the original author is required.
🇸🇦 False Breakout PRO – أداة متقدمة لكشف الكسر الكاذب
False Breakout PRO هو إصدار مطور من السكريبت الأصلي "False Breakout (Expo)" من تطوير ، وتم تحسينه لتقديم تجربة استخدام أكثر احترافية ومرونة للمستخدمين للكشف عن الكسر الكاذب
🔍 آلية العمل
يقوم السكريبت بمراقبة القمم والقيعان الجديدة بناءً على فترة يتم تحديدها من قبل المستخدم.
ثم يحدد الكسر الكاذب عندما يكسر السعر مستوى مرتفعًا أو منخفضًا ثم يعود بسرعة. هذه الحركة غالبًا ما تكون خداعًا للمضاربين، ويقوم المؤشر بكشفها مبكرًا.
✅ أهم ميزات النسخة PRO
📌 التبديل بين عرض جميع الإشارات أو أحدث إشارة فقط
💬 عرض سعر الإشارة بنص نظيف واختياري
📊 جدول ملخص ذكي لعرض آخر الإشارات بسرعة
📈 تمديد تلقائي للخطوط لمتابعة حركة السعر
⚡ واجهة خفيفة وسريعة ومناسبة للعرض اللحظي
🛠 الإعدادات القابلة للتعديل
فترة تحديد الكسر الكاذب
مدة صلاحية الإشارة
أنواع الفلترة: 💎 خام، WMA، أو HMA
وضع الكشف العدواني (Aggressive)
خيارات العرض:
إظهار أو إخفاء السعر
إظهار أو إخفاء الجدول
عرض آخر إشارة فقط
⚠️ رخصة الاستخدام
تم تطوير هذا السكريبت بالاعتماد على السكريبت الأصلي من @Zeiierman
وهو مرخص بموجب Creative Commons BY-NC-SA 4.0
🔒 الاستخدام التجاري غير مسموح. ويجب نسب الفضل للمطور الأصلي.

ORB - Futures and Stocks (Breakouts + Alerts + ORB Selector)This indicator shows the Opening Range Breakout (ORB) based on the time range you choose.
Important:
It only works for intraday trading on time frames less than 1 day (like 1-minute, 5-minute, or hourly charts).
You can use it with any stock or futures, such as US500, NAS100, or GER40.
Inputs:
ORB Range - Your preference.
Session Start
Time Zone Offset
Examples:
for EU Frankfurt, DAX (GER40):
Set your ORB range
Session Start 0900
Time Zone Offset +1
For US Stock Market and US500, NAS100:
Set your ORB range
Session Start 0930
Time Zone Offset -5
Created using ChatGPT

BIX Candle MarkerBIX Candle Marker (by Bogdan Ilie)
"BIX Candle Marker" is a visual indicator designed to automatically mark the High and Low levels of specific candles at user-defined times and sessions directly on the main chart, facilitating easy intraday analysis.
**How does it work?**
- The indicator automatically fetches the High and Low values from a user-specified timeframe and draws horizontal lines at these levels at precise user-defined session times.
- You can configure up to 4 different sessions per trading day, each with its own customizable color and timing.
- Marked levels are automatically reset at the start of each new trading day.
**Customizable Settings:**
- **Timezone Offset:** Adjust the indicator according to your chart's timezone.
- **Candle Time Frame:** Choose the timeframe from which the candle data will be extracted.
- **Marker Length:** Set the length (number of bars) of the displayed horizontal lines.
- **Line Thickness & Style:** Customize the thickness and style of the lines (solid, dotted, dashed).
- **Sessions (1-4):** Independently configure the hour, minute, and color for each of the four possible sessions.
**Suggested Use:**
- Quickly identify intraday support and resistance levels based on key session candles.
- Ideal for breakout and reversal-based trading strategies.
---
**Disclaimer:**
This indicator is intended solely for chart analysis and educational purposes. It does not constitute financial advice. Always use it in conjunction with your personal trading strategy and risk management practices.
Author: Bogdan Ilie
Pine Script Version: v6
License: Mozilla Public License 2.0
---
BIX Candle Marker (by Bogdan Ilie)
"BIX Candle Marker" este un indicator vizual care marchează automat nivelurile High și Low ale lumânărilor specifice din sesiuni predefinite pe graficul principal, facilitând analiza punctelor-cheie intraday.
**Cum funcționează?**
- Indicatorul preia automat nivelurile maxime și minime dintr-un timeframe personalizabil și afișează linii orizontale pentru aceste nivele exact la orele și minutele configurate.
- Permite definirea a până la 4 sesiuni diferite într-o zi, fiecare având culori și setări proprii.
- Liniile marcate se resetează automat la începutul fiecărei zile de tranzacționare.
**Setări personalizabile:**
- **Timezone Offset:** ajustează indicatorul în funcție de fusul orar al graficului.
- **Candle Time Frame:** selectează timeframe-ul din care se vor prelua datele.
- **Marker Length:** stabilește lungimea (numărul de bare) liniilor orizontale afișate.
- **Line Thickness & Style:** grosimea și stilul liniilor pot fi personalizate (solid, punctat, întrerupt).
- **Sesiuni (1-4):** ora, minutul și culoarea fiecărei sesiuni pot fi configurate independent.
**Sugestii de utilizare:**
- Folosește indicatorul pentru a identifica rapid zonele de suport și rezistență create de lumânări-cheie pe parcursul zilei.
- Poate fi util pentru strategii bazate pe breakout sau reversal.
---
**Disclaimer:**
Acest indicator este destinat exclusiv analizei grafice și nu reprezintă sfaturi financiare. Utilizează-l împreună cu propriile strategii și tehnici de gestionare a riscului.
Autor: Bogdan Ilie
Versiune Pine Script: v6
Licență: Mozilla Public License 2.0

BB Session RangesBB Session Ranges Indicator
Overview
The Bender Bot Session Ranges indicator is a powerful tool for traders who want to visualize and analyze important market sessions throughout the trading day. This indicator identifies and tracks price ranges during specific time periods, helping you spot potential trading opportunities based on session breakouts, retests, and range comparisons.
Key Features
• Multiple Session Tracking: Monitor up to 6 different time-based ranges simultaneously (pre-configured for NY AM Open, NY PM Open, Lunch, Premarket, Midnight Open, and a custom session).
• Range Visualization: Clearly displays high and low boundaries for each session with customizable colors and line styles.
• Historical Comparison: Tracks and displays the average size of ranges over time, helping you identify when current ranges are larger or smaller than typical.
• Flexible Time Settings: Easily configure exact session times based on your trading schedule and preferred markets.
• Range Extension Options: Extend range boundaries by bars, days, or weeks to track the longer-term influence of session ranges.
• Sidecar Information Display: Optional labels show range details, including size, percentage of average, and dollar value.
How It Works
The indicator identifies specific time-based sessions (for example, the first 5 minutes of the NY market open) and tracks the high and low prices established during these periods. Once a session is complete, the range boundaries are plotted on your chart and can be extended for further analysis. The indicator calculates the current range size and compares it to historical averages, giving you context for the day’s market behavior.
Sidecar Functionality
The sidecar feature is a key aspect of this indicator that helps keep your charts clean and organized. Instead of cluttering your price action with labels and annotations directly on the ranges, the sidecar system:
• Creates a dedicated information panel offset from the price action.
• Connects to ranges with discreet connecting lines.
• Displays key statistics like range size, dollar value, and percentage of average.
• Can be positioned at custom distances from the main chart (measured in bars).
• Allows you to see important data without interfering with your price analysis.
• Can be completely disabled when you prefer minimal chart elements.
• Helps maintain visual clarity even when tracking multiple sessions simultaneously.
This design philosophy puts trader experience first by separating information display from price action analysis, giving you the best of both worlds: clean charts and detailed information.
Setup Guide
1. Choose Your Sessions: Enable or disable each of the six available ranges by setting the Max Ranges to Plot parameter (use 0 to disable a range).
2. Configure Session Times: Set exact times for each range using standard 24-hour format (for example, 0930-0935 for 9:30-9:35 AM).
3. Customize Display: Select colors, line widths, and information display options for each range.
4. Set Extension Parameters: Choose how far to extend range lines (by a number of bars, days, or weeks, or select Always for continuous extension).
5. Configure Sidecar Labels: Set the offset for the information displays (use 0 to disable sidecar labels entirely).
Trading Applications
• Identify potential support and resistance levels based on session highs and lows.
• Compare current session ranges to historical averages to gauge volatility.
• Look for breakouts from established session ranges.
• Use range extensions to anticipate potential price targets.
• Monitor multiple session ranges to identify pattern correlations.
Advanced Usage
The indicator includes fields that help you assess range size relative to past performance, including dollar value calculations. This can be particularly useful for position sizing and risk management when trading breakouts from these ranges.
Future Development
We’re actively working on expanding this indicator to include robust strategy and alert functionality. This will allow traders to:
• Backtest trading strategies based on session range breakouts and retests.
• Customize entry, exit, and risk management parameters.
• Receive real-time alerts when price interacts with significant range levels.
• Set conditional alerts based on range size compared to historical averages.
• Automate trading decisions based on your specific session-based criteria.
If these strategy and alert features would be valuable for your trading, please let us know in the comments. Your feedback directly influences our development priorities and helps us create tools that best serve the trading community.
Notes
• All times are based on the America/New_York timezone.
• The indicator dynamically adjusts to different timeframes, providing consistent results whether you’re viewing 1-minute or daily charts.
• Range calculations are based on the highs and lows established during the defined sessions.
Reversal Precision Index Overview
The Reversal Precision Index (RPI) is designed to assist traders in identifying potential reversal zones and tracking market trends. This overlay indicator combines a set of dynamic price channels with a customizable trend-following band, offering a robust framework for spotting key turning points and monitoring price action. Ideal for traders seeking to enhance their decision-making process, RPI is versatile across various timeframes and asset types.
Key Features
Dynamic Price Channels: Visualizes multiple support and resistance levels based on a weighted average of price data, helping you identify areas where price reversals are likely to occur.
Trend-Following Band: Includes an adjustable band that follows price trends, providing insights into the overall market direction and potential breakout zones.
Customizable Alerts: Notifies you when price crosses key levels, allowing you to react promptly to significant market movements.
Price Labels: Displays current levels of the price channels on the chart, aiding in quick reference and analysis (optional).
Interpreting the Indicator
Reversal Zones: Look for price reactions near the channel levels, which often act as high-probability reversal points. These zones can signal potential entry or exit opportunities.
Trend Direction: The trend band provides a smoothed view of market direction. Use its position relative to price to gauge bullish or bearish momentum.

Fakeout, Breakout & Trend Switch Detector - TrendPredator FOTrendPredator Fakeout Highlighter (FO)
The TrendPredator Fakeout Highlighter is designed to enhance multi-timeframe trend analysis by identifying key market behaviors that indicate trend strength, weakness, and potential reversals. Inspired by Stacey Burke’s trading approach, this tool focuses on trend-following, momentum shifts, and trader traps, helping traders capitalize on high-probability setups.
At its core, this indicator highlights peak formations—anchor points where price often locks in trapped traders before making decisive moves. These principles align with George Douglas Taylor’s 3-day cycle and Steve Mauro’s BTMM method, making the FO Highlighter a powerful tool for reading market structure. As markets are fractal, this analysis works on any timeframe.
How It Works
The TrendPredator FO highlights key price action signals by coloring candles based on their bias state on the current timeframe.
It tracks four major elements:
Breakout/Breakdown Bars – Did the candle close in a breakout or breakdown relative to the last candle?
Fakeout Bars (Trend Close) – Did the candle break a prior high/low and close back inside, but still in line with the trend?
Fakeout Bars (Counter-Trend Close) – Did the candle break a prior high/low, close back inside, and against the trend?
Switch Bars – Did the candle lose/ reclaim the breakout/down level of the last bar that closed in breakout/down, signalling a possible trend shift?
Reading the Trend with TrendPredator FO
The annotations in this example are added manually for illustration.
- Breakouts → Strong Trend
Multiple candles closing in breakout signal a healthy and strong trend.
- Fakeouts (Trend Close) → First Signs of Weakness
Candles that break out but close back inside suggest a potential slowdown—especially near key levels.
- Fakeouts (Counter-Trend Close) → Stronger Reversal Signal
Closing against the trend strengthens the reversal signal.
- Switch Bars → Momentum Shift
A shift in trend is confirmed when price crosses back through the last closed breakout candles breakout level, trapping traders and fuelling a move in the opposite direction.
- Breakdowns → Trend Reversal Confirmed
Once price breaks away from the peak formation, closing in breakdown, the trend shift is validated.
Customization & Settings
- Toggle individual candle types on/off
- Customize colors for each signal
- Set the number of historical candles displayed
Example Use Cases
1. Weekly Template Analysis
The weekly template is a core concept in Stacey Burke’s trading style. FO highlights individual candle states. With this the state of the trend and the developing weekly template can be evaluated precisely. The analysis is done on the daily timeframe and we are looking especially for overextended situations within a week, after multiple breakouts and for peak formations signalling potential reversals. This is helpful for thesis generation before a session and also for backtesting. The annotations in this example are added manually for illustration.
📈 Example: Weekly Template Analysis snapshot on daily timeframe
2. High Timeframe 5-Star Setup Analysis (Stacey Burke "ain't coming back" ACB Template)
This analysis identifies high-probability trade opportunities when daily breakout or down closes occur near key monthly levels mid-week, signalling overextensions and potentially large parabolic moves. Key signals for this are breakout or down closes occurring on a Wednesday. This is helpful for thesis generation before a session and also for backtesting. The annotations in this example are added manually for illustration. Also an indicator can bee seen on this chart shading every Wednesday to identify the signal.
📉 Example: High Timeframe Setup snapshot
3. Low Timeframe Entry Confirmation
FO helps confirm entry signals after a setup is identified, allowing traders to time their entries and exits more precisely. For this the highlighted Switch and/ or Fakeout bars can be highly valuable.
📊 Example (M15 Entry & Exit): Entry and Exit Confirmation snapshot
📊 Example (M5 Scale-In Strategy): Scaling Entries snapshot
The annotations in this examples are added manually for illustration.
Disclaimer
This indicator is for educational purposes only and does not guarantee profits.
None of the information provided shall be considered financial advice.
Users are fully responsible for their trading decisions and outcomes.

Breakouts With Timefilter Strategy [LuciTech]This strategy captures breakout opportunities using pivot high/low breakouts while managing risk through dynamic stop-loss placement and position sizing. It includes a time filter to limit trades to specific sessions.
How It Works
A long trade is triggered when price closes above a pivot high, and a short trade when price closes below a pivot low.
Stop-loss can be set using ATR, prior candle high/low, or a fixed point value. Take-profit is based on a risk-reward multiplier.
Position size adjusts based on the percentage of equity risked.
Breakout signals are marked with triangles, and entry, stop-loss, and take-profit levels are plotted.
moving average filter: Bullish breakouts only trigger above the MA, bearish breakouts below.
The time filter shades the background during active trading hours.
Customization:
Adjustable pivot length for breakout sensitivity.
Risk settings: percentage risked, risk-reward ratio, and stop-loss type.
ATR settings: length, smoothing method (RMA, SMA, EMA, WMA).
Moving average filter (SMA, EMA, WMA, VWMA, HMA) to confirm breakouts.

Breakouts with timefilter [LuciTech]Here's the updated description with "colors" replaced by "colours" throughout, maintaining the original structure and content:
Breaking Point 2.0
This is a technical analysis overlay indicator designed to identify breakout levels based on pivot highs and lows, with a focus on price action during customizable time windows using London time (UK). It draws horizontal lines at pivot points and plots signals when price breaks above or below these levels, offering traders a tool to monitor potential bullish or bearish movements. The indicator includes options for time filtering and displaying only the most recent breakout.
Features
The Pivot Breakout Lines display horizontal lines at detected pivot highs (bullish) and pivot lows (bearish), coloured green and red by default. These lines extend from the pivot point to the breakout bar and can be set to show only the latest breakout.
The Breakout Signals mark bullish breakouts with an upward triangle below the bar and bearish breakouts with a downward triangle above the bar, using customizable colours.
The Time Filter restricts signals and lines to a specific window (default: 14:30–15:00 UK), which can be toggled on or off. A shaded background highlights this period when enabled.
How It Works
The indicator calculates pivot highs and lows using a user-defined lookback period (default: 5 bars). When price closes above a pivot high, it triggers a bullish signal and draws a line from the pivot to the breakout bar. When price closes below a pivot low, it triggers a bearish signal with a corresponding line.
If the time filter is active, signals and lines only appear within the specified window. Outside this period—or if the filter is disabled—they appear based solely on price action. The indicator maintains up to three recent pivots in memory, removing older ones as new pivots form.
Alerts are available for both bullish and bearish breakouts, triggered when signals occur.
Settings
Length controls the lookback period for pivot detection (default: 5).
Colours Bull/Bear sets the colours for bullish (default: green) and bearish (default: red) lines and signals.
Show Last Breakout toggles whether only the most recent breakout line and signal are displayed (default: false).
Time Filter enables or disables the time restriction (default: true).
Fill Background toggles a shaded area during the time window (default: true), with a customizable colour.
Time Settings define the start hour/minute and end hour/minute for the filter (default: 14:30–15:00).
Interpretation
The Pivot Breakout Lines highlight levels where price has previously reversed, potentially acting as support or resistance. A breakout above a pivot high may suggest bullish momentum, while a breakout below a pivot low may indicate bearish pressure.
The Breakout Signals provide visual cues for these events, useful for timing entries or exits. When "Show Last Breakout" is enabled, the chart focuses on the most recent signal, reducing clutter.
The Time Filter and background shading help traders concentrate on specific trading sessions, such as high-volatility periods. When disabled, the indicator tracks breakouts across all times.

SSL Channel MTFSSL Channel with MTF support, This eliminates the noise of a basic SSL Channel script which is based on ErwinBeckers SSL Channel. So i have used a Multi Time Frame approach to have a clear confirmation of trend and reduce Noise and False signals unlike basic SSL Channel.
This script can be used to determine.
Support/Resistance
High/Low Breakout
Trend Direction
MA candles for Entry
The high and low sma are plotted as SSL CHANNEL when ever the high and low sma cross each other a direction change is observed.
The direction of SSL channel determines the trend of the price. The length of the channel can be changed as required a low value has a high noise and direction can be determined with low accuracy. Increasing the length of SSL channel has high accuracy trend confirmation.
The MTF SSL Channel uses plot from higher timeframe this helps in using SSL Channel as a Price Action Tool. Price when ever crosses over or below the channel determines a breakout. Price tries to move between the High SMA line and Low SMA Line of the SSL Channel rejection, breakouts can be easily observed on a lower timeframe using SSL Channel Plot from a higher timeframe.
I have used 5min/15min chart with MTF SSL from a 1Hr/4Hr and a length of 5 instead of 10. This helps quick direction changes over a period of 1hr to 4hr. Price is trapped within the High SMA and Low SMA lines of SSL Channel. In addition to SSL High Low and average mid line is plotted to additional reference.
Buy Sell Signals are plotted based on crossover of SMA High and Low.
Candle are Plotted Using a SMA with length of 5. This Candle Plot can be used to make an entry based on direction confirmation of SSL. keep in mind the direction of SSL Plot and the candle must be same. Preferably Entry can made above or below the midline of SSL Channel. The Candle Plot eliminates the Noise of traditional Japanese Candlesticks.
Additionally MACD Crossover and MACD Trend line confirmations can be used to confirm a Buy Sell and Entry signals
Alerts are also plotted accordingly.

RSI Volatility Suppression Zones [BigBeluga]RSI Volatility Suppression Zones is an advanced indicator that identifies periods of suppressed RSI volatility and visualizes these suppression zones on the main chart. It also highlights breakout dynamics, giving traders actionable insights into potential market momentum.
🔵 Key Features:
Detection of Suppression Zones:
Identifies periods where RSI volatility is suppressed and marks these zones on the main price chart.
Breakout Visualization:
When the price breaks above the suppression zone, the box turns aqua, and an upward label is drawn to indicate a bullish breakout.
If the price breaks below the zone, the box turns purple, and a downward label is drawn for a bearish breakout.
Breakouts accompanied by a "+" label represent strong moves caused by short-lived, tight zones, signaling significant momentum.
Wave Labels for Consolidation:
If the suppression zone remains unbroken, a "wave" label is displayed within the gray box, signifying continued price stability within the range.
Gradient Intensity Below RSI:
A gradient strip below the RSI line increases in intensity based on the duration of the suppressed RSI volatility period.
This visual aid helps traders gauge how extended the low volatility phase is.
🔵 Usage:
Identify Breakouts: Use color-coded boxes and labels to detect breakouts and their direction, confirming potential trend continuation or reversals.
Evaluate Market Momentum: Leverage "+" labels for strong breakout signals caused by short suppression phases, indicating significant market moves.
Monitor Price Consolidation: Observe gray boxes and wave labels to understand ongoing consolidation phases.
Analyze RSI Behavior: Utilize the gradient strip to measure the longevity of suppressed volatility phases and anticipate breakout potential.
RSI Volatility Suppression Zones provides a powerful visual representation of RSI volatility suppression, breakout signals, and price consolidation, making it a must-have tool for traders seeking to anticipate market movements effectively.

The Curved Market Structure [BigBeluga]Curved Market Structure
The Curved Market Structure indicator offers an innovative twist on traditional market structure tools by using curved lines instead of horizontal ones, enabling faster breakout detection for traders.
🔵Key Features:
Curved Market Structure Levels: The indicator identifies high and low pivots and plots curved lines connecting these points, adapting to market dynamics and providing a more intuitive view of potential breakout zones.
Breakout Detection: Breakouts above or below the curved levels are marked with triangle symbols (▲ or ▼), making it easy to spot critical price movements.
Dynamic Target Levels: After a breakout, the indicator plots three target levels, which serve as potential price objectives. Each target is marked with a number and a star (e.g., 1★) upon being reached.
Customizable Line Length and Angle: Users can adjust the length and angle of the curved lines to fit their trading style and timeframe, making the tool versatile and adaptable.
Market Structure Trend Filtering: To maintain a clean chart, the indicator plots curved levels only from high pivots during uptrends and low pivots during downtrends.
🔵How It Works:
The indicator identifies high and low pivots using user-defined parameters (left and right bars).
Curved lines are drawn from these pivot points, showing the structure of the market and potential breakout zones.
When a breakout occurs, the indicator highlights the direction with triangle symbols and dynamically plots three price targets.
Upon reaching these targets, the level is marked with its respective number and a star, helping traders track price progression effectively.
The lines and targets are adjusted based on market conditions, ensuring real-time relevance and accuracy.
🔵Use Cases:
Spotting key breakout zones to identify entry and exit points more effectively.
Setting dynamic target levels for take-profit or stop-loss planning.
Filtering market noise and maintaining a cleaner chart while analyzing trends.
Enhancing traditional market structure analysis with an intuitive curved visualization.
This indicator is ideal for traders who want a modern, dynamic, and visually appealing way to track market structure and breakouts while maintaining chart clarity.

Smart Money Breakouts [iskess 01-02 11:05]This is an big update to the excellent Smart Money Breakout Script published in Oct 2023 by ChartPrime who, to my knowledge, was the original author.
FULL CREDIT GOES TO CHARTPRIME FOR THIS ORIGINAL WORK.
Per the moderator's rules, you will find below a meaningful, detailed self-contained description that does not rely on delegation to the open source code or links to other content. You will find in the description details on what the script does, how it does that, how to use it, and how it is original.
The "Smart Money Breakouts" indicator is designed to identify breakouts based on changes in character (CHOCH) or breaks of structure (BOS) patterns, facilitating automated trading with user-defined Take Profit (TP) level.
The indicator incorporates essential elements such as volume analysis and a data table to assist traders in optimizing their strategies.
🔸Breakout Detection:
The indicator scans price movements for "Change in Character" (CHOCH) and "Break of Structure" (BOS) patterns, signaling potential breakout opportunities in the market.
🔸User-Defined TP/SL :
Traders can customize the Take Profit (TP) and Stop Loss (SL) through the indicator settings, with these levels dynamically calculated based on the Average True Range (ATR). This allows for precise risk management and profit targets that adapt to market volatility. Traders can also select the lookback period for the TP/SL calculations.
🔸Volume Analysis and Trade Direction Specific Analysis:
The indicator includes a volume checker that provides valuable insights into the strength of the breakout, taking into account trade direction.
🔸If the volume label is red and the trade is long, it suggests a higher likelihood of hitting the Stop Loss (SL).
🔸If the volume label is green and the trade is long, it indicates a higher probability of hitting the Take Profit (TP).
🔸For short trades, a red volume label suggests a higher likelihood of hitting TP, while a green label suggests a higher likelihood of hitting SL.
🔸A yellow volume label suggests that the volume is inconclusive, neither favoring bullish nor bearish movements.
🔸Data Table:
The indicator features a data table that keeps track of the number of winning and losing trades for specific timeframes or configurations. It also shows the percentage of profits vs losses, and the overall profit/loss for the selected lookback period.
This table serves as a valuable tool for traders to analyze performance and discover optimal settings and timeframes.
The "Smart Money Breakouts" indicator provides traders with a comprehensive solution for breakout trading, combining technical analysis of changes in character and breaks of structure, volume insights, and performance tracking while dynamically adjusting TP and SL levels based on market volatility through the ATR.
This version of the script is a "significant improvement" from Chart Prime's original work in the following ways:
- A selectable range of candles for the profit/loss calculations to look back on.
- An updated table that includes the percentage of wins/losses, and and overall P&L during the selected lookback range.
- The user can now select only Long trades, Short trades, or both.
- The percentage gain/loss is now indicated for every trade on the chart.
- The user can now select a different multiplier for Stop Loss or Take Profit thresholds.
