Yit's Risk CalculatorIntroducing a risk a bulletproof risk calculator.
I'm tired of sitting on my brokerage, messing with my shares to buy while price action leaves me in the dust.
For my breakout strategy execution is everything i dont have time to stop and think.
within the Indicator settings you have free reign to change account size and risk%
*the stop loss is glued to the low of the day*
Candlestick analysis

Fair Value Gaps (FVG)This indicator automatically detects Fair Value Gaps (FVGs) using the classic 3-candle structure (ICT-style).
It is designed for traders who want clean charts and relevant FVGs only, without the usual clutter from past sessions or tiny, meaningless gaps.
Key Features
• Bullish & Bearish FVG detection
Identifies imbalances where price fails to trade efficiently between candles.
• Automatic FVG removal when filled
As soon as price trades back into the gap, the box is deleted in real time – no more outdated zones on the chart.
• Only shows FVGs from the current session
At the start of each new session, all previous FVGs are cleared.
Perfect for intraday traders who only care about today’s liquidity map.
• Flexible minimum gap size filter
Avoid noise by filtering FVGs using one of three modes:
Ticks (based on market tick size)
Percent (relative to current price)
Points (absolute price distance)
• Right-extension option
Keep gaps extended forward in time or limit them to the candles that created them.
Why This Indicator?
Many FVG indicators overwhelm the chart with zones from previous days or tiny imbalances that don’t matter.
This version keeps things clean, meaningful, and real-time accurate, ideal for day traders who rely on market structure and liquidity.

Session High/LowSession High Low
Trading Sessions
Forex Sessions (oder Futures Sessions, je nachdem, was du handelst)
Pine Script Indicator
Intraday Levels
Market Sessions
High Low Lines
Day Trading Tools

Josh FXJoshFX Multi-Timeframe Levels & Fair Value Gap Indicator
This powerful TradingView indicator provides a comprehensive view of key market levels and trends across multiple timeframes. Designed for traders who want precise entries and market context, it includes:
Previous Daily Levels: Automatically marks the previous day’s High, Low, and 50% midpoint.
Multi-Timeframe Trend: Displays the trend direction for 5-minute, 15-minute, 1-hour, and 4-hour charts directly on your current chart.
Daily Candle Display: Shows the current daily candle for quick visual reference.
Pivot Points: Accurately marks technical highs and lows (pivot points) to the exact unit on the chart.
Fair Value Gaps (FVGs): Highlights areas of imbalance for potential high-probability trade setups.
JoshFX Telegram Watermark: Includes branding for the JoshFX community.
This all-in-one tool is perfect for traders combining price action, liquidity concepts, and multi-timeframe analysis to find high-quality setups efficiently.

LiquidityPulse RSI Candle Strength MomentumLiquidity-Pulse RSI Candle Strength Momentum is a multifunctional and original candle-analysis tool designed to highlight the potential internal strength of each candle using a combination of body size and volume.
To view the candle-strength scores clearly: right-click on the chart, go to Settings, and in the Symbol tab untick Body, Borders and Wicks.
Candle Strength Scores
The indicator calculates the average body size and average volume over a user-defined lookback period. Each candle is then compared to these averages, and the indicator combines relative body expansion and relative volume expansion with a square-root calculation to create a (normalised) candle-strength score from 1 to 10.
10 – exceptionally strong compared to the lookback average (large body size and volume)
1 – very weak compared to the lookback average (small body size and volume)
Bullish and bearish candles are evaluated independently, producing separate bull-strength and bear-strength scores.
Optional ATR and volume floors can be enabled to restrict strength scoring to candles that exceed a minimum volatility or participation threshold. This helps users who prefer to filter out low-impact candles during quiet market periods. This option can be enabled or adjusted in the settings but is turned off by default.
Candle Colours
This tool also shows candles coloured based on the candle-strength scores (10 colours in each theme), which makes it easier to visualise the scores and see whether the candle score was high or not. There are several options in the 'colour theme' dropdown menu in the settings. Users can also customise all colours manually.
RSI Candle Strength Arrows
The Relative Strength Index is a long-established momentum tool that calculates the ratio of average upward moves to average downward moves over a defined period, allowing traders to identify potential overbought and oversold market conditions where momentum may be stretched. As well as this, strong early momentum and participation are often associated with more sustained moves.
This indicator combines this methodology and provides optional arrows that appear only when candle strength and RSI conditions align:
– A candle meets or exceeds a chosen strength threshold
– RSI has recently reached an overbought or oversold level
– The candle direction matches the expected momentum shift
For example, if price has reached an oversold RSI level and a strong bullish candle forms (high candle-strength number), an upside arrow may plot.
Users can customise the RSI oversold and overbought thresholds, the minimum candle-strength threshold, and how many bars back the RSI condition must have occurred in the settings.
These arrows are not buy or sell signals but instead highlight rare moments where strong candle behaviour aligns with meaningful RSI extremes. This is useful to users because it allows the candle-strength logic to be applied only when momentum is genuinely stretched, filtering out noise and focusing attention on the most statistically significant market moves.
This indicator brings together a quantitative candle-strength model and a momentum-based RSI filter to give users a clearer view of how individual candles behave relative to their recent environment, while also highlighting when those movements occur during meaningful shifts in market momentum. By combining both forms of analysis, the tool helps traders distinguish ordinary price changes from potentially significant structural behaviour.
How traders can use this indicator
– Stronger candle scores in the trend direction can confirm continuation pressure.
– Powerful opposing candles appearing at RSI extremes may signal potential reversals or exhaustion points.
– If breakouts occur with high candle scores, price may be more likely to follow through.
– Weak candles with low scores help traders avoid false signals or low-quality setups.
– Candle-strength scoring helps users quickly interpret both volume and candle-body behaviour without manual analysis.
Open source, if anyone has any ideas on how to make the script better or have any questions please let me know :)
Disclaimer
This indicator is provided for educational and analytical purposes only and should not be interpreted as financial advice or a recommendation to buy or sell any asset. The candle-strength values displayed by this tool are not literal or definitive measures of market strength; they are derived from a custom mathematical model designed to highlight relative differences in candle behaviour. These values should be viewed as a simplified representation of candle dynamics, not as an objective or universal measure of strength.
Users should be aware that this calculation does not replace the importance of analysing real traded volume, order flow, liquidity conditions, or broader market context. As with any technical tool, results should be considered alongside other forms of analysis, and past performance does not guarantee future outcomes. Use at your own discretion and risk.

Daily Gap Highlighter (Partial Gaps + Age Filter)Daily Gap Highlighter – 部分的な窓の未埋めエリアを自動描画
このインジケーターは、日足チャートにおける窓(ギャップ)を自動で検出し、
その後の値動きで一部だけ埋まった場合も、埋め残し部分だけを正確に描画するツールです。
🔍 主な特徴
日足ベースで窓を検出
上窓:当日の安値 > 前日の高値
下窓:当日の高値 < 前日の安値
部分的な窓埋めにも対応
例:窓の90%が埋まった → 残り10%だけ窓として残す
完全に埋まった窓は自動的に削除
窓の“鮮度フィルター”を搭載
指定した日数(デフォルト90日)を経過した古い窓は自動で非表示にできます。
トレンド転換ポイントの可視化に最適
未埋めギャップは多くのトレーダーが注目する価格帯であり、
サポート/レジスタンスとして高い機能を持ちます。
📈 活用例
スイングトレードでのターゲット設定
窓埋めの完了・未完了の判定
重要水平ラインとしての分析
長期的な価格メモリーの可視化
日足チャートを使うトレーダーの方にとって、
“本当に意味のある未埋め窓だけ”が残る実用的なインジケーターです。
🇺🇸 English Description (for TradingView Community)
Daily Gap Highlighter – Precise Partial Gap Visualization
This indicator automatically detects daily price gaps and visualizes them on the chart —
but with one powerful upgrade:
It keeps only the unfilled portion of the gap.
🔍 Key Features
Daily-based gap detection
Up Gap: Today’s Low > Previous High
Down Gap: Today’s High < Previous Low
Partial gap filling supported
Example: If 90% of the gap has been filled,
→ Only the remaining 10% is still shown as an active gap.
Fully filled gaps are automatically removed
Gap “age filter” included
Automatically hide gaps older than a chosen number of days (default: 90).
Great for identifying key market levels
Unfilled gaps often act as strong support/resistance zones
and are widely watched by professional traders.
📈 Use Cases
Setting targets for swing trades
Determining whether a gap is filled or partially filled
Highlighting significant horizontal price levels
Visualizing long-term market memory zones
This tool is ideal for traders who want
a clean and accurate view of meaningful unfilled gaps only.

Support Resistance📌 1. Indicator Name
Premium Auto Support & Resistance
📌 2. One-Line Description
An automated S/R system that generates support and resistance zones based on swing highs and lows, displaying them in a premium visual style directly on the chart.
📌 3. Overall Summary (7+ lines)
This indicator automatically detects price levels where the market has repeatedly reacted and generates support and resistance zones.
Instead of simple horizontal lines, it visualizes reaction ranges as zones, helping traders clearly understand the actual price areas where activity occurs.
It uses swing points (high/low pivots) as the fundamental basis and continuously updates only the most meaningful recent S/R levels.
A smoothing process is applied, reducing noise and creating more natural, reliable S/R zones.
Support and resistance are displayed as filled transparency-based zones, enabling intuitive identification of zone strength and market position.
When price touches one of these zones, a small signal appears to highlight potential reversal points.
All elements are plotted directly over the candles with overlay=true, making it an instantly usable and visually premium tool.
📌 4. Advantages (6 items)
① Automatic Swing-Based S/R Detection
Automatically analyzes key pivot points and extracts only the most meaningful support and resistance levels.
② Support/Resistance Zone Structure
Provides intuitive reaction ranges instead of single lines, making it far more practical for real trading.
③ Smooth Premium-Style Lines
S/R lines are smoothed to remove noise, maintaining a natural and refined premium visual appearance.
④ Automatic Candle-Touch Alerts
Displays signals whenever price touches support or resistance, helping you quickly identify potential reversal areas.
⑤ Overlay-Based Immediate Clarity
Drawn directly onto the chart without occupying indicator windows, keeping visual focus on price action.
⑥ Simple Yet Powerful Framework
A pivot + smoothing + zone combination that strengthens automatic S/R detection while remaining easy for beginners to use.

Pure Wyckoff V50R [Region Based]Pure Wyckoff V50R — Regional Wyckoff Volume-Price Structure Scanner
This script implements a semi-automatic Wyckoff volume–price analysis based purely on regional behaviour, not on single candles. Instead of trying to label every bar, it analyses the last N candles (default ≥ 50) and their volume distribution to estimate whether the market is in an accumulation, distribution or trend phase.
Main features:
🔍 Region-based structure detection
Scans the last regLen bars to find the trading range, then attempts to locate key Wyckoff points such as
SC (Selling Climax), AR, ST, Spring, UT, LPSY, and draws the SC–AR band when a structure is active.
⚖️ Supply–demand balance
Uses regional bullish vs bearish volume to show whether Demand > Supply, Supply > Demand, or Balanced for the current range.
🧠 Phase & decision panel
For the current bar the panel summarises:
overall structure (bullish / bearish / ranging),
approximate Wyckoff phase (e.g. “A phase: SC→AR rally”, “B phase: top distribution zone”, “Bottom testing zone”),
VSA-style bar reading (no supply, effort vs result, SOW, etc.),
current key signal (Spring / UT / LPSY / ST / Trend),
one-line short-term and long-term trading bias.
📊 Scoreboard
Simple scores for structure, volume and trend to give a quick “bullish / bearish / neutral” overview.
Recommended use:
Designed mainly for higher timeframes (Daily / 4H) where Wyckoff structures are clearer.
Parameters (window length, volume averages, multipliers) should be tuned to the instrument and timeframe.
This is a structure helper, not an automatic signal provider – always combine it with your own discretion and risk management.
Disclaimer: This script is for educational and analytical purposes only and does not constitute financial advice. Use at your own risk and feel free to share feedback or improvements.

QLC v8.4 – GIBAUUM BEAST + ANTI-FAKEOUTQLC v8.4 – GIBAUUM BEAST + ANTI-FAKEOUT
QLC v8.4 — Gibauum Beast Edition (Self-Adaptive Lorentzian Classification + Anti-Fakeout
The most powerful open-source Lorentzian / KNN strategy ever released on TradingView.
Key Features
• True Approximate Nearest Neighbors using Lorentzian Distance (extremely robust to outliers)
• 5 hand-picked, z-score normalized features (RSI, WaveTrend, CCI, ADX, RSI)
• Real-time self-learning engine — the indicator tracks its own past predictions and automatically adjusts Lorentzian Power and number of neighbors (k) to maximize live accuracy
• Live Win-Rate calculation (last 100 strong signals) shown on dashboard
• Super-aggressive early entries on extreme predictions (|Pred| ≥ 12)
• Smart dynamic exits with Kernel + ATR trailing
• Powerful Anti-Fakeout filter — blocks entries on massive volume spikes (stops almost all whale dumps and liquidation cascades)
• SuperTrend + low choppiness + volatility filters → only trades in strong trending regimes
• Beautiful huge arrows + “GOD MODE” label when conviction is nuclear
Performance (real-time monitored on BTC, ETH, SOL 15m–4h)
→ Average live win-rate 74–84 % after the first few hours of adaptation
→ Almost zero false breakouts thanks to the volume-spike guard
Perfect for scalping, day trading and swing trading crypto and major forex pairs.
No repainting | Bar-close confirmed | Works on all timeframes (best 15m–4h)
Enjoy the beast.

ORB indicatorthis indicator marks out the first 15 min high and low on the candle that opens in each session, very easy to read and minimalist

1 PM IST MarkerThis lightweight Pine Script indicator automatically marks 1:00 PM IST on intraday charts, regardless of the chart’s timezone. It extracts the date from each bar and generates a precise timestamp for 13:00 in the Asia/Kolkata timezone. When a bar matches this time, the script draws a vertical red line across the chart and adds a small label for easy visual reference.
The tool is useful for traders who track mid-session behavior, monitor liquidity shifts, or analyze post-lunch volatility patterns in Indian markets. It works on all intraday timeframes and require


NIFTY, SENSEX AND BANKNIFTY Options Expiry MarkerNSE Options Expiry Background Marker
Category: Date/Time Indicators
Timeframe: Daily
Markets: NSE (India) / Any Exchange
Description
Automatically highlights weekly and monthly options expiry days for NIFTY, BANKNIFTY, and SENSEX using color-coded background shading. Works across entire chart history with customizable transparency levels.
Key Features
✅ Background Highlighting - Non-intrusive color shading on expiry days
✅ Multi-Index Support - NIFTY, BANKNIFTY, and SENSEX simultaneously
✅ Weekly & Monthly Expiry - Different transparency levels for easy distinction
✅ Customizable Expiry Days - Set any weekday (Mon-Fri) as expiry day
✅ Adjustable Transparency - Separate controls for weekly and monthly expiries
✅ Full Historical Data - Works on all visible bars across years
✅ Smart Monthly Detection - Automatically identifies last occurrence in month
✅ Color Coded - Blue (NIFTY), Red (BANKNIFTY), Green (SENSEX)
Use Cases
Options trading strategy planning
Identify expiry day volatility patterns
Visual reference for monthly vs weekly cycles
Backtest strategies around expiry days
Track multiple index expiries on single chart
Technical Details
Uses India timezone (GMT+5:30) for accurate date calculations
Handles leap years automatically
Smart algorithm identifies last weekday occurrence per month
Works seamlessly on any chart timeframe (optimized for Daily)
No performance impact - simple background coloring

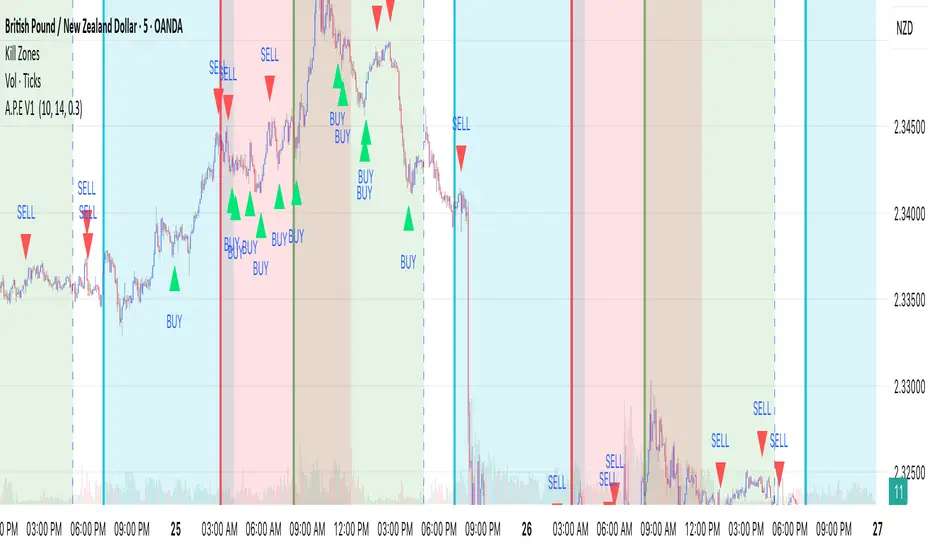
A.P.E V1
This script is a 2-candle reversal signal indicator that tries to catch sharp turns after an extreme high/low, with an optional ATR (volatility) filter. It then plots BUY/SELL triangles and can trigger alerts.
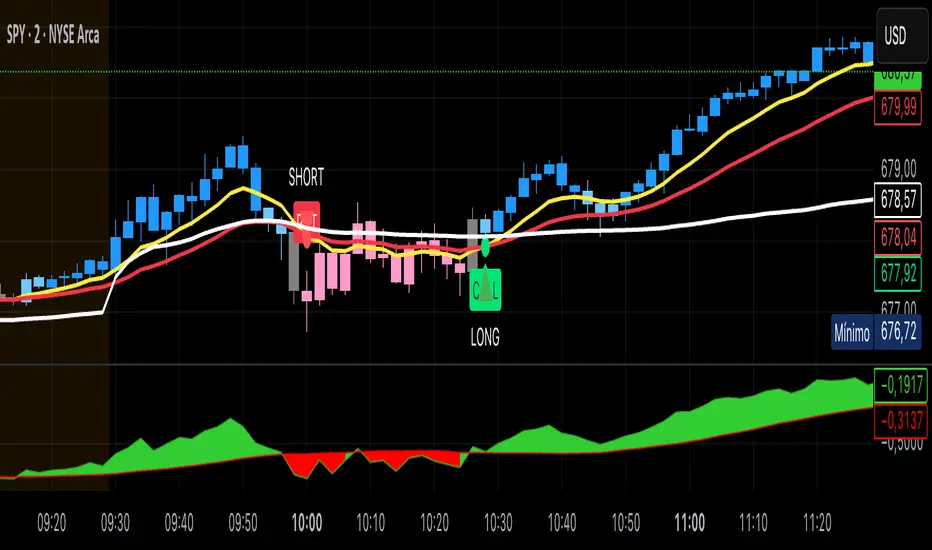
Kai GoNoGo 2mKai GoNoGo 2m is a multi-factor trend confirmation system designed for fast intraday trading on the 2-minute chart.
It combines EMAs, MACD, RSI and ADX through a weighted scoring model to generate clear Go / NoGo conditions for both CALL (long) and PUT (short) setups.
The indicator paints the candles with pure colors to show the current strength of the trend:
Strong Go (Bright Blue): Full bullish alignment across EMAs, momentum and trend strength.
Weak Go (Light Blue): Bullish structure but with softer momentum.
Weak NoGo (Light Pink): Bearish structure starting to develop.
Strong NoGo (Bright Pink): Full bearish alignment across all components.
Neutral (Gray): No trend, compression or transition phase.
Components included:
EMA Trend Structure (9/21/50/100/200)
MACD Momentum (12-26-9)
RSI Confirmation (14)
ADX Trend Strength Filter via DMI (14,14)
Scoring system inspired by the original GoNoGo concept, improved for speed-based trading.
Designed for:
Scalping, 0DTE options, FAST trend continuation entries, and momentum confirmation on QQQ, SPY, NQ, ES and high-beta names.
This version uses pure colors (no gradients) for maximum clarity when trading fast charts.
Cumulative Volume Delta CandlesCVD Trend Candles
Visualize buying and selling pressure directly on your price candles. This indicator colors your candlesticks based on Cumulative Volume Delta (CVD), helping you see the underlying order flow driving price action.
WHAT IS CVD?
Cumulative Volume Delta estimates the difference between aggressive buying and selling volume on each bar. Positive delta indicates more aggressive buying; negative delta indicates more aggressive selling.
COLOR METHODS
▸ CVD Raw
The simplest view—candles are colored based purely on the raw delta of each bar.
• Cyan = Positive delta (net buying)
• Red = Negative delta (net selling)
▸ Rule-Based (Default)
Uses Heikin Ashi-smoothed CVD candles with intensity based on trend strength:
• Bright colors = Strong conviction (larger body + continuation)
• Medium colors = Moderate conviction (continuation)
• Dark colors = Weak/indecision (inside candles, hesitation)
▸ Size-Based
Colors intensity based on z-score of delta changes:
• Bright colors = Statistically significant delta (above strong threshold)
• Medium colors = Moderate delta (above moderate threshold)
• Dark colors = Normal/quiet delta
KEY FEATURES
◆ Kalman Filter Smoothing
Adaptive filtering reduces noise while staying responsive to genuine shifts in order flow. Adjust sensitivity with the Responsiveness and Kalman Gain settings.
◆ Inside Candle Rule
When enabled, prevents false signals from inside candles that show a direction change but lack conviction. The candle retains the previous trend's color (dimmed) instead of flipping.
◆ Session Anchoring
Optionally reset cumulative delta at a specific time (e.g., market open) for intraday analysis.
◆ Z-Score Thresholds
Fine-tune what constitutes "strong" vs "moderate" delta activity for Size-Based coloring.
HOW TO USE
1. Add the indicator to your chart
2. Set your chart type to "Line" or bring the indicator to front via Visual Order → Bring to Front
3. Select your preferred Color Method
4. Look for:
• Sequences of bright cyan candles → Strong buying pressure / bullish momentum
• Sequences of bright red candles → Strong selling pressure / bearish momentum
• Fading colors → Weakening conviction, potential reversal or consolidation
• Color flips → Shift in order flow dominance
Notes
• This indicator estimates delta from OHLCV data. For true order flow analysis, consider using tick or trade data from your broker/exchange.
• Works on all timeframes and instruments with volume data.
• Best used in conjunction with support/resistance levels, market structure, or other confluence factors.

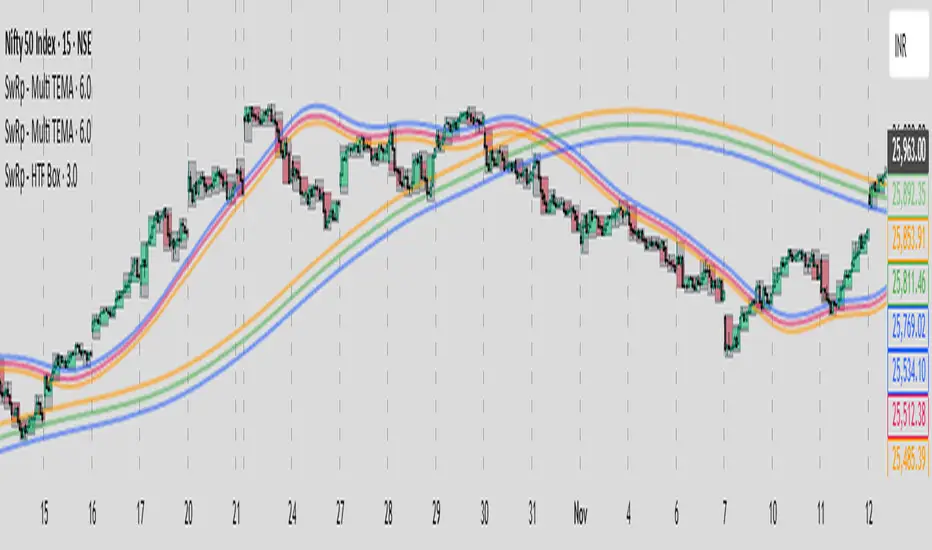
SwRp – HTF Candle Box OverlaySwRp – HTF Candle Box Overlay gives you a clear visual map of higher-timeframe candles directly on your lower-timeframe chart. Instead of switching timeframes, you can see the structure of each HTF candle plotted as colored boxes that update in real time as the candle forms.
Each HTF candle is drawn using two elements:
• A wick box showing the full high-to-low range
• A body box showing the open-to-close move with automatic bull/bear coloring
Both boxes follow the exact HTF open, high, low and close values, and they stay correctly anchored to price using bar-time positioning. You can customize opacity, body/wick visibility, border color, and the number of HTF candles to keep on the chart. The indicator automatically removes older candles when they exceed your set limit, so the chart stays clean.
This tool is ideal for traders who want to see HTF structure, zones, and candle behavior while analyzing entries and exits on smaller timeframes.
Key Features
• Overlay higher-timeframe candles on lower-timeframe charts
• Real-time updating of HTF candle body and wick
• Bull/bear body coloring with full opacity controls
• Independent toggles for body and wick fills
• Automatically remove older HTF candles to keep the chart clean
• Accurate price anchoring using bar-time for all boxes
• No extra lines, labels, or clutter — a clean visual multi-timeframe view
This indicator offers a simple, clear way to track the behavior of higher-timeframe candles without leaving your current chart, helping you combine HTF context with LTF execution more effectively.
TradingBee Money FlowTradingBee Money Flow
Most traders make the mistake of relying on a single indicator. RSI only looks at price. OBV only looks at volume. If you only look at one, you are missing half the picture.
TradingBee Money Flow solves this by calculating a weighted consensus of 10 different technical metrics combined into a single "Flow Score." It answers the most important question in trading: "Is the money actually backing up the price move?"
If Price goes UP, but this indicator goes DOWN, it’s a trap.
How It Works: The 3-Tier Logic
This script does not just average numbers; it weights them based on importance to creating a true "Composite Score" (-100 to +100).
Tier 1: Primary Volume Flow (50% Weight) The engine of the indicator. It measures raw capital entering/exiting.
MFI (Money Flow Index)
OBV Momentum (On-Balance Volume)
Chaikin Money Flow (CMF)
Tier 2: Secondary Momentum (35% Weight) Validates if the volume is actually moving price efficiently.
VWAP Oscillation
Accumulation/Distribution (A/D) Momentum
Klinger Oscillator
Elders Force Index
Tier 3: Confirmation & Volatility (15% Weight) Filters out fake-outs using volatility metrics.
RSI
ADX (Trend Strength)
Bollinger Band Width
The "Clean Divergence" Engine (Unique Feature)
Standard divergence indicators are "noisy"—they print signals on every small pivot. The TradingBee Money Flow uses a custom Clean Wave Filter to only identify high-probability reversals.
It requires two conditions to trigger a Divergence Signal:
The "Gap" Rule (Zero Cross): The indicator must cross the Zero Line in between two peaks. This ensures we are comparing two distinct waves of buying/selling, rather than just jagged noise in a single trend.
The "Shrinkage" Rule: The second wave must be significantly smaller (by a user-defined ratio) than the first. This confirms a true collapse in momentum.
How to Use This Indicator
1. The Histogram (Trend Following)
Bright Green: Buying pressure is accelerating. Strong Trend.
Dark Green: Buying is continuing, but momentum is slowing. Warning sign.
Bright Red: Selling pressure is accelerating.
Zero Line Cross: The definitive signal of a trend change.
2. The Lines (Reversal Trading)
🔴 Red Line (Bearish Divergence): Price made a Higher High, but Money Flow made a Lower High (with a gap in between). Smart money is selling into the rally. Look for Shorts.
🟢 Green Line (Bullish Divergence): Price made a Lower Low, but Money Flow made a Higher Low. Sellers are exhausted. Look for Longs.
Settings
Lookback Period: Adjusts the sensitivity of the composite score.
Pivot Lookback: Increases or decreases the strictness of the pivot detection.
Require Zero Cross: Keep checked for "Clean" signals. Uncheck to see standard divergences.
Wave Size Ratio: Defines how much smaller the second wave must be to trigger a signal.
Disclaimer: This tool provides market analysis but does not guarantee future results. Always manage your risk.

The Strat - Levels [rdjxyz]◆ OVERVIEW
The Strat - Levels dynamically displays key levels used in The Strat trading methodology, developed by Rob Smith. The level colors are dynamically determined by their Strat classification (1, 2 up, failed 2 up, 2 down, failed 2 down, 3)—making it easy to recognize higher timeframe Strat candle classifications from any lower timeframe.
◆ DETAILS
If you're unfamiliar with The Strat, there are 3 universal scenarios regarding candle behavior:
SCENARIO ONE
The 1 Bar - Inside Bar: A candle that doesn't take out the highs or the lows of the previous candle; aka consolidation.
SCENARIO TWO
The 2 Bar - Directional Bar: A candle that takes out one side of the previous candle; aka trending (or at least attempting to trend).
These can be broken down even further as follows:
2 Up: A candle that takes out the high of the previous candle and closes bullish
Failed 2 Up: A candle that takes out the high of the previous candle and closes bearish
2 Down: A candle that takes out the low of the previous candle and closes bearish
Failed 2 Down: A candle that takes out the low of the previous candle and closes bullish
SCENARIO THREE
The 3 Bar - Outside Bar: A candle that takes out both sides of the previous candle; aka broadening formation.
◇ HOW THE DYNAMIC LEVEL COLORING WORKS
PREVIOUS LEVELS
Previous Day High/Low
Previous Week High/Low
Previous Month High/Low
Previous Quarter High/Low
Previous Year High/Low
Each period's levels are compared to their previous period's levels and colored according to the 3 universal scenarios, which are fixed based on historical data. (No repainting)
CURRENT LEVELS
Current Day Open
Current Week Open
Current Month Open
Current Quarter Open
Current Year Open
Each current period's levels (high, low, and current price) are compared to the previous period's levels and current period's open on every tick—changing colors in real-time as their Strat classification changes. (Will repaint as price action evolves)
E.g. When a new day opens inside of the previous day's range (high/low) the Day Open line will be gray (default for inside bars). When the current day trades above the previous day's range, the Day Open line will become aqua (default for 2 up). If price trades back below the current day's open, the Day Open line will become fuchsia (default for failed 2 up). And if price trades below the previous day's range, the Day Open line will become dark purple (default for 3s).
◆ SETTINGS
Current Day Open
Previous Day High/Low
Current Week Open
Previous Week High/Low
Current Month Open
Previous Month High/Low
Current Quarter Open
Previous Quarter High/Low
Current Year Open
Previous Year High/Low
Strat Colors
Each Current Level Open has 4 inputs:
Show/Hide Checkbox
Line Style
Line Width
Label Offset (Integer)
Each Previous Level High/Low has 5 inputs:
Show/Hide High Checkbox
Show/Hide Low Checkbox
Line Style
Line Width
Label Offset (Integer)
And each Strat scenario can be custom colored:
1-Bar Color - Default Gray
2-Up Color - Default Aqua
Failed 2-Up Color - Default Fuchsia
2-Down Color - Default White
Failed 2-Down Color - Default Teal
3-Bar Color - Default Dark Purple
◆ USAGE
There are 3 ways to look at these levels:
Potential continuation (e.g. Previous Day's 2-Up High being broken by Current Day's Price)
Potential reversal (e.g. Previous Day's 2-Down High being broken by Current Day's Price)
Potential exhaustion risk (e.g. Previous Month's Low is broken by Current Day's Price but trades back up into the Previous Month's range)
It's best to use this indicator with a separate indicator that color codes your chart's candles according to their Strat Scenario (1, 2, 3) and use top-down analysis to gauge whether to view levels as a sign of continuation, reversal, or exhaustion risk.
◆ WRAP UP
As demonstrated, The Strat - Levels offers Strat Scenario color-coded key levels, making it easy to identify the previous period's Strat Scenario (1, 2-Up, Failed 2-Up, 2-Down, Failed 2-Down, or 3) without needing to manually plot levels or refer to higher timeframes.
◆ DISCLAIMER
This indicator is a tool for visual analysis and is intended to assist traders who follow The Strat methodology. As with any trading methodology, there's no guarantee of profits; trading involves a high degree of risk and you could lose all of your invested capital. Use of this indicator is not indicative of future results and does not constitute and should not be construed as investment advice. All trading decisions and investments made by you are at your own discretion and risk. Under no circumstances shall the author be liable for any direct, indirect, or incidental damages. You should only risk capital you can afford to lose.

First day of NIFTY Monthly ExpiryAutomatically identifies and marks the first Wednesday that occurs after the last Tuesday of each calendar month on your charts. Designed specifically for NSE traders using Indian timezone (GMT+5:30). Automatically adjusts for market holidays by marking the next available trading day. Handles cases where the Wednesday falls in the following month (e.g., Sept 30 → Oct 1).

Dynamic Support & Resistance ZonesDynamic Support & Resistance Zones
Overview
This indicator automatically detects and visualizes dynamic support and resistance zones based on pivot point analysis. Unlike simple horizontal lines, these zones adapt to market volatility using ATR and track how many times price has respected each level—giving you a real-time strength score for every zone.
How It Works
The indicator identifies swing highs and lows using pivot detection, then creates zones around these price levels. Each zone is continuously monitored for:
Touches: Every time price enters the zone and reverses, the touch count increases
Strength: A 0-100% score based on touch count and recency (zones fade over time if untested)
Breaks: When price closes beyond the zone for consecutive bars, it's marked as broken and removed
Nearby zones of the same type automatically merge to reduce clutter, and only the strongest zones are displayed based on your settings.
Features
🎯 Smart Zone Detection
Pivot-based identification of key price levels
ATR-adaptive zone width (adjusts to volatility)
Automatic merging of overlapping zones
📊 Strength Scoring System
Each zone rated 0-100% based on touches + time decay
Stronger zones appear more opaque
Weak/old zones automatically removed
🔔 Built-in Alerts
Alert when price approaches a zone
Alert when price breaks through a zone
📋 Info Panel
Shows count of active resistance/support zones
Displays nearest S/R levels above and below current price
Settings
Detection Settings
Pivot Lookback Length - Higher values find stronger but fewer levels (default: 10)
Zone Width (%) - Width of each zone as % of price (default: 0.5%)
Max Zones to Display - Limits visual clutter (default: 8)
Merge Distance (%) - Zones within this % are combined (default: 1.0%)
Zone Strength
Min Touches for Valid Zone - Zones need this many touches to display (default: 2)
Strength Decay (bars) - How quickly zones lose strength over time (default: 100)
Break Confirmation Bars - Consecutive closes needed to confirm a break (default: 2)
Visual Settings
Customize resistance/support colors
Toggle labels and strength display
Option to extend zones into the future
How to Use
For Entries:
Look for confluence when price approaches a high-strength zone (70%+)
Zones with 3+ touches have historically acted as strong reversal points
Use the "approaching zone" alert to get notified before price reaches key levels
For Exits/Targets:
Set profit targets at the nearest resistance (for longs) or support (for shorts)
The info panel shows these levels in real-time
For Breakout Trading:
Watch for breaks of high-touch zones—these often lead to momentum moves
Use the "broke zone" alert to catch breakouts as they happen
Best Practices
On higher timeframes (4H, Daily): Use higher pivot lookback (15-20) for major levels
On lower timeframes (5m, 15m): Use lower pivot lookback (5-8) for scalping levels
For volatile assets: Increase zone width to 1-2%
For ranging markets: Lower min touches to 1 to see more potential levels
Notes
Zones are drawn from the time they were created, extending right
The indicator uses timestamps (not bar indices) so it works on any history length
Broken zones are automatically cleaned up to keep your chart clear
Tip: Combine with volume analysis or momentum indicators for confirmation before trading S/R levels.
If you find this indicator useful, please leave a comment with your feedback or suggestions for improvements!
RTH vs ETH Candle StylingRTH vs ETH Candle Styling — Clean Session-Based Candle Filters
This indicator restyles the chart’s candles based on session type:
🟩 RTH (Regular Trading Hours — 09:30 to 16:00 EST)
RTH candles display normal, full-color price action, showing momentum clearly during the primary US session.
⬛ ETH (Extended Hours Trading)
All ETH candles are converted into hollow, black-outline candles, with:
Transparent bodies
Black borders
Black wicks
This creates an immediate visual separation between overnight price action (ETH) and the high-liquidity RTH session—reducing noise and helping traders focus on true market structure.
🔥 Why Use This?
Cleaner chart during overnight chop
Easy to distinguish RTH orderflow from ETH drift
Enhances gap logic, session deviations, and liquidity mapping
Makes your main RTH setups stand out instantly
⚙ Inputs
Adjustable RTH session (default: 09:30–16:00 EST)
Adjustable timezone (default: America/New_York)
GLOBAL SETTINGS TO CHANGE-Change-settings-symbol-candles-uncheck all
