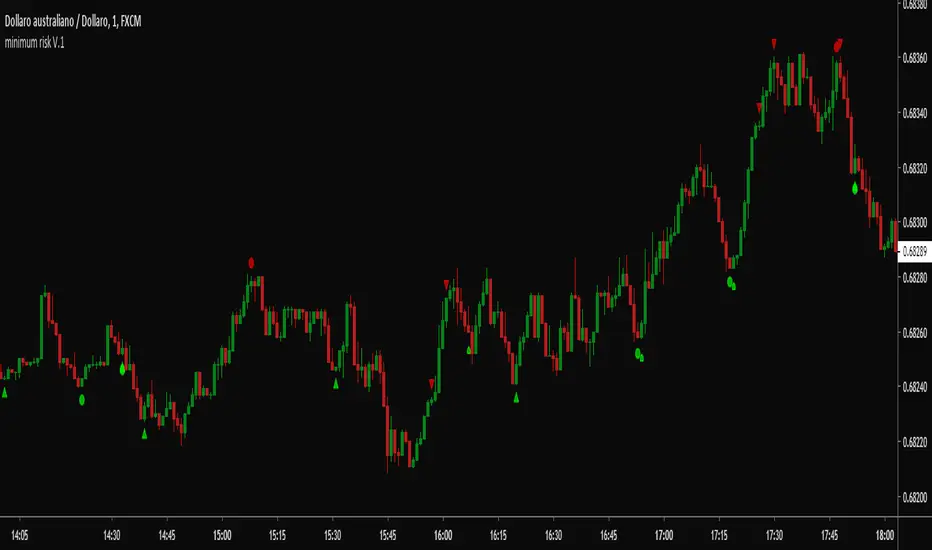
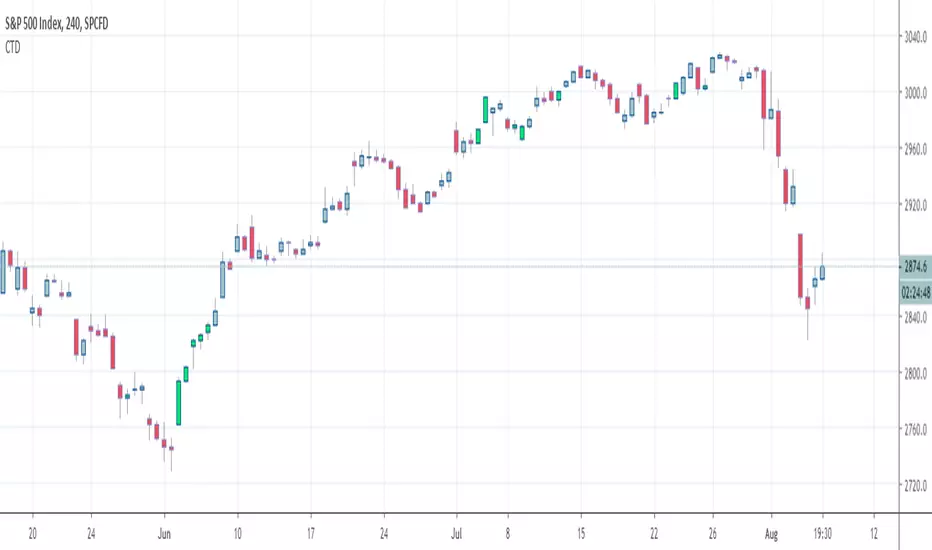
minimum risk V.1Was playing around and I've had this idea: most of day traders looking for catching price swings and sometimes they forgot about risk, so I was keeping focus not on price swings but on risk-momentum: the idea was to catch daily moments when the risk was minimum and this is the result.
There are some rules to use it correctly
1. Use it on lower timeframe (1M to 30M) best --> 1M to 5M
2. Do not open position on every signal !! keep focusing on the price
3. works better on Forex
upin and doin input: you can change it and you will see more signals but keep this inputs low as it is a filter I'm using for signals
I will update the indicator if I found new ideas
Enjoy!!
Candlestickpattern
Binary Options Arrows (example)An example of Binary Option Arrows (BOA) for candlestick patterns bearish and bullish harami.
With results as coloured background and an option to choose your expiration (one candle by default).
It's just an example for those who has their own strategy and wants to make nice arrows in their chart.
All you need to do is rewrite piece of script in lines 9:13 - feel free to ask me for any help.
Disclaimer: It's just an example how to script arrows for binary option trading, Poshtrader is not responsible for any loss of money by using this particular strategy.
Happy Trading

Candle Patterns AlertCandlestick pattern alerts for strategies "Candle Patterns Strategy" and "Candle Patterns Strategy - 2".
In order not to receive unnecessary signals, in the "Manage alerts" option should be selected "Once per bar close".
Daily Forex ArrowsArrows that will appear on the candles that follow one or more candle patterns, showing the possible market direction. It's best to enter when the new candle form, after the candle with the arrow appear. Daily chart it's the best on the backtests. Based with Forex markets.

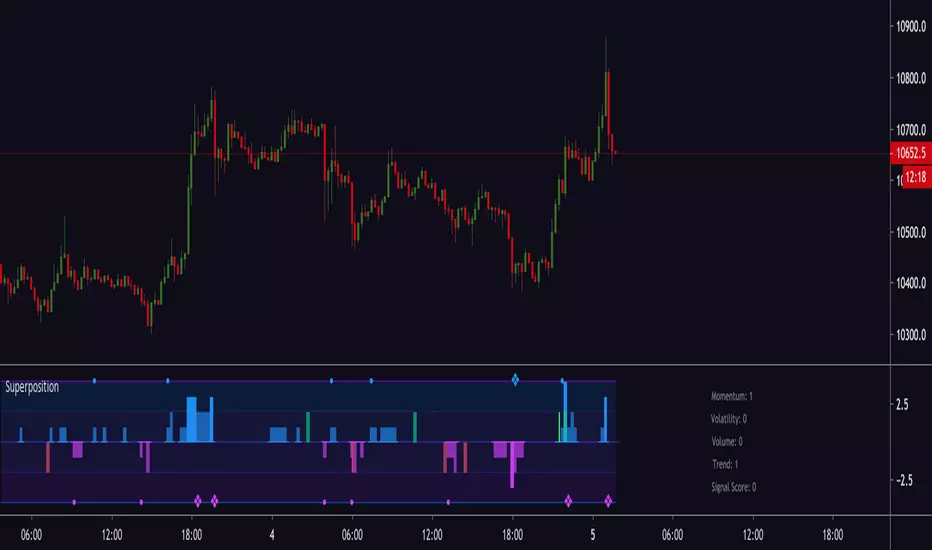
Magick SuperpositionExperimental histogram based on multi indicator signals.
Generates a score based on:
Trend
Volatility
Momentum
Price and volume changes
Candlestick patterns
and many more.
Can be used to detect top and bottoms, reversals, trend, best moments to enter a trade and more.
Invite-only.
Trial available.
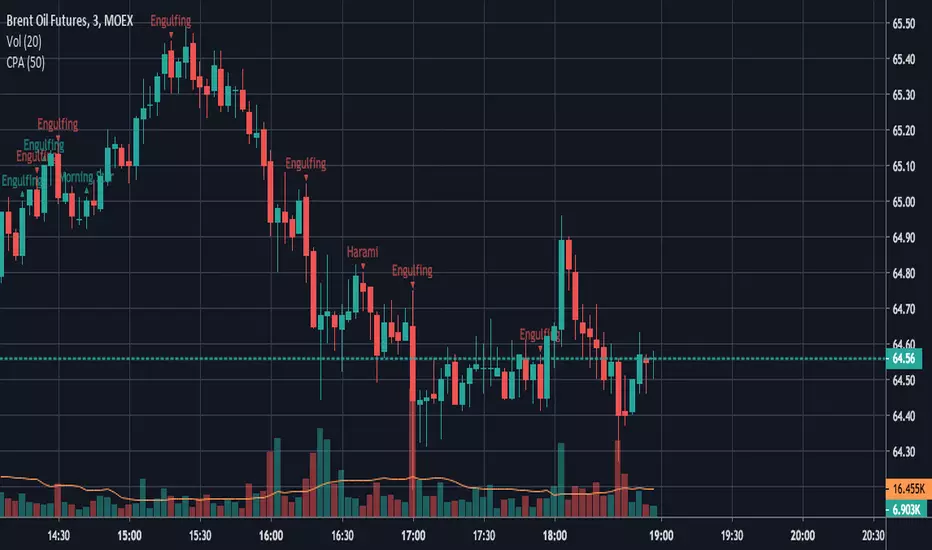
Engulfing Scanner v1This indicator helps you to quickly identify bullish and bearish engulfing patterns.
Works on currencies only (pips required).

Dark Cloud Cover Pattern Trading Setupthis study is another script based on the candlestick pattern . there are a few filters implemented to be applied to the output result to clear out noises. it sounds like finding real Dark Cloud Cover instances are too rare (interesting though!).
Dark Cloud Cover
it is a bearish reversal candlestick pattern where a down candle (typically bearish) opens above the close of the prior up candle (typically bullish) and then closes below the midpoint of the up candle. The five criteria for the Dark Cloud Cover pattern are:
An existing bullish uptrend.
An up (bullish) candle within that uptrend.
A gap up on the following day.
The gap up turns into a down (bearish) candle.
The bearish candle closes below the midpoint of the previous bullish candle.
all these criteria are implemented in code to produce a more accurate result.
please provide me with your valuable comments,
thanks for your attention,

Piercing Line Pattern Trading Setupthis study is the first one of a series of scripts based on the candlesticks pattern which will be published over time. There are several such scripts out there that can be found on TradingView but they seem to be inaccurate with a lot of noises and messy hard to understand code. In this script, I've tried to have a clean and easy to get
of the pattern itself and the method for detecting it with enough parameters to filter out the noises.
Piercing Pattern
A piercing pattern is a technical trading signal that is formed by a closing down day with a good-sized trading range, followed by a trading gap lower the following day with a bullish candlestick that covers at least half of the upward length of the previous day's bearish candlestick body, finishing with a close higher for the day. A piercing pattern often signals the end of a small to moderate downward trend. A piercing pattern can serve as a potential indicator for a bullish reversal. This pattern is formed by two consecutive candlestick marks. The first candlestick is bearish signifying a down day and the second is bullish signifying an up day. When a trader is watching for a bullish reversal any red candlestick followed by a green candlestick could be an alert. There are a few things that set a piercing pattern apart from a general red candlestick green candlestick pattern. In a piercing pattern, a green candlestick follows a red one with a significant gap in the red candlestick close and green candlestick open. On the second-day green candlestick, the candlestick’s body must also lengthen to cover at least half of the previous day’s red candlestick . Generally, the gap down and substantial increase to the closing price are good signs for a reversal. In a piercing pattern, the second-day green candlestick will close at or above the midpoint of the previous day’s red candlestick.
please provide me with your valuable comments,
thanks for your attention,

Candles - Cheat SheetWhat is up y'all ? (french trying to sound American)
I found that in my script archives, way back in an old cave. I think this might be useful as a few really asked me how to define a green/red candle, how to capture the wick value, the body, etc..
This is not a fancy script as usual and I'm sure they're plenty of candles pattern scripts out there but I saw no one sharing a simple candle cheat sheet for pinescript coding
Being able to define candles using codes is an essential skill to have for any Pinescripter
Still on the train so won't write a roman as usual... Kidding... I actually did it here What-is-an-Hard-Exit-and-a-few-notes-on-trading-management/
It won't bring me as many likes as any magic p**p cannon accounts promising the moon at each trade but if I can help at least 1 trader a day not losing his/her money, I'll be happy and my daily goal will be fulfilled
All the best
Dave
____________________________________________________________
Be sure to hit the thumbs up
- I'm an officially approved PineEditor/LUA/MT4 approved mentor on codementor. You can request a coaching with me if you want and I'll teach you how to build kick-ass indicators and strategies
Jump on a 1 to 1 coaching with me
- You can also hire for a custom dev of your indicator/strategy/bot/chrome extension/python
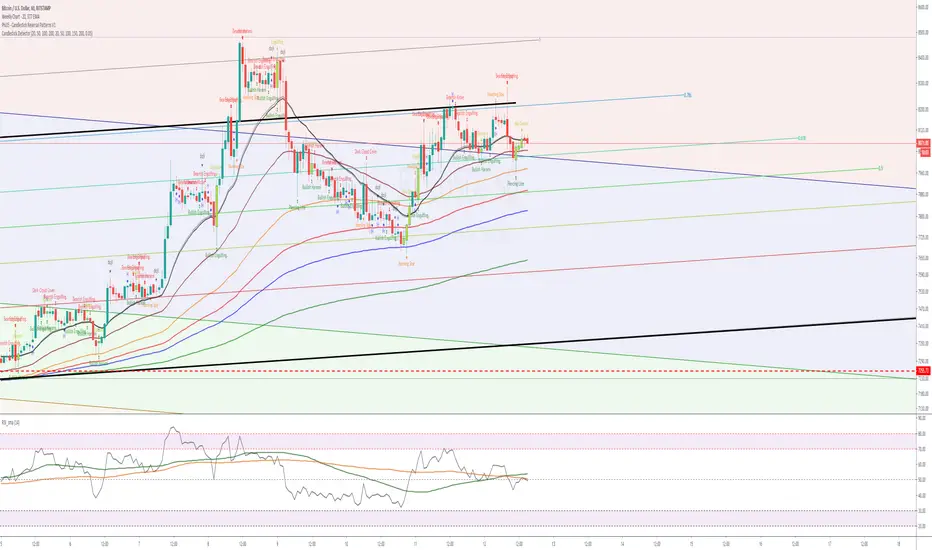
Candlestick.Detector.with.SMA.EMACandlestick Pattern Detector with
2 x MA optional (20, 200)
2 x EMA optional (50,200)
Incldudes
Doji = color > #050800
Shooting Star, color > orange, shape=arrow down
Evening Star, color > red, shape = diamond
Morning Star, color=orange, shape = diamond
Hammer, color=blue, shape = diamond, text="H"
Inverted Hammer, color=blue, shape = diamond, text="IH"
Bearish Harami", color=red, shape =arrowdown, text="Bearish Harami"
Bullish Harami", color=green, shape = arrowup, text="Bullish Harami"
Bearish Engulfing", color=red, shape = arrowdown, text="Bearish Engulfing"
Bullish Engulfing", color=green, shape.arrowup, text="Bullish Engulfing"
Piercing Line", color=green, shape = arrowup, text="Piercing Line"
Bullish Belt", color=green, shape = arrowup, text="Bullish Belt"
Bullish Kicker", color=green, shape.arrowup, text="Bullish Kicker"
Bearish Kicker", color=red, shape.arrowdown, text="Bearish Kicker"
Hanging Man", color=red, shape=arrowdown, text="Hanging Man"
Dark Cloud Cover", color=red, shape =arrowdown, text="Dark Cloud Cover."
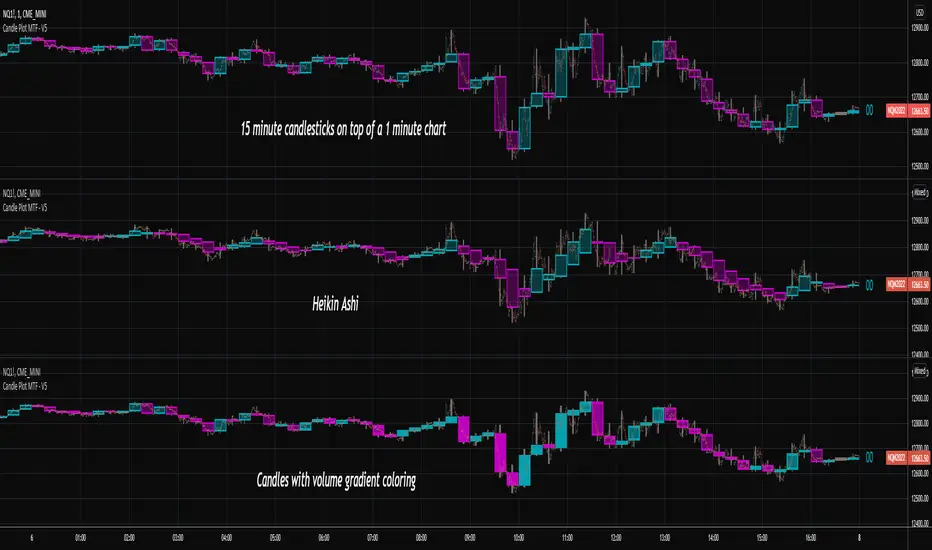
Candlestick Plot MTFPlots the live non-repainting candles for a higher time interval than the chart interval.
Features:
Configuration of the look and feel of the MTF candles.
Live candles update as the price action evolves for the session.
Historical candles can be toggled on/off.
Includes a moving average ribbon that is also MTF, matching the interval chosen.
Please watch this video to understand more:
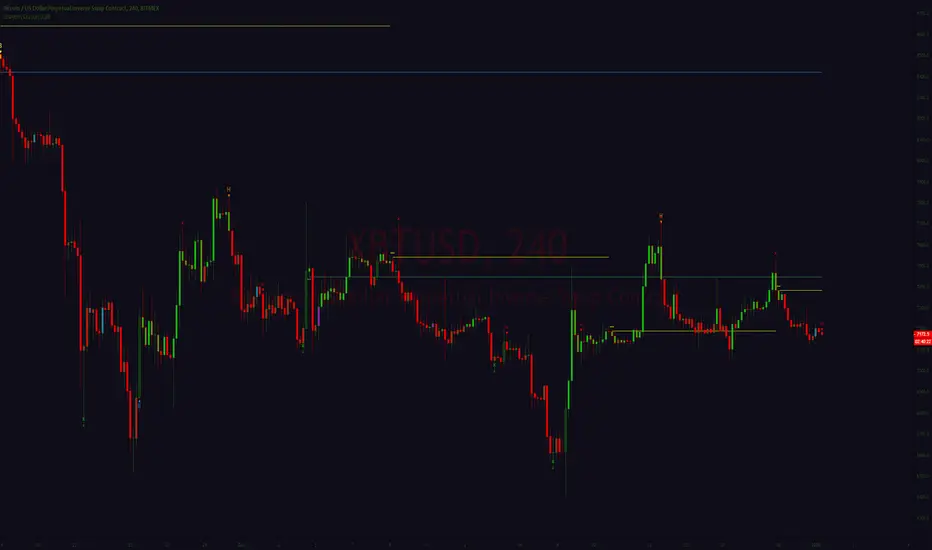
Crayons GrayonsUpdate for
Crayons 0.2
Crayons is early onset hyper customizable trend reversal trading suite
There is some big changes for Signal and Pivot generation and its set as Default mode so in case of nostalgia for white noise there is an option to "rollback" placed at the top of input menu
As always- hyper customizable
Every singal core crayon signal group will be turned on by default so open input menu for personalizing signals to charts and personal character
Crayons 0.2-
Greatly improved Signal quality
Improved Pivot detection logic
Two Set's of Pivots "Cleaned" and "Vanilla"
Optional Polichrome candle painter mode to provide additional information on demand
Optional Labels for signals and pivots
Secondary risk filter filtering "riskier" signal sequences (Experimental)
Second MA is changed by ATR modified to work as trailing S/R (Source is ohlc4 for whip protection model is experimental ,filters used is not suitable for micro tf so atr calls for higher periods, its experimental and will be fixed or removed with later updates, added for testing purposes)
Engulfing Candles DetectorHello traders
Credit to HPotter for that script
I took his script and added alerts to it. 2 lines lol
But anyway, useful to detect reversals by coloring bullish/bearish engulfing candles :)
Enjoy
David

Cardistry ♠♥♦♣♠♥As always -No repaint, Signals are real time♦♣
First release version is not tunned, parameters need testing and manual tuning from users
Label meanings and color is self explanatory and pretty straight forward
Signals deviate from Candlestick sequences and Volatility

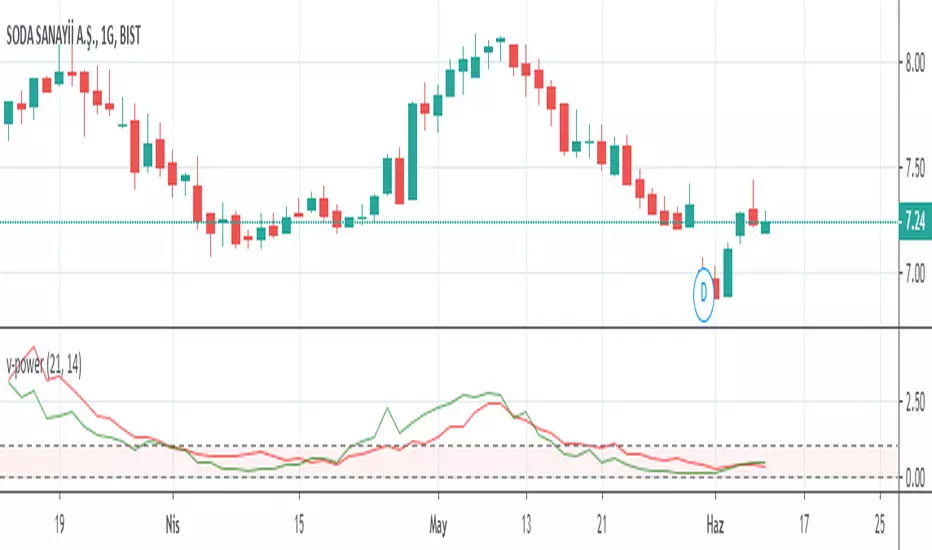
v-powerThe command determines the bottom and peak regions of the trend within the given range by analyzing the price movements with the transaction volume. It enables them to prepare themselves for long and short positions that are most suitable for the investor.
(Komut fiyat hareketlerini işlem hacmi ile analiz ederek verilen aralıkta trendin dip ve zirve bölgelerini belirlemektedir. Yatırımcı için en uygun long ve short pozisyonlarına kendilerini hazırlamalarını sağlamaktadır. )
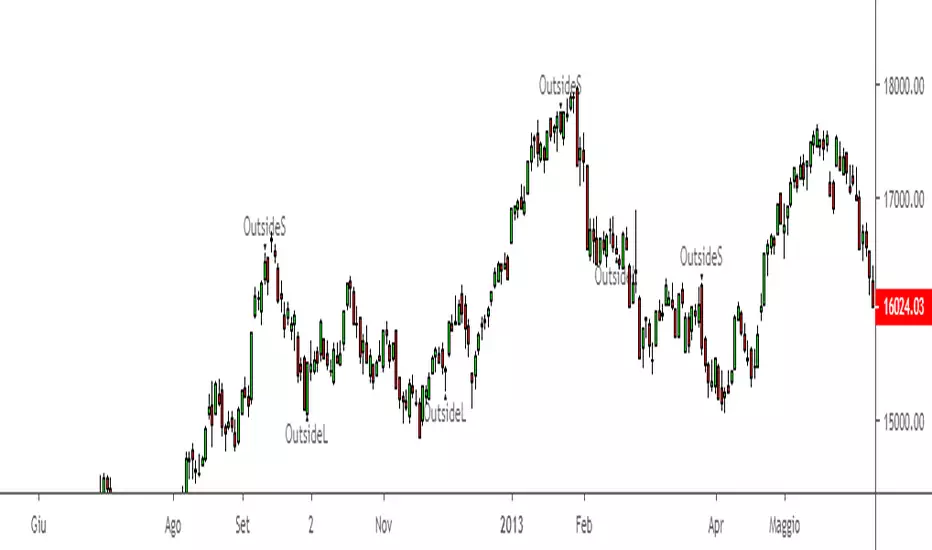
Outside pattern di Larry WilliamsOggi condivido con voi questo fantastico pattern, trovato sul libro "I segreti del trading di breve termine", che potete inserire anche voi sui vostri grafici cercando tra gli indicatori "Outside pattern Larry Williams {lucaBono}". Secondo quanto descritto da Larry, contrariamente a come si pensa, quando troviamo sul grafico un outside con chiusura oltre il massimo o minimo del giorno precedente e la successiva apertura sopra o sotto la chiusura (dipende se outside positivo o negativo) abbiamo un segnale di ingresso long se l'outside è negativo e short se l'outside è positivo.
In questo script ho fatto in modo che quando le condizioni sono soddisfatte compare, sulla candela in cui effettuare l'ingresso, una freccia con direzione verso l'ingresso che si deve effettuare e la scritta "outsideL" per indicare ingressi long e la scritta "OutsideS" per gli ingressi short. Lui utilizza questo pattern sull'indice S&P500 e secondo le sue statistiche ha una percentuale di successo dell'85%. Mostrando il grafico del FTSEMIB possiamo notare che entrando in prossimità dell'apertura, quindi nel momento in cui vediamo spuntare l'indicazione sul grafico, abbiamo buone probabilità di successo nel breve termine, inoltre può dare un buon punto di partenza per un trade da tenere tramite trailing stop spostandosi su timeframe più bassi dopo l'ingresso.Generalmente come possiamo notare dal grafico quando vediamo comparire il segnale vuol dire che siamo vicini ad una zona di massimo o minimo di breve.
Today I share with you this fantastic pattern, found on the book "The secrets of short-term trading", which you can also insert on your charts. As described by Larry, contrary to how we think, when we find on the graph an outside with closing beyond the maximum or minimum of the previous day and the subsequent opening above or below the closure (depends on whether positive or negative outside) we have an input signal long if the outside is negative and short if the outside is positive.
In this script I made sure that when the conditions are met, an arrow appears with the direction of the entrance on the candle where you want to enter and the word "outsideL" to indicate long inputs and the word " OutsideS "for short entries. He used (or uses, I don't know) this pattern on the S & P500 index and according to his statistics has an 85% success rate. Showing the graph of the FTSEMIB we can see that entering near the opening, so when we see the indication on the graph tick, we have a good chance of success in the short term, also can give a good starting point for a trade to be held by trailing stop moving to lower timeframe after entry.Generally as we can see from the graph when we see the signal appear, it means that we are close to a zone of maximum or minimum of short.

High Performance Candlestick Patterns Colors//Candle Patterns Ranked by Performance THOMAS N. BULKOWSKI
//1. Bearish Three Line Strike +Up 67.38%
//2. Bullish Three Line Strike -Down 65.23%
//3. Bearish Three Black Crows -Down 59.83%
//4. Bearish Evening Star -Down 55.85%
//5. Bullish Upside Tasuki Gap +Up 54.44%
//6. Bullish Inverted Hammer -Down 51.73%
//7. Bullish Matching Low -Down 50.00%
//8. Bullish Abandone Baby +Up 49.73%
//9. Bearish Two Black Gapping -Down 49.64%
//10. Brearish Breakaway -Down 49.24%
//11. Bullish Morning Star +Up 49.05%
//12. Bullish Piercing Line +Up 48.37%
//13. Bullish Stick Sandwich +Up 48.20%
//14. Bearish Thrusting Line During Dowtrend +Up 48.10%
//15. Bearish Meeting Line +Up 48.07%
//Down=Yellow Bar Color and Black Text
//Up=Blue Bar Color and Blue Text
//High Performance Candlestick Patterns Colors Top 15

High Performance Candlestick Patterns//Candle Patterns Ranked by Performance THOMAS N. BULKOWSKI
//1. Bearish Three Line Strike +Up 67.38%
//2. Bullish Three Line Strike -Down 65.23%
//3. Bearish Three Black Crows -Down 59.83%
//4. Bearish Evening Star -Down 55.85%
//5. Bullish Upside Tasuki Gap +Up 54.44%
//6. Bullish Inverted Hammer -Down 51.73%
//7. Bullish Matching Low -Down 50.00%
//8. Bullish Abandone Baby +Up 49.73%
//9. Bearish Two Black Gapping -Down 49.64%
//10. Brearish Breakaway -Down 49.24%
//11. Bullish Morning Star +Up 49.05%
//12. Bullish Piercing Line +Up 48.37%
//13. Bullish Stick Sandwich +Up 48.20%
//14. Bearish Thrusting Line During Dowtrend +Up 48.10%
//15. Bearish Meeting Line +Up 48.07%
//Down=Yellow Bar Color and Black Text
//Up=Blue Bar Color and Blue Text
//High Performance Candlestick Patterns Top 15

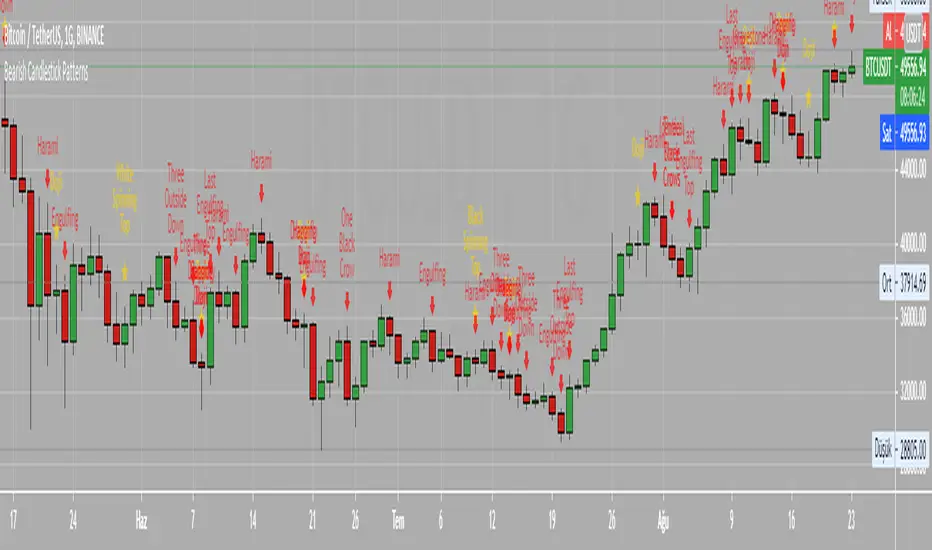
Bearish Candlestick PatternsDoji
Black Spinning Top
White Spinning Top
Bearish Abandoned Baby
Bearish Advance Block
Bearish Below The Stomach
Bearish Belt Hold
Bearish Breakaway
Bearish Counter Attack Lines
Bearish Dark Cloud Cover
Bearish Deliberation Blok
Bearish Descending Hawk
Bearish Doji Star
Bearish Downside Gap Three Methods
Bearish Downside Tasuki Gap
Bearish Dragonfly Doji
Bearish Engulfing
Bearish Evening Doji Star
Bearish Evening Star
Bearish Falling Three Methods
Bearish Falling Window
Bearish Gravestone Doji
Bearish Hanging Man
Bearish Harami
Bearish Harami Cross
Bearish Hook Reversal
Bearish Identical Three Crows
Bearish In Neck
Bearish Island Reversal
Bearish Kicking
Bearish Ladder Top
Bearish Last Engulfing Top
Bearish Low Price Gapping Play
Bearish Mat Hold
Bearish Matching High
Bearish Meeting Line
Bearish On Neck
Bearish One Black Crow
Bearish Separating Lines
Bearish Shooting Star
Bearish Side by side White Lines
Bearish Three Black Crows
Bearish Three Gap Up
Bearish Three Inside Down
Bearish Three Line Strike
Bearish Three Outside Down
Bearish Three Stars in the North
Bearish Thrusting Line During Dowtrend
Bearish Tower Top
Bearish Tristar
Bearish Tweezers Top
Bearish Two Black Gapping
Bearish Two Crows
Bearish Upside Gap Two Crows
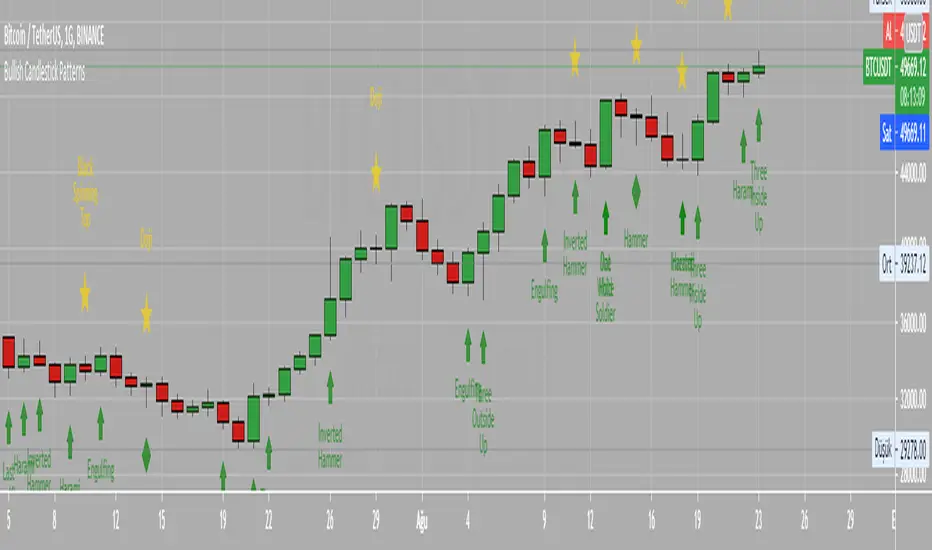
Bullish Candlestick PatternsBullish Abandone Baby
Bullish Above The Stomach
Bullish Belt Hold
Bullish Breakaway
Bullish Concealing Baby Swallow
Bullish Counterattack Lines
Bullish Deliberation Block
Bullish Descent Block
Bullish Doji Star
Bullish Downside Gap Two Rabbits
Bullish Dragonfly Doji
Bullish Engulfing
Bullish Hammer
Bullish Harami
Bullish Harami Cross
Bullish High Price Gapping Play
Bullish Homing Pigeon
Bullish Hook Reversal
Bullish Inverted Hammer
Bullish Island Reversal
Bullish Kicking
Bullish Ladder Bottom
Bullish Last Engulfing Bottom
Bullish Mat Hold
Bullish Matching Low
Bullish Meeting Line
Bullish Morning Doji Star
Bullish Morning Star
Bullish On Neck
Bullish One White Soldier
Bullish Piercing Line
Bullish Rising Three Methods
Bullish Rising Window
Bullish Separating Lines
Bullish Side by Side White Lines
Bullish Stick Sandwich
Bullish Takuri Line
Bullish Three Gap Downs
Bullish Three Inside Up
Bullish Three Line Strike
Bullish Three Outside Up
Bullish Three Stars in the South
Bullish Three White Soldiers
Bullish Thrusting Line During Uptrend
Bullish Tower Bottom
Bullish Tristar
Bullish Tweezers Bottom
Bullish Two Rabbits
Bullish Unique Three River Bottom
Bullish Upside Gap Three Methods
Bullish Upside Tasuki Gap
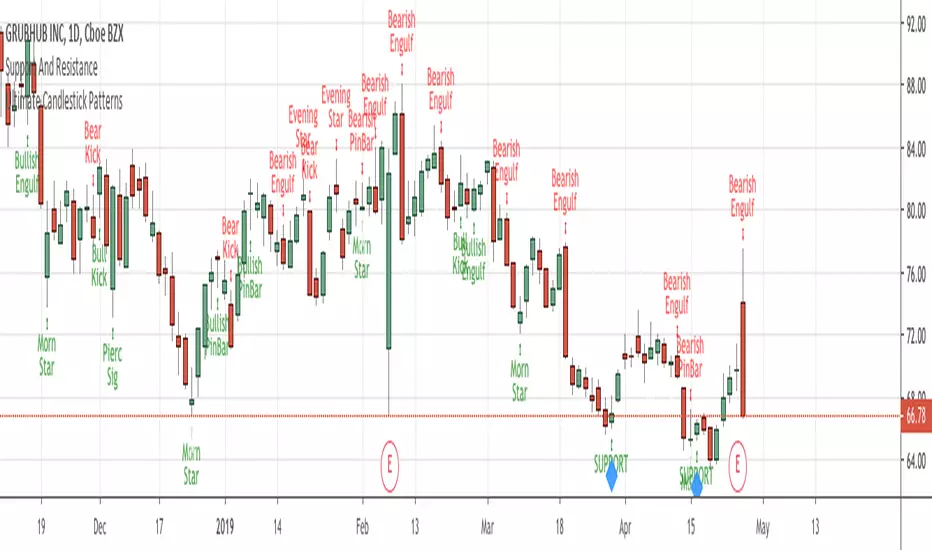
Advanced Candlestick Patterns [vitruvius]This is a very advanced indicator that detects most commonly used candlestick patterns. Please read this document carefully to understand how it works.
It is tailored to identify patterns that only have a great possibility of signaling a price movement. In other words, it can and will ignore some patterns, even though they satisfy the recognition conditions defined in the books. Candlestick patterns should also satisfy some other conditions in this indicator to be valid and you can modify those conditions.
This indicator is not only about identifying the candlestick patterns. By using the different choices, you can:
Avoid fake signals
Confirm patterns
Increase your possibility to win a trade
Reduce risk
Identify bullish/bearish movements better
Recommended Use
This indicator works best when you:
Use it in the daily time frame
Combine it with Support/Resistance areas
Note: For some candlestick patterns, you have the option of confirming the pattern with the next price action. In those cases, there will be obviously one bar delay (because it will wait for one more bar to close to confirm the pattern). However, it will mark the candlestick where it identifies the pattern and it will have ”Confirmed” in its text.
Important Note
This indicator does some serious calculations and checks for a lot of user inputs. Therefore, it might be a little slow. Please give it some time when it needs to do some computing.
MODULES
Trend Detection
Most of the patterns in this script are trend reversal patterns. So, recognition of the candlestick patterns depends heavily on the trend. In fact, even if you do not select a trend detection method, it will use the SMA method as default where it needs a certain trend in identifying a specific pattern.
It is possible to combine multiple trend detection methods. You can see how this affects the overall trend detection by enabling the background coloring.
Note: There might be some cases where a candle has a bullish/bearish confirmation of the same candlestick pattern . In those cases, the script is unable to identify the move and the user should decide if the identified pattern is bullish or bearish.
Below are the inputs of this module:
Color the background according to the trend?
If you select a trend detection method, it will color the background green for an uptrend and red for a downtrend .
Counter the trend when there is no obvious trend?
If you select multiple trend detection methods, there might be some cases where one of the methods indicates an uptrend and the other one indicates a downtrend . In that case, the script will continue with the previous trend (whatever the trend is one bar ago) by default . You can, however, reverse the trend in those cases by using this option. If you choose to reverse, you might catch the trend early .
Use MACD to detect the trend?
Use MACD to detect the trend. Whenever MACD delta is greater or equal to zero, it is an uptrend .
MACD Fast Length
Fast length of MACD.
MACD Slow Length
Slow length of MACD.
MACD Signal Smoothing
Signal smoothing value of MACD. Please note that it is set to 6 by default.
Use SMA to detect the trend?
Use SMA to detect the trend. If the price closes above the SMA line, it is an uptrend
SMA Length
Length of SMA.
Use the average price of previous candles to detect the trend?
If the average of open and close prices constantly go up for n bars that are determined by the next user input, it is an uptrend .
Number of candles to analyze
The number of bars ( n ) to analyze for the average price method.
Use the closing price of the previous candle to detect the trend?
If the difference between the current close and nth previous bar’s close is greater than the given threshold, it is an uptrend .
Position of the previous candle to analyze
Position of the bar (backward) to compare with the current close price.
Threshold for the closing price
The threshold value for closing price method.
Basic Candlestick Patterns
This module detects Doji, Spinning Top, Marubozu candlestick patterns. Also, you can set some specific options that are going to be used in all candlestick patterns.
Note: If you choose to manually enter the body height of a doji , you need to find the optimal value for different timeframes. Different timeframes have difference price action ranges.
Below are the inputs of this module:
Tolerate opening/closing price of the candle?
When a candlestick pattern needs to have a gap between two candles, you can tolerate the opening/closing prices of the one candle. This option is useful where the opening and closing prices are very close. This option is going to be used in all candlestick patterns.
Factor for tolerating opening/closing price
The more the factor is, the more the tolerance is.
Body/Height ratio for a candle to be considered as Bullish/Bearish
A bullish/bearish candle shouldn’t have too much shadow. You can use this option to determine the shadow length of a bullish/bearish bar. This option is going to be used in all candlestick patterns
Use basic candlestick pattern (Doji, Spinning Top, Marubozu)?
Detect doji, spinning top, marubozu candlestick patterns.
Manually set body of Doji?
You can manually set the body height of a doji. Otherwise, it will be calculated automatically. If you choose to use this option, then spinning top, and marubozu will also be calculated based on this.
Body of Doji
Body height of a bar to be considered as doji . Any bar with a body equal or less than the given value will be marked as doji. Only effective if you check the ”Manually set body of Doji?” option .
Verify a Doji by looking at the preceding candle?
If true, it will only mark dojis if the preceding candle is bullish or bearish.
Single Candlestick Patterns
This module detects Hammer, Hanging Man, Inverted Hammer, Shooting Star single candlestick patterns.
Below are the inputs of this module:
Confirm Single Candlestick Patterns with next closing price?
You can confirm a single candlestick pattern with the next closing price. That is, if the next candle closes above the previous one, it will confirm a bullish movement. If the next candle closes below the previous one, it will confirm a bearish movement.
Use Hammer and Hanging Man Single Candlestick Patterns?
Detect hammer and h anging man single candlestick patterns.
Use Inverted Hammer and Shooting Star Single Candlestick Patterns?
Detect inverted hammer and s hooting star single candlestick patterns.
Dual Candlestick Patterns
This module detects Engulfing, Tweezer Bottoms, Tweezer Tops, Harami, Inside Bar, Piercing Line, Dark Cloud Cover dual candlestick patterns.
Below are the inputs of this module:
Use Engulfing Dual Candlestick Pattern?
Detect engulfing dual candlestick pattern.
Validate Engulfing by comparing highs and lows?
If checked, the second bar must engulf the previous bar’s high/low also. If unchecked, the second bar should only engulf the real body of the first bar.
Use Tweezer Bottoms and Tops Dual Candlestick Patterns?
Detect tweezer bottoms and tweezer tops dual candlestick patterns.
Check the shadow equality of Tweezer Bottom and Tops?
Check if the shadows of the tweezer bars are about the same length.
Detect Harami Dual Candlestick Pattern?
Detect harami dual candlestick pattern.
Use High/Low of the second Harami candle instead of Open/Close price?
If checked, the body of the child must be within High and Low of the mother bar. Otherwise, only open/close prices will be checked.
Detect Inside Bar Dual Candlestick Pattern?
Detect inside bar dual candlestick pattern.
Treat Inside Bar as a reversal pattern?
If checked, inside bar will be treated as a bullish/bearish reversal pattern.
Check if the Inside bar formed in the upper/lower half of the Mother bar?
Check if the inside bar forms within the upper/lower body half of the mother. Then it will be treated as a bullish/bearish inside bar .
Detect the Inside Bar only if the previous candle closes outside of the Keltner channel?
This option effects identifying the inside bar . Such that, an inside bar will be detected only if the previous candle closes outside of Keltner Channel . Inside bars are effective when the market is extended and this is a nice way to check for that.
Confirm Inside Bar with the next close breaching the low/high of the inside bar?
Check if the next bar breaches inside bar’s high/low. Then it will be treated as a bullish/bearish inside bar .
Use Piercing Line and Dark Cloud Cover Dual Candlestick Patterns?
Detect Piercing Line and Dark Cloud Cover dual candlestick patterns.
Triple Candlestick Patterns
This module detects Morning Star , Evening Star, Three White Soldiers, Three Black Crows, Three Inside Up, Three Inside Down, Three Line Strike, Abandoned Baby, NR4, NR7 candlestick patterns.
Below are the inputs of this module:
Use Morning and Evening Star Triple Candlestick Pattern?
Detect morning and evening star triple candlestick patterns.
Don't allow the second candle's body to overlap with the first and third candle?
If checked, high and low of the second candle cannot overlap with the first and third candle for morning and evening star candlestick patterns.
The third candle must close beyond the midpoint of the first candle?
If checked, the third candle must close beyond the midpoint of the first candle for morning and evening star candlestick patterns.
Use Three White Soldiers and Three Black Crows Triple Candlestick Pattern?
Detect three white soldiers and three black crows triple candlestick pattern.
Compare bodies of Three White Soldiers and Three Black Crows candles?
You also have the possibility of comparing bodies of the candles in a way that every consecutive candle must have a bigger body than the previous candle.
Check if each candle (TWS&TBC) opens in the middle price range of the previous day?
You can check if each candle of three white soldiers and three black crows opens in the middle price range of the previous day.
Use Three Inside Up/Down Triple Candlestick Pattern?
Detect three inside up and three inside down triple candlestick pattern.
Check candles' bodies and closing prices for Three Inside Up/Down?
There are two different definitions for three inside up/down candlestick patterns. This option allows you to select one of those definitions. That is;
If unchecked , the second candle should make it up all the way to the midpoint of the first candle. Also, the third candle needs to close above the first candle’s high.
If checked , the second candle opens and closes within the real body of the first candle. Also, the third candle needs to close above the first candle's high.
Use Three Line Strike Candlestick Pattern?
Detect three line strike triple candlestick pattern.
Compare High/Lows instead of Open/Close for the Three Line Strike Pattern?
If checked, it will compare high/lows instead of open/close prices for the three line strike pattern.
Use Abandoned Baby Triple Candlestick Pattern?
Detect abandoned baby triple candlestick pattern. If you choose to tolerate opening and closing prices, high and low prices will also be tolerated for abandoned baby.
Use NR4 Candlestick Pattern?
Detect NR4 candlestick pattern.
Use NR7 Candlestick Pattern?
Detect NR7 candlestick pattern.
Confirm Narrow Range Candlestick Patterns with next closing price?
You can confirm NR4 and NR7 candlestick patterns with the next closing price. That way they will be identified as bullish or bearish patterns.
NOTES FROM THE AUTHOR
Please do not hesitate to contact me if you have any questions.
If you are not familiar with a specific candlestick pattern, try to google it. If you still need help, you can always contact me.
If you find a bug, or you think the indicator does not work as intended, please contact me with a screenshot of the chart. Also, please mention how you set up the user inputs.
If you have any ideas to further improve this indicator, please feel free to share it with me :)
LIKE , if you like it. SHARE if you think it would be useful for others too. FOLLOW for future updates and new indicators.