Bitcoin Movement vs. Coin's Movement MTFThis script tracks the percent change of Bitcoin vs. the percent change of the coin on the chart. Crypto markets are usually affected greatly by Bitcoin swings so being able to see if the given coin is trending above or below Bitcoin is useful market data. All choices made with this script are your own! Thanks.
Change

Signal Table - AutoFib - SMA - EMA - RSI - ATR - VolWith this indicator you can add a table on top of your chart.
What's in this table?
On which graph you open this table, the indicator data at the selected time of that graph are written. In the image below, you can see the table in the upper right.
You can also see two EMAs above the chart in this indicator. You can adjust their length.
You can add automatic fibonacci retracement levels to the top of the chart. In this way, you can see the Fibonacci levels on the chart and determine the support resistance. If the price is above the Fibonacci level, it will appear green on the chart, and red if below. You will understand as you use it.
It turns red if the RSI is below 30 and green if it is above 70.
Likewise, if the price is above the moving averages you have set, it appears as green, and if it is below it, it appears as red.
You can hide and activate the EMA and Fibonacci levels above the chart.
For example, you can get the ETH chart while the BTC chart is open in front of you. I think you will understand everything clearly from the settings tab below. Please support me. I hope you will be satisfied using it.

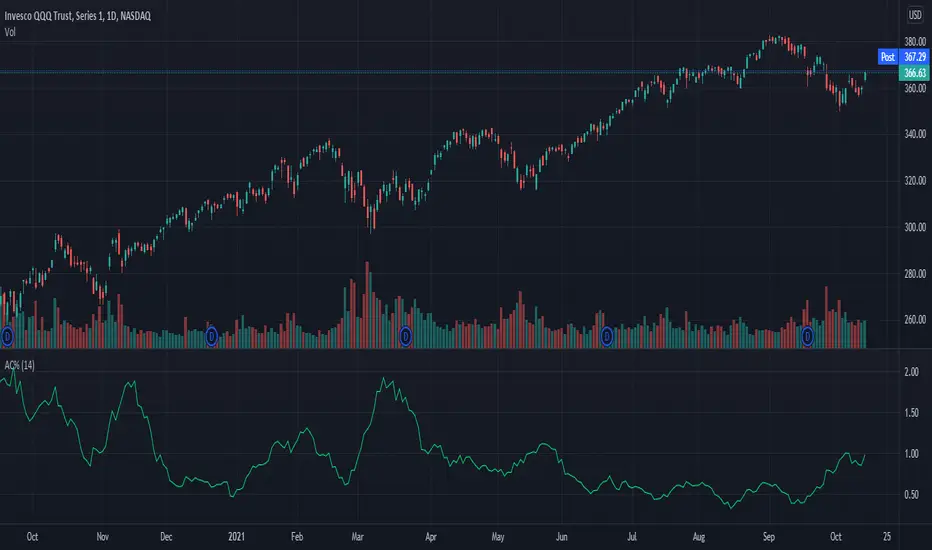
Average Change % (14-day)Simple script which calculates and shows the average change in a percentage format over a 14-day period.
Created due to the fact I couldn't find a percentage measure of average change when searching for it.
I have very little coding experience in Pine or otherwise so feel free to take and edit the script to make it a bit more user friendly.
% Divergence of RSIA simple script that plots the difference between the %ROC of price vs the %ROC of RSI, AKA the % of divergence. A simple way to analyze how strong a potential divergence is. Top reversals are above 0, bottom reversals are below. A value of 0 means price and RSI are changing by the same % value. So, if oscillator is moving up as price moves up, it means divergence is increasing. If oscillator moves down as price moves up, it means divergence is decreasing.

Screener Price Percentage ChangeA screener that displays price percentage change in actual chart timeframe and the default Daily, Weekly and Monthly.
The actual time frame also displays last value percentage change.
For example, if actual timeframe is "Monthly, it is going to display also the last "previous Monthly percentage price change.
Can select 3 more assets to display.
Full control of Panel position and size.
A modified version of @Mohamed3nan
Para el Shiaks

MTF Price/Volume % [Anan]Hello friends,
This is a multi-timeframe table with these features:
Display price change percentage compared with the last timeframe candle close.
Display price change percentage compared with the last timeframe candle close MA.
Displays change percentage compared with the last timeframe candle volume.
Displays change percentage compared with the last timeframe candle volume MA.
Change type/length of MA for Price/Volume.
Full control of Panel position and size.
Full control of displaying any row or column.

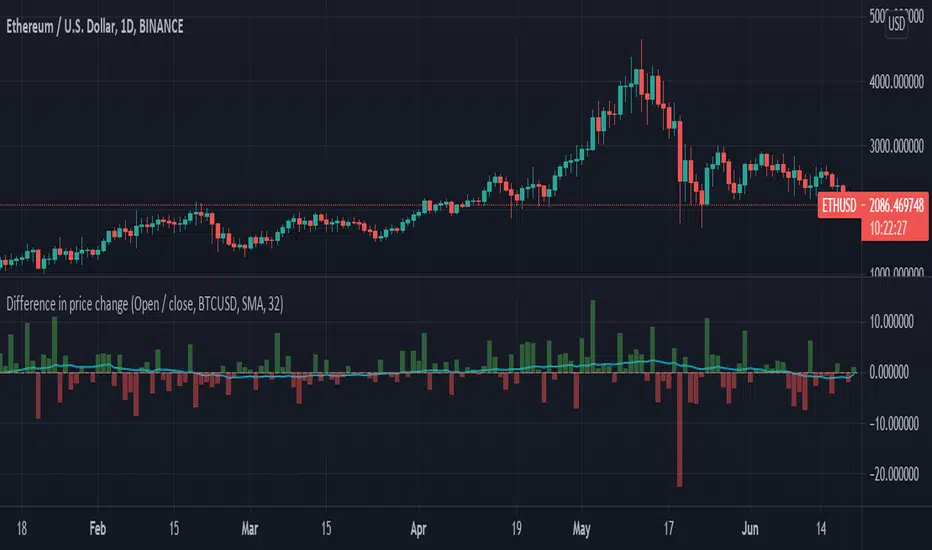
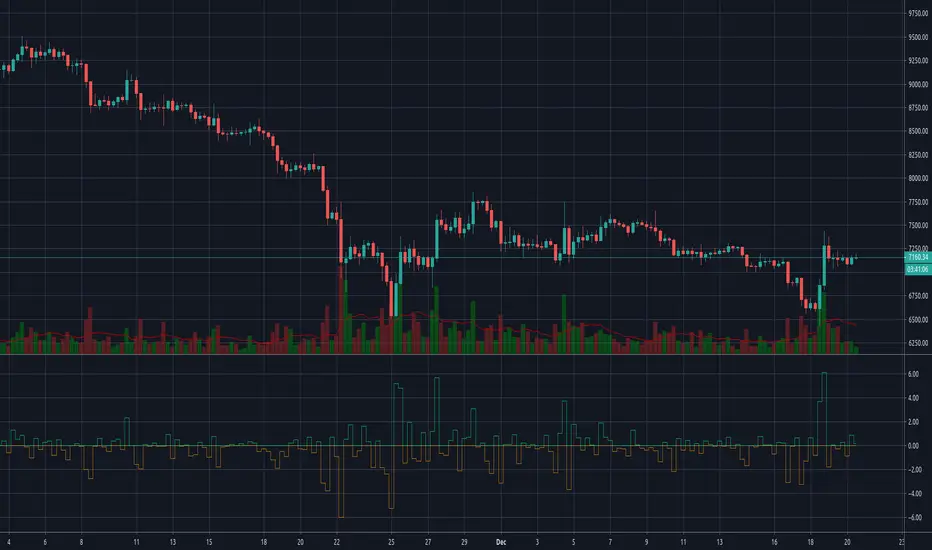
Difference in price changeCompares price change between current symbol and other one (eg. BTC vs S&P500). It calculates price change on each bar (from high to low or from open to close) and compares with price change of equivalent bar from the other source.
Example
Current symbol
open = 10 USD
close = 7 USD
change = -3 USD
% change = -30%
Second symbol
open = 3 USD
close = 4 USD
change = +1 USD
% change = +33%
Performance of price change = (-30) - (+30) = -63 // It means that current source has weaker performance right now
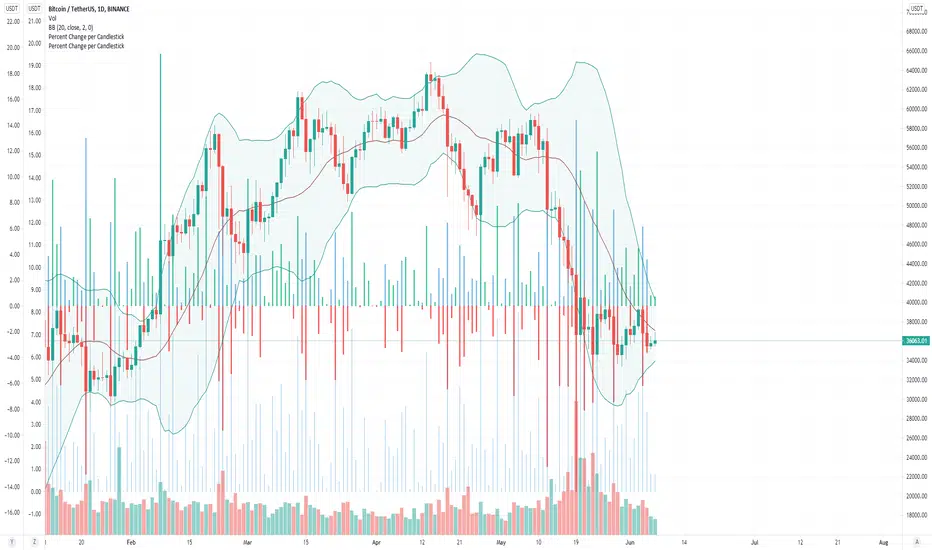
Percent Change per CandlestickThe script has two options: volatility (absolute value of change) and updown which has positive and negatives. That's it. useful for alerts.
Rate Of Change Bands [CC]The Rate Of Change Bands were created by Vitali Apirine (Stocks and Commodities March 2021 pg 14) and this indicator is a great method to not only check the momentum but also check the trend strength as well. I have color coded the lines so buy when the line turns green and sell when it turns red.
Let me know if there are any other indicators you want me to publish!

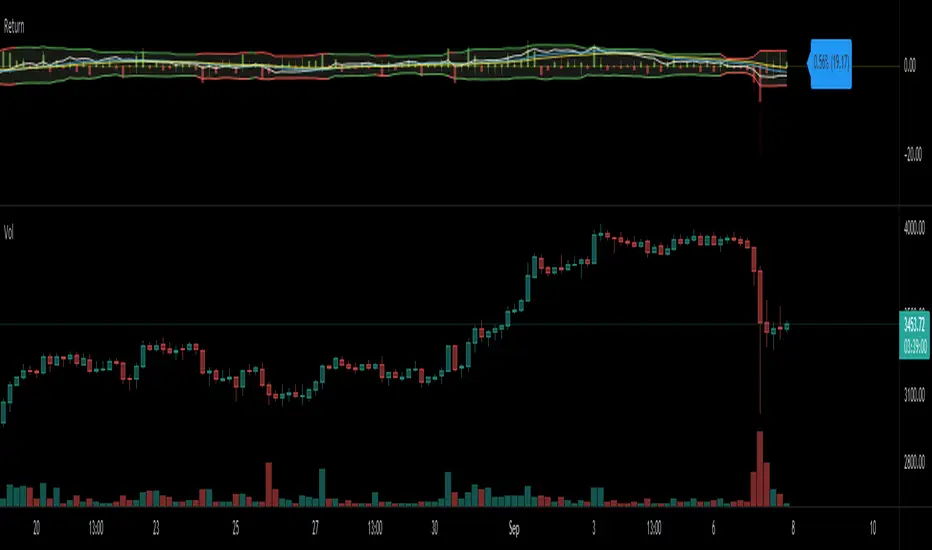
Return (Percent Change)This Script displays Regular or Log Returns as either a line or histogram and labels the current bar.
If something other than price is selected as the source, the result is percent change with a positive or negative slope.
If a moving average of price is used as the source, the result is analogous to a strength index
Other options include a look-back period adjustment (the default is 1),
smoothing results by converting to an EMA, and
Bollinger Bands with Length and Standard Deviation inputs.
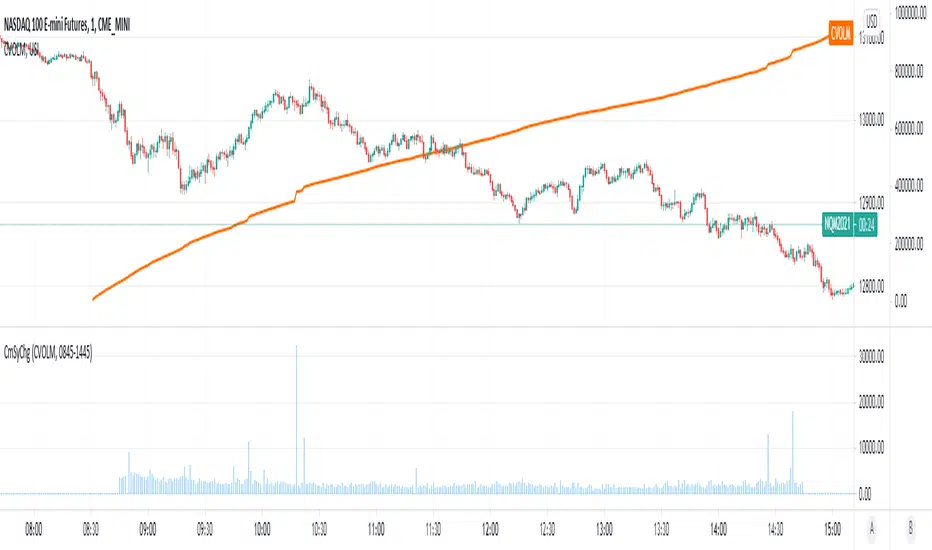
Cumulative Symbol ChangeSome symbols in trading view are cumulative - meaning they increment continuously throughout the trading day and are reset to 0 at the new trading day.
For example USI:CVOLM (Call Volume in Miami).
This script subtracts the current cumulative value from the prior cumulative value, so the change/delta in the cumulative value can be determined bar-by-bar.
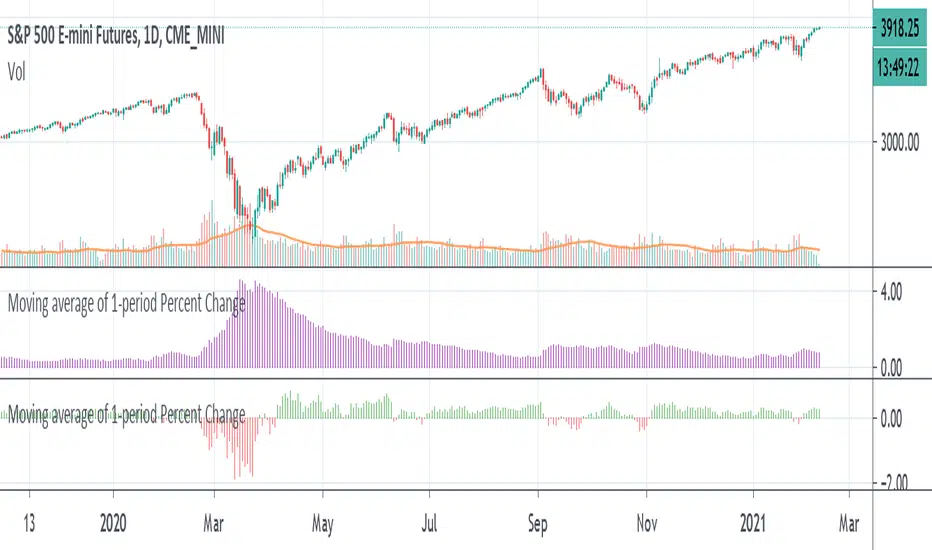
Moving average of 1-period Percent ChangeAnother way of finding the average range of the bars using 1 period percentage change of the price and taking an average of them. It's given in percentages and the absolute value of the average can be shown when the option is turned on, or the average including the up and down bars can be shown. Perhaps an alternative way of looking at volatility or range of the bars. If you prefer a line version over histogram, just simply change the style under the settings of the indicator.
Percent changeThis indicator shows WMA ribbons of the percentage of price movements.
Strong peaks show unusual price movement and might indicate a good time to close your position.
A narrow band shows stable price movement and could indicate a good time to get into a position. (Squeeze)

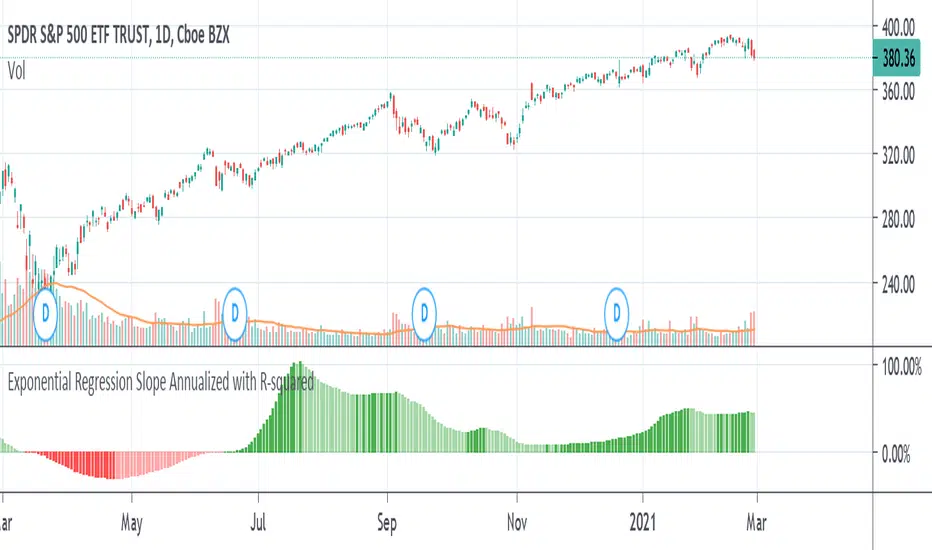
Exponential Regression Slope Annualized with R-squared HistogramMy other indicator shows the linear regression slope of the source. This one finds the exponential regression slope and optionally multiplies it by R-squared and optionally annualizes it. Multiplying by R-squared makes sure that the price movement was significant in order to avoid volatile movements that can throw off the slope value. Annualizing the exponential slope will let you see how much percentage you will make in a year if the price continues at its current pace.
The annualized number is the number of trading days in a year. This and the length might need adjusting for the extra bars that might be in futures or other markets. The number does not have to be a year. For example, it can be a month if you set the number to 20 or so trading days to find how much you would make in a month if price continues at its current pace, etc. This can also be used as an alternative to relative strength or rate of change.
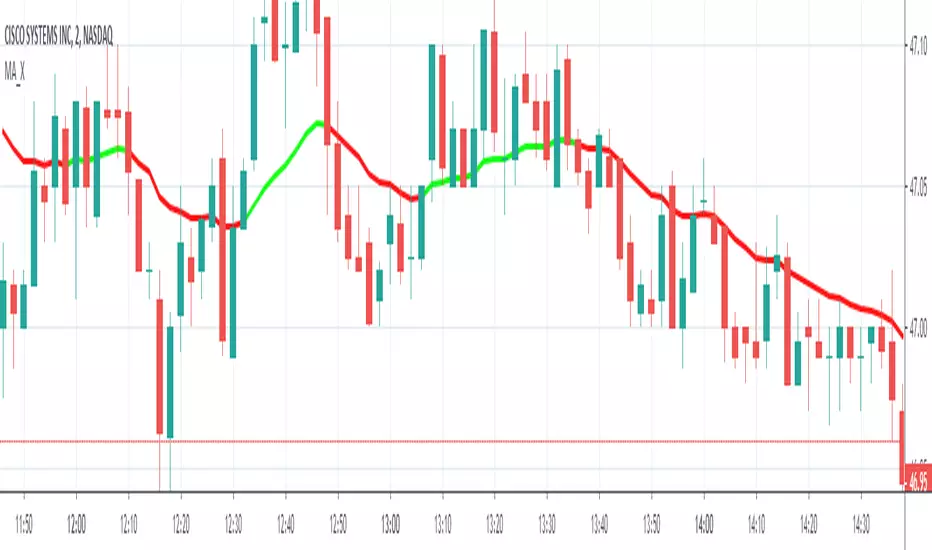
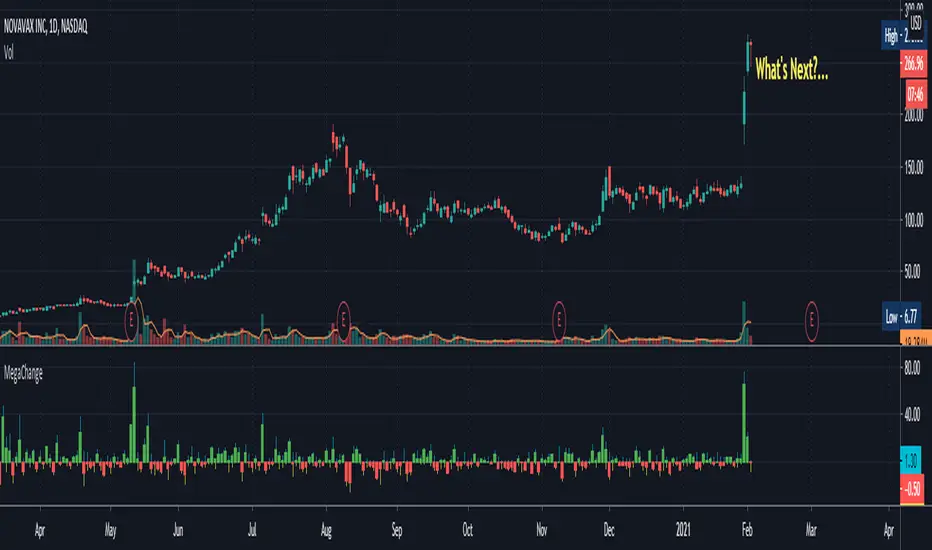
MegaChangeThe MegaChange indicator is a traditional Change - on steroids!
This indicator visualizes the Change from the current bar to the one before.
Besides showing the standard change (% change from the previous bar's Last to current bar's Last),
the indicator also includes the % change from the previous bar's Last
to current bar's High, and to current bar's Low.
The result is always in percentage.
"green" days and "red" days are separated so you can always see on the scales the change for
the last green day and the change for the last red day (only one of whom is the current change).
The indicator demonstrates "how far" the change has gone each way, and where is it currently.
Here's an example, using the chart above:
When we look at the big red candle we might see it as a very bad sign. (With the blue bubble next to it)
When we examine that candle with this indicator - the MegaChange - we can observe that the downside
is very small in comparison to the Upside that came before that. (Tagged as 1)
On the next candle (Tagged as 2) we can see a small tail representing the stock price going down
and coming most of the way back. returning from -16% to only -4% after moving more than +170% only 2 days earlier!
This might mean that the buyers are coming back and they're chasing the stock again for another run (long).
This is an example of how the indicator might indicate future moves, when we might think the move is already over.
Looking at the chart alone might be frightening, but using the indicator makes a change, as we can see that's the downside
was really small relative to the upside. The small tail from the last day might tell us that the buyers are coming back,
and that the stock might still have a potential Upside.
fill free to ask any questions, or tell me if you find this indicator helpful, and how.
Momentum Acceleration by DGTItalian physicist Galileo Galilei is usually credited with being the first to measure speed by considering the distance covered and the time it takes. Galileo defined speed as the distance covered during a period of time. In equation form, that is v = Δd / Δt where v is speed, Δd is change in distance, and Δt is change in time. The Greek symbol for delta, a triangle (Δ), means change.
Is the speed getting faster or slower?
Acceleration will be the answer, acceleration is defined as the rate of change of speed over a set period of time, meaning something is getting faster or slower. Mathematically expressed, acceleration denoted as a is a = Δv / Δt , where Δv is the change in speed and Δt is the change in time.
How to apply in trading
Lets think about Momentum, Rate of Return, Rate of Change all are calculated in almost same approach with Speed
Momentum measures change in price over a specified time period,
Rate of Change measures percent change in price over a specified time period,
Rate of Return measures the net gain or loss over a specified time period,
And Speed measures change in distance over a specified time period
So we may state that measuring the change in distance is also measuring the change in price over a specified time period which is length, hence
speed can be calculated as (source – source )/length and acceleration becomes (speed – speed )/length
In this study acceleration is used as signal line and result plotted as arrows demonstrating bull or bear direction where direction changes can be considered as trading setups
Just a little fun, since we deal with speed the short name of the study is named after famous cartoon character Speedy Gonzales
Trading success is all about following your trading strategy and the indicators should fit within your trading strategy, and not to be traded upon solely
Disclaimer: The script is for informational and educational purposes only. Use of the script does not constitutes professional and/or financial advice. You alone the sole responsibility of evaluating the script output and risks associated with the use of the script. In exchange for using the script, you agree not to hold dgtrd TradingView user liable for any possible claim for damages arising from any decision you make based on use of the script

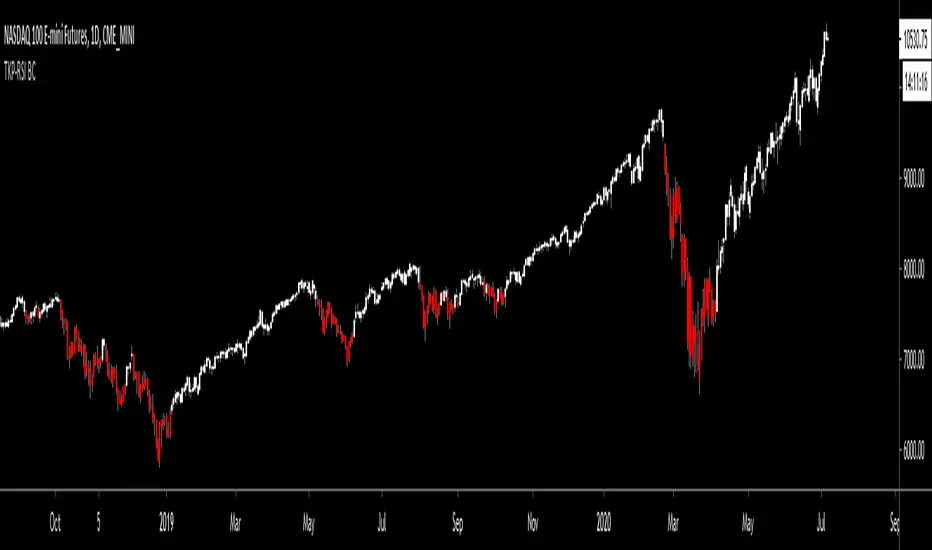
TKP RSI BAR COLORThis script was influenced by Scilentor's- "RSI Bar Colors / Scilentor". I improved upon the Idea by adding the ability to change the full range of RSI (Between 0 through 100) to any color you want within 5 point increments.
Traditional use of RSI is to use it as an "Overbought" and "Oversold" indicator. A more uncommon/unknown use, especially among new traders, is to use is as a "Momentum" indicator. I personally like to look for stocks where RSI>50
Default settings are set to color all bars red when below 50, and white when above 50, but try for your self setting different colors above 70, and below 30 to better see overbought and oversold conditions. I got a lot of requests for this script and I hope it helps you in your trading journey :-)
Nth Order Differencing Oscillator Perform higher order differencing through convolution, the result is equivalent to cascading N momentum oscillators of periods P :
mom(mom(mom(mom(x,P)...,P)
Settings
length - Period of the oscillator, indicate the lag to use (equivalent to the period in a momentum oscillator)
order - Differencing order, indicate how many times differencing is performed (number of times a momentum oscillator is cascaded)
src - Input of the indicator
Usage
Differencing consists in subtracting an input to a previous input, this is what the momentum oscillator performs. This is often done in order to remove longer-term variations in the price. Differencing also induces a 90-degree phase shift for all sinusoids in a signal, this is why oscillators can have this leading effect, as such higher differencing can sometimes help have a faster and more visible lead.
In red the indicator with period 50 and differencing order 2, below a momentum oscillator of the same period.
It is important to note that differencing is an operation that increases noise, in fact, you might have seen some oscillators use the median price hl2 instead of the closing price, this is because the median price contains less noise than the closing price, as such more differencing require a smoother input.
Here both the sma and the oscillator period are equal to 20 with a differencing order of 5.
In time series analysis the order of differencing is chosen depending on the order of integration, more simply put we should choose a differencing order that responds to the question: "How many time should I differentiate my time series so that the result is stationary?", for stocks prices this differencing order should be 1.
Technically speaking differencing orders higher than 3 might be overkill, as higher orders return noisier outputs that might no longer be representative of the original input.
here a period of 14 with differencing order of 20 is used, we can see more periodic results but they are not really representative of the closing prices.
Details
Simple differencing is actually achieved thought convolution, if we take a first-order difference x - x(1) , we can see that this is equivalent to 1*x + -1*x(1) , the coefficients are 1 and -1, for the momentum oscillator the difference is that the coefficients include 0 values. So we only need a function generating the coefficients of our Nth order difference oscillator, in order to get them lets analyze the impulse response of a cascaded change function.
Here 5 change function are cascaded, the coefficients are: (1,-5,10,-10,5,-1)
If you look at these coefficients and the ones of higher/lower order differences we can deduce various things
The impulse response is symmetric
The first coefficient is always 1 and the last always -1
The number of coefficients increase with higher differencing orders
The sign of the current coefficient is different from the sign of the previous one
From the shape of the impulse response, we can deduce that the coefficients of an Nth order differencing operator is a windowed series of 1,-1,1...,-1 , and that's actually the case, for an Nth order differencing operator the values of this window are given by the Nth row of the Pascal triangle.
There are various ways to get the values in the row of the Pascal triangle, one involving using the combination formula, however, we can do it way faster by using the recursive formula used in line number 13. Now that we have our coefficients we only need to separate them with 0 values and that's all.
Conclusion
We can see that oscillators are noisier than the original input signal, this is can be a desired effect in order to make lagging indicators more reactive, but it can also be overlooked due to the results appearing leading the price or just looking more predictable, however, we should note that higher-order differencing does not provide a consistent nor reliable solution toward minimizing lag, nor does classical oscillators.
The indicator is not useful, but if for some reason you require a lot of differencing operations to be done and don't want to use consecutive change or mom functions, then this script might results useful to you.

COVID-19: Daily changeNew daily infections (daily change) of COVID-19.
The chart shows new daily cases across the entire planet, the US, EU (de+fr+it+es only) and a small country (RO) that does not matter to anybody but me. You can show/hide different country in Settings.
Select "COVID-19: CONFIRMED" data in main chart and add the indicator.

Any Security vs. Any Security Change Comparison [BigBitsIO]This script allows you to compare the percentage-based change in the price of any two securities on any given (and supported) timeframe on the chart. This can give you a very simple way to compare any two securities against one another.
Ex: If your base security gained 5%, and the other security gained 3% in a single day, the change comparison would show a green bar of 2% because your base security outgained your other security by 2%.
Features:
- 2 securities to compare. A base and other.
- Shortlist of default securities to choose from.
- Ability to override the default securities list and use any security supported by TradingView. You must use the correct security string to do so.
- Resolution is tied to whatever the current chart is using. This way the view of the indicator always reflects the correct resolution of the chart.
- If either market has a 0% change, it is considered likely closed during that period and will result in a change of 0%, as they shouldn't be compared at that time.

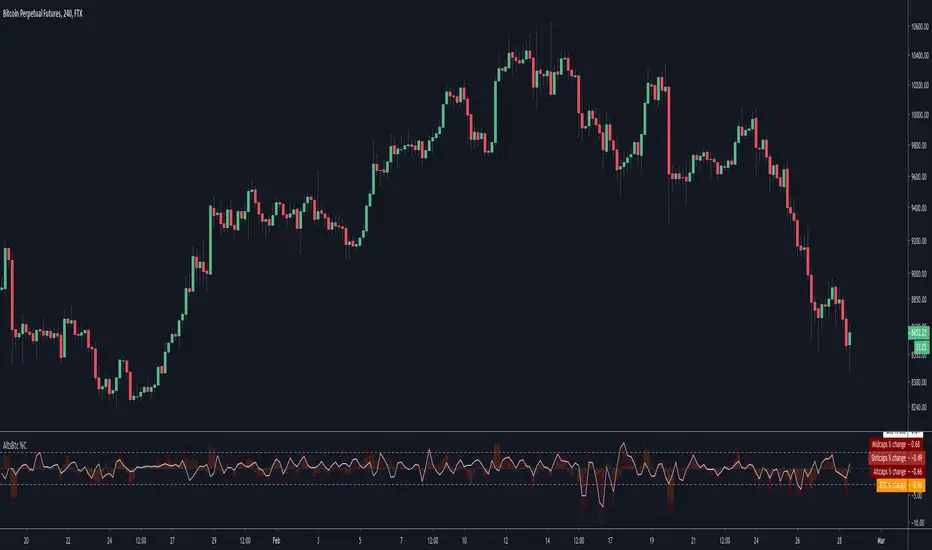
Alts vs Btc percentage changesCatch differences and over-corrections between Alts and Bitcoin via Ftx's indexes
A more visual description : i.imgur.com
Rate of change[UO]Shows the rate of change of prices. The rate of change is the percent "change" of the related bar.
When tje rate of change is too different, there is a trade opportunity.
Seeing the rate of change you can guess if you can judge if you are making a good trade
Yes the information is already on the bar chart but without knowing you might easily miss the importance of that %10 change over there.
Moving Average Color Direction Detection Moving Average Color Direction Detection, possibility to configure:
- Type: SMA, EMA, WMA, VWMA, SMMA, DEMA, TEMA, HULLMA, ZEMA, TMA, SSMA
- Lenght
- Source
- Colour direction