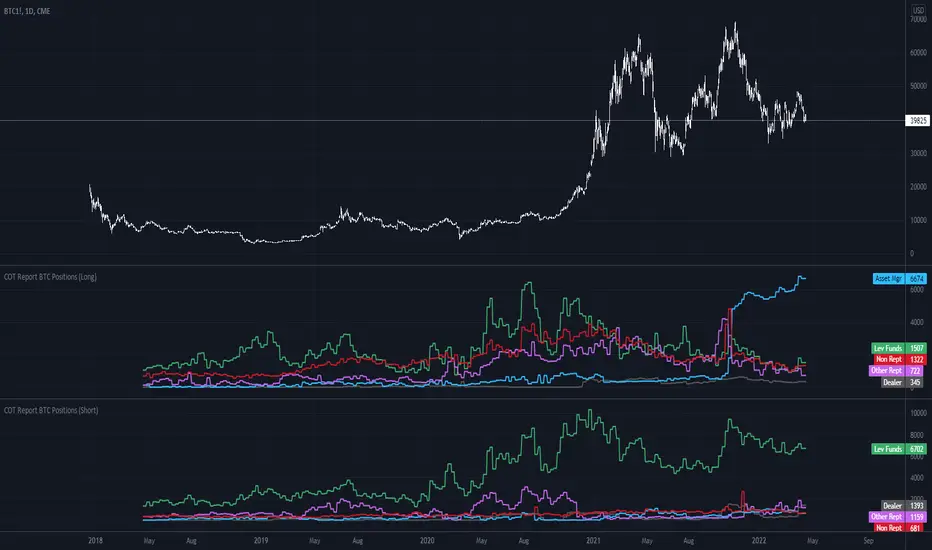
COT Report BTC Positions█ OVERVIEW
Showing the Commitments of Traders (COT) report(*) for BITCOIN Positions - CHICAGO MERCANTILE EXCHANGE (futures only) with COT charts on TradingView data.
* COT reports are released each Friday (except for U.S. holidays) by the CFTC.
* Each COT report release includes data from the previous Tuesday.
* Original data is www.cftc.gov
Data currently displayed are through April 12, 2022
█ FEATURES
You can switch the display for each of the following Positions :
Long
Short
You can switch the display for each of the following Categories :
Dealer
Asset manager
Leverage funds
Other reportable
Non reportable
█ HOW TO USE IT
This indicator allows you to see changes for each category within TradingView without having to refer directly to each report.
交易者持倉報告(COT)
COT Net Positions BTC & ETH FO_ALLWeekly Commitment of Traders Report for Futures positions, as well as futures plus options positions.
This is only for Bitcoin and Ether.
OPEN INTEREST
DEALER
ASSET MANAGER
LEVERAGED FUNDS
OTHER REPORTABLE
TOTAL REPORTABLE
NON REPORTABLE
CoT data with OpenInterestDisplays COT data based on the "Disaggregated Commitments of Traders" report for Futures of the CFTC.
It does make accesible the following symbols:
ZB
ZN
ZS
ZM
ZL
ZC
ZW
KE
HE
LE
GC
SI
HG
CL
HO
RB
NG
6A
6B
6C
6E
6J
6S
SB
KC
CC
CT
ES
RTY
YM
NQ
PA
PL
AUP
HRC
EH
BB
ZR
ZO
DC
OJ
LBS
GF
SP
DJIA
6N
6L
VX
6M
6R
6Z
ZT
ZF
Institutional Behavior AnalyticsJapanese below / 日本語説明は下記
■Summary
This indicator provides analysis on institutional investors/traders’ behavior by discovering and interpreting patterns of CFTC positions and price action in order to help users follow market directions that maker makers create and make decisions.
■What can we do with this indicator?
●Display institutional investors/traders’ position(CFTC COT position)
●Analyze institutional investors/traders’ behavior
Analyze institutional investors’ behavior from CFTC position data and price action and patternize the movement where strong buying/selling pressures are indicated
●Notify institutional investors’ behavioral changes with signals and alerts
In case strong buying/selling pressures detected, signals will be displayed along with the factors by which the behavioral changes identified. Alerts can be set with the same condition as signals.
■Why is it important to analyze institutional investors/traders behavior?
Financial markets are created by institutional investors/traders aka market makers. Analyzing their behavior and knowing where they are heading are chances for retail traders for trend trading.
■Functions
There is three core functions in this indicator.
1. CFTC COT Positions
2. Institutional Behavior Analysis
3. Alert
■Function Details:
1. CFTC COT Positions
1-1. CFTC COT Position
This indicator shows COT(Commitment of Traders) positions provided by CFTC with selection of legacy format and new format.
Users also can select position type from Futures only and Futures and Options.
Data source is quandle.com
The indicator shows the data of the assets listed below based on the code and the ticker code of which users open charts.
This is upgrade functions of CFTC Positions by COT Report(Legacy and New Format) Indicator which I previously released by adding more assets and new functions; (1)manual CFTC code entry, (2)display of changes from previous week and (3) Auto-identification of peak position level (see below)
CFTC Positions by COT Report(Legacy and New Format)
Indices:
Dow Jones Industrial Average / CFTC code:12460P / when DJI/US30 open
S&P 500 STOCK INDEX / CFTC code:13874P / when SPX / SPX500USD /US500 open
NASDAQ-100 STOCK INDEX / CFTC code:20974P / when NDX/US100 open
E-MINI Russel2000 INDEX / CFTC code:239742 / when RUT/US2000 open
NIKKEI STOCK AVERAGE / CFTC code:240741 / when NI225 / JP225USD open
Currencies:
EURO / CFTC code:099741 / when EURUSD open
Japanese Yen / CFTC code:097741 / when USDJPY open
British Pound / CFTC code:096742 / when GBPUSD or EURGBP open
Australian Dollars / CFTC code:232741 / when AUDUSD open
New Zealand Dollars / CFTC code:112741 / when NZDUSD open
Canadian Dollars / CFTC code:090741 / when USDCAD open
Swiss Franc / CFTC code:092741 / when USDCHF open
Commodities:
USOIL / CFTC code:067411 / when USOIL open
Brent oil / CFTC code:06765T / when UKOIL open
GOLD / CFTC code:088691 / when GOLD or XAUUSD open
Silver / CFTC code:084691 / when SILVER or XAGUSD open
Platinum / CFTC code:076651 / when PLATINUM or XPTUSD open
Palladium / CFTC code:075651 / when PALLADIUM or XPDUSD open
Copper(Grade#1) / CFTC code:085692 / HG1! or HG2! Open
Natural Gas(Henry Hub) / CFTC code:023391 / when NATURALGAS open)
Corn / CFTC code:002602 / ZC1! Or ZC2! Open
Cryptos:
Bitcoin / CFTC code:133741 / when BTCUSD open
Ether / CFTC code:146021 / when ETHUSD open
Data to be displayed:
Legacy format:
1. Open Interest
2. Non Commercial Long
3. Non Commercial Short
4. Non Commercial Net Positions (calculated by 2 and 3)
5. Non Commercial Spreads
6. Commercial Long
7. Commercial Short
8. Commercial Net Positions(calculated by 6 and 7)
9. Total Long
10. Total Short
11. Non Reportable Positions Long
12. Non Reportable Positions Short
13. Non Reportable Net Positions(calculated by 11 and 12)
New format:
1. Open Interest
2. Producer/Merchant/Processor/User Longs
3. Producer/Merchant/Processor/User Shorts
4. Producer/Merchant/Processor/User Net Positions(calculated by 2 and 3)
5. Swap Dealer Longs
6. Swap Dealer Shorts
7. Swap Dealer Net Positions(calculated by 5 and 6)
8. Swap Dealer Spreads
9. Money Manager Longs
10. Money Manager Shorts
11. Money Manager Net Positions(calculated by 9 and 10)
12. Money Manager Spreads
13. Other Reportable Longs
14. Other Reportable Shorts
15. Other Reportable Net Positions(calculated by 13 and 14)
16. Other Reportable Spreads
17. Total Reportable Longs
18. Total Reportable Shorts
19. Non Reportable Longs
20. Non Reportable Shorts
21. Non Reportable Net Positions(calculated by 19 and 20)
Sample chart
Colors and chart type are configurable.
❶.Non commercial long(green)/short(purple)/net(blue) position
❷.All data in legacy format
❸. All net positions in new format
1-2 Manual CFTC code entry
Besides the assets above, users now can enter CFTC code manually when they want to specify CFTC code regardless of charts they are opening and see other assets' COT position data.
1-3 Changes from previous week
Changes from previous week are displayed as text for Open interest, Non Commercial Long/Short/Net positions.
1-4 Auto-identification of peak position level in past N week
By specifying number of weeks(=N), the indicator automatically identify highest position level in the past N weeks for Non-commercial long and short positions.
By knowing this, users can prepare for trend reversal possibilities.
Sample chart
2. Institutional Behavior Analysis
This indicator detects institutional behavior changes based on changes of positions and price action and then categorizes them into patterns where strong buying/selling pressures of institutional investors are indicated.
Once the patterns identified, those will be displayed as signals and also it plots the factors in text by which the patterns are identified in order to support users’ decision making.
Sample chart
What makes indicator suggest institutional investors’ strong buy/sell will be remarked in the bottom right corner.
Please be noted that this function works on weekly timeframe only as institutional investors positions are updated on weekly basis by CFTC.
3. Alert
Alerts can be set with the same condition as signals so that users do not miss indicated strong buying/selling pressure of institutional investors.
■What timeframe/trading style is this indicator for?
As CFTC position updated on weekly basis, weekly, daily and 4H timeframes are most appropriate hence swing trading and day trading is best fitting trading style.
Scalping? Possible but why would we aim such small movement, knowing the directions that institutional investors are going to which could lead to big trends.
---------------------------------------------------
■サマリー
機関投資家の建玉とプライスアクションに基づいて機関投資家の行動分析を提供するインジケーターです。
機関投資家の強い買い圧力、売り圧力が示唆されるケースをその構成要素と共にパターン分類。
マーケットメーカーの作り出す相場の方向性に追従しやすくなるように、ユーザーの意思決定を支援します。
■このインジケーターでできること
●CFTC建玉の分析
CFTC(アメリカ商品先物取引委員会)が公開するCOT(Commitment of Traders)レポートに基づき機関投資家や商業筋の建玉データを分析することができます。
●機関投資家の行動分析
建玉データと値動きから機関投資家の行動を分析することが可能です。
インジケーターは建玉データとプライスアクションを基に機関投資家の強い買い圧力、売り圧力が示唆されるケースをその構成要素と共にパターン分類します。
●機関投資家の行動変化をシグナルとアラートで通知
機関投資家の強い買い圧力、売り圧力が検知された場合、その構成要素と共にシグナルを表示します。またシグナル表示のタイミングでアラート設定することも可能です。
■なぜ機関投資家の建玉や行動を分析することが重要なのか?
相場はマーケットメーカーと呼ばれる機関投資家によって作られています。
彼らのポジション状況や行動を分析し、彼らがどの方向に進んでいるのかを知ることは、個人投資家にとってトレンドフォローでトレードする機会、特に大きなトレンドに乗る機会を見出すことに繋がります。
機能
このインジケーターには主に3つの機能が搭載されています。
1. CFTC建玉データの表示
2. 機関投資家の行動分析
3. アラート
1. CFTC建玉データの表示
1-1. CFTC建玉データの表示
COTレポートが提供するCFTC建玉をサブウィンドウに表示することができます。
データレイアウトについては、レガシーフォーマットと新フォーマットの二つのレポートフォーマットを選択可能です。
またポジション種類として先物のみを表示するか、先物とオプションを含んだポジションを表示するかの選択も可能です。
インジケーターが表示する対象の資産と該当のCFTCコード、どのティッカーコードのチャートで表示されるかは以下の通りです。(データソースはquandle.com)
この機能は以前リリースしたCFTC Positions by COT Report(Legacy and New Format) Indicatorのアップグレードバージョン機能です。
対象データが追加されている他、新機能として(1)マニュアルでのCFTCコード指定、(2)前週比の表示、(3)過去のピークポジションのレベルライン自動描画が追加されています。
(詳細は下記)
CFTC Positions by COT Report(Legacy and New Format)
株価インデックス:
ダウ工業平均 / CFTC code:12460P / DJI/US30 を開いたとき
S&P500 / CFTC code:13874P / SPX / SPX500USD /US500
ナスダック100指数 / CFTC code:20974P / NDX/US100
E-MINI ラッセル2000指数 / CFTC code:239742 / RUT/US2000
日経平均 / CFTC code:240741 / NI225 / JP225USD
通貨:
ユーロ / CFTC code:099741 / EURUSDを開いた時
円 / CFTC code:097741 / USDJPY
ポンド / CFTC code:096742 / GBPUSD または EURGBP
豪ドル / CFTC code:232741 / AUDUSD
ニュージーランドドル / CFTC code:112741 / NZDUSD
カナダドル / CFTC code:090741 / USDCAD
スイスフラン / CFTC code:092741 / USDCHF
コモディティ:
WTI原油 / CFTC code:067411 / USOIL
北海ブレント原油 / CFTC code:06765T / UKOIL
ゴールド / CFTC code:088691 / GOLD または XAUUSD
シルバー / CFTC code:084691 / SILVER または XAGUSD
プラチナ / CFTC code:076651 / PLATINUM または XPTUSD
パラジウム / CFTC code:075651 / PALLADIUM または XPDUSD
銅(Grade#1) / CFTC code:085692 / HG1! または HG2!
天然ガス(Henry Hub) / CFTC code:023391 / NATURALGAS
コーン / CFTC code:002602 / ZC1! または ZC2!
暗号資産:
ビットコイン / CFTC code:133741 / BTCUSD
イーサ / CFTC code:146021 / ETHUSD
表示されるデータ:
レガシーフォーマット(一般的によく見るのはこのフォーマットです。)
1. Open Interest
2. Non Commercial Long
3. Non Commercial Short
4. Non Commercial Net Positions (calculated by 2 and 3)
5. Non Commercial Spreads
6. Commercial Long
7. Commercial Short
8. Commercial Net Positions (calculated by 6 and 7)
9. Total Long
10. Total Short
11. Non Reportable Positions Long
12. Non Reportable Positions Short
13. Non Reportable Net Positions(calculated by 11 and 12)
新フォーマット:
1. Open Interest
2. Producer/Merchant/Processor/User Longs
3. Producer/Merchant/Processor/User Shorts
4. Producer/Merchant/Processor/User Net Positions(calculated by 2 and 3)
5. Swap Dealer Longs
6. Swap Dealer Shorts
7. Swap Dealer Net Positions(calculated by 5 and 6)
8. Swap Dealer Spreads
9. Money Manager Longs
10. Money Manager Shorts
11. Money Manager Net Positions(calculated by 9 and 10)
12. Money Manager Spreads
13. Other Reportable Longs
14. Other Reportable Shorts
15. Other Reportable Net Positions(calculated by 13 and 14)
16. Other Reportable Spreads
17. Total Reportable Longs
18. Total Reportable Shorts
19. Non Reportable Longs
20. Non Reportable Shorts
21. Non Reportable Net Positions(calculated by 19 and 20)
サンプルチャート:
色とグラフ/線種は変更可能です。
❶.Non commercial(いわゆる投機筋)のポジション: ロング(緑)/ショート(紫)/ネット(青)
❷.レガシーフォーマットの全データ出力
❸. 新フォーマットで提供される全てのネットポジション
1-2 CFTCコードのマニュアル入力
上記のアセットに加え、任意のCFTCコードを指定して建玉データを表示することができます。
現在開いているチャートに関係なく、特定のアセットの建玉を確認したい時、他のアセットの建玉との相関を見るときに活用できます。
1-3 前週比の表示
Open Interest, Non Commercial(投機筋)のLong/Short/Netについて、前週比を表示します。
1-4. 過去N週間における建玉のピークを自動表示
過去N週間(Nはパラメータ設定)におけるNon Commercial(投機筋)のロング·ショートポジションのピークを自動で表示します。
過去の建玉のピークを知ることで、建玉が再びそのラインに接近した時のトレンド転換の可能性に備えることが可能です。
サンプルチャート
2. 機関投資家の行動分析
この機能では建玉の変化とプライスアクションから機関投資家の行動変化を検知し、機関投資家の強い買い、売りの存在が示唆されるケースをパターン分類します。
パターンが特定されたタイミングでシグナル表示するとともに、パターンを構成する要素(何を以て機関投資家の強い買い/売りの存在を判断したか)をテキストで表示することでユーザーの意思決定を支援します。
サンプルチャート
インジケーターが機関投資家の強い買い·売りの存在が示唆されると判断した要素がサブウィンドウの右下に記載されます。
この機能は週足でのみ有効です。
3. アラート
上記2のシグナルが表示されるタイミングでアラートを設定することができます。
機関投資家の強い買い·売りを検知したタイミングを逃さないよう活用してください。
■このインジケーターが適しているタイムフレーム
CFTCのポジションが週次で更新されることから、長めの時間軸である週足、日足から4時間足くらいまでが適しています。
トレードスタイルとしては、機関投資家が作る大きなトレンドに追尾するスイングトレードが最も適していると考えますが、デイトレードにも使えます。

FlōatFloat by AlphanumetriX is an invaluable tool to aid and abet the trader and investor.
Float can...
Assist in managing positions
Assist in identifying new positions
Assist in your accounting practices
Assist with risk management
What is Float?
The value of Float is in its simplicity. After becoming accustomed to it, you will wonder how you ever traded without it.
Float is not a ‘Buy and Sell’ indicator, it can be considered a calculator/risk management tool and position manager.
Float has advanced mathematics built into its code that allows you to set complex parameters that will be clearly displayed over your TradingVeiw charts.
View your P/L in percentage % terms after leverage and in Fiat $ terms after Leverage.
Box
After entering all commands in the settings, you are clearly able to view all pertinent information of your trade in real-time.
Float will apply and recalculate any amendments that you enter instantaneously.
BEFORE entering a trade, use Float to…
Identify where your liquidation point would be, relative to the amount of leverage applied to the trade.
Identify where a potential Stop Loss or Take Profit point could be placed.
Assess the Risk/Reward of the trade.
Run mock trades to gauge your performance prior to live trading.
Calculate the Capital and Quantity of assets post leverage.
Some examples below

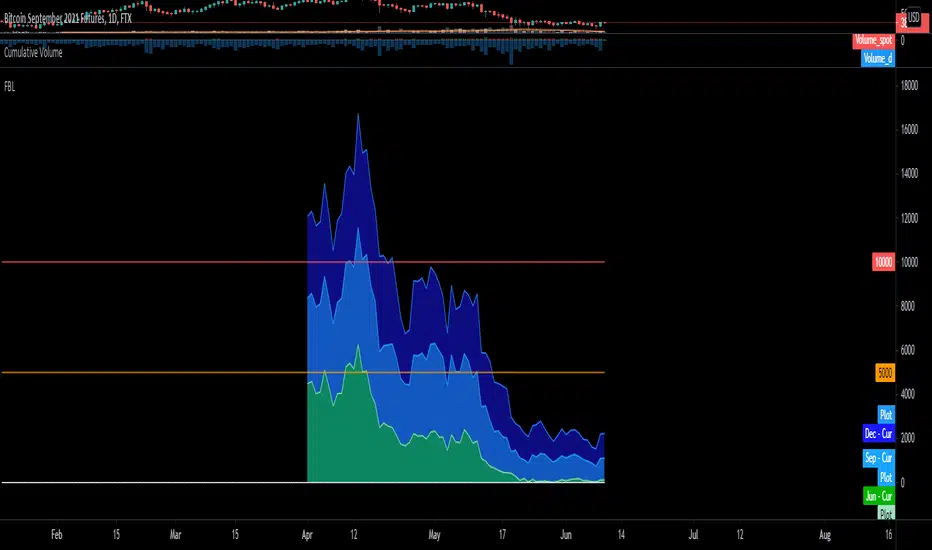
BTC FTX Futures PremiumsThis indicator shows the future BTC premiums on FTX.
The purple area is the Daily December Futures contract subtracted by the current price.
The blue area is the Daily September futures contract subtracted by the current price.
The green area is the Daily June futures contract subtracted by the current price.
You can use this to try and understand market sentiment.
If the current price dumps but the premium remains the same it likely means that sentiment is unchanged.
The opposite is true, if the price pumps and the premium is the same it means the market likely wasn't convinced by the movement.
The difference between the current price and the futures price can help determine how bullish or bearish a market or at extremes the level of euphoria.
Last Friday of MonthThis script marks the last Friday of the month in a daily chart because this is the day when BTC and ETH options expire according to Deribit.
I only found a script that highlights the 3rd Friday of the month, which is not what I wanted.
This script tries to figure out the correct number of days per month but is not aware of holidays which might displace the expiry date.

CFTC Positions by COT Report(Legacy and New Format)Japanese below / 日本語説明は下記
CFTC Positions by COT Report(Legacy and New Format)
This indicator shows CFTC positions provided by COT report with availability to select legacy format and new format.
Users also can select position type from Futures only and Futures and Options.
Data source is quandle.com
The indicator shows the data of the assets listed below based on the code and the ticker code of which users open charts.
Indices:
Dow Jones Industrial Average / CFTC code:124601 / when DJI/US30 open
S&P 500 STOCK INDEX / CFTC code:138741 / when SPX/SPX500USD/US500 open
NASDAQ-100 STOCK INDEX / CFTC code:209741 / when NDX/US100 open
NIKKEI STOCK AVERAGE / CFTC code:240741 / when NI225/JP225USD open
Currencies:
US Dollars / CFTC code:132741 / when EURUSD open
Japanese Yen / CFTC code:097741 / when USDJPY open
British Pound / CFTC code:096742 / when GBPUSD or EURGBP open
Australian Dollars / CFTC code:232741 / when AUDUSD open
New Zealand Dollars / CFTC code:112741 / when NZDUSD open
Canadian Dollars / CFTC code:090741 / when USDCAD open
Swiss Franc / CFTC code:092741 / when USDCHF open
Commodities:
USOIL / CFTC code:067411" / when USOIL open
GOLD / CFTC code:088691" / when GOLD or XAUUSD open
Silver / CFTC code:084691" / when SILVER or XAGUSD open
Cryptos:
Bitcoin / CFTC code:133741" / when BTCUSD open
Data to be displayed:
Legacy format:
1. Open Interest
2. Non Commercial Long
3. Non Commercial Short
4. Non Commercial Net Positions (calculated by 2 and 3)
5. Non Commercial Spreads
6. Commercial Long
7. Commercial Short
8. Commercial Net Positions(calculated by 6 and 7)
9. Total Long
10. Total Short
11. Non Reportable Positions Long
12. Non Reportable Positions Short
13. Non Reportable Net Positions(calculated by 11 and 12)
New format:
1. Open Interest
2. Producer/Merchant/Processor/User Longs
3. Producer/Merchant/Processor/User Shorts
4. Producer/Merchant/Processor/User Net Positions(calculated by 2 and 3)
5. Swap Dealer Longs
6. Swap Dealer Shorts
7. Swap Dealer Net Positions(calculated by 5 and 6)
8. Swap Dealer Spreads
9. Money Manager Longs
10. Money Manager Shorts
11. Money Manager Net Positions(calculated by 9 and 10)
12. Money Manager Spreads
13. Other Reportable Longs
14. Other Reportable Shorts
15. Other Reportable Net Positions(calculated by 13 and 14)
16. Other Reportable Spreads
17. Total Reportable Longs
18. Total Reportable Shorts
19. Non Reportable Longs
20. Non Reportable Shorts
21. Non Reportable Net Positions(calculated by 19 and 20)
Sample chart
Colors and chart type are configurable.
1.Non commercial long(green)/short(purple)/net(blue) position
2.All data in legacy format
3. All net positions in new format
How to use this indicator?
This indicator is paid indicator and invited-only indicator.
Please contact me via private chat or follow links in my signature so that I can grant the access right to the indicator.
Comment section is only for comments on the indicator or updates. Please refrain from contacting me using comments to follow TradingView house rules.
---------------------------------------------------
COTレポートが提供するCFTC建玉をサブウィンドウに表示するインジケーターです。
レガシーフォーマットと新フォーマットの二つのレポートフォーマットを選択することができます。
またポジション種類として先物のみを表示するか、先物とオプションを含んだポジションを表示するかの選択も可能です。
インジケーターが表示する対象の資産と該当のCFTCコード、どのティッカーコードのチャートで表示されるかは以下の通りです。(データソースはquandle.com)
株価インデックス:
ダウ工業平均 / CFTC code:124601 / DJI/US30 を開いたとき
S&P500 / CFTC code:138741 / SPX/SPX500USD/US500
ナスダック100指数 / CFTC code:209741 / NDX/US100
日経平均 / CFTC code:240741 / NI225/JP225USD
通貨:
米ドル / CFTC code:132741 / EURUSDを開いた時
円 / CFTC code:097741 / USDJPY
ポンド / CFTC code:096742 / GBPUSD または EURGBP
豪ドル / CFTC code:232741 / AUDUSD
ニュージーランドドル / CFTC code:112741 / NZDUSD
カナダドル / CFTC code:090741 / USDCAD
スイスフラン / CFTC code:092741 / USDCHF
コモディティ:
WTI原油 / CFTC code:067411 / USOIL
ゴールド / CFTC code:088691 / GOLD または XAUUSD
シルバー / CFTC code:084691 / SILVER または XAGUSD
暗号資産:
ビットコイン / CFTC code:133741" / BTCUSD
表示されるデータ:
レガシーフォーマット(一般的によく見るのはこのフォーマットです。)
1. Open Interest
2. Non Commercial Long
3. Non Commercial Short
4. Non Commercial Net Positions (calculated by 2 and 3)
5. Non Commercial Spreads
6. Commercial Long
7. Commercial Short
8. Commercial Net Positions (calculated by 6 and 7)
9. Total Long
10. Total Short
11. Non Reportable Positions Long
12. Non Reportable Positions Short
13. Non Reportable Net Positions(calculated by 11 and 12)
新フォーマット:
1. Open Interest
2. Producer/Merchant/Processor/User Longs
3. Producer/Merchant/Processor/User Shorts
4. Producer/Merchant/Processor/User Net Positions(calculated by 2 and 3)
5. Swap Dealer Longs
6. Swap Dealer Shorts
7. Swap Dealer Net Positions(calculated by 5 and 6)
8. Swap Dealer Spreads
9. Money Manager Longs
10. Money Manager Shorts
11. Money Manager Net Positions(calculated by 9 and 10)
12. Money Manager Spreads
13. Other Reportable Longs
14. Other Reportable Shorts
15. Other Reportable Net Positions(calculated by 13 and 14)
16. Other Reportable Spreads
17. Total Reportable Longs
18. Total Reportable Shorts
19. Non Reportable Longs
20. Non Reportable Shorts
21. Non Reportable Net Positions(calculated by 19 and 20)
サンプルチャート:
色とグラフ/線種は変更可能です。
1.Non commercial(いわゆる投機筋)のポジション: ロング(緑)/ショート(紫)/ネット(青)
2.レガシーフォーマットの全データ出力
3. 新フォーマットで提供される全てのネットポジション
インジケーターの使用について
当インジケーターは招待制インジケーター(有料)となっています。
使用を希望される方はプライベートチャットや下記リンクのDMでご連絡ください。
このページのコメント欄はインジケーターそのものに対するコメントやアップデートの記載のためのものとなっております。Tradingviewのハウスルールを守るためにもコメント欄からの連絡はご遠慮ください。

GOD's EYEWith the GOD's Eye, you can understand the money flow in the system/security
Know how biggies are following, and save from all your losses.
Works best in positional setup - Daily, Weekly and Monthly charts.
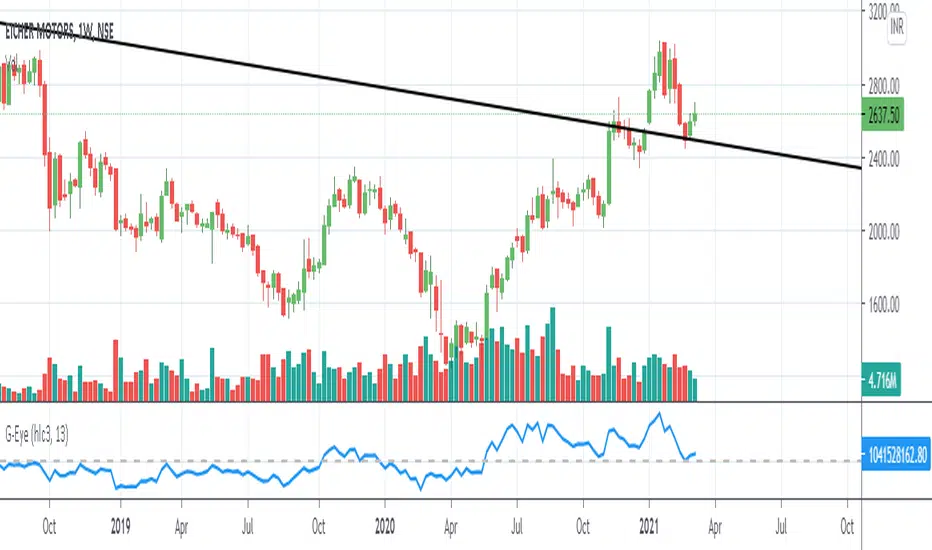
GOD's EYEGet to know when to accumulate when biggies are buying and when to stay away from the stock

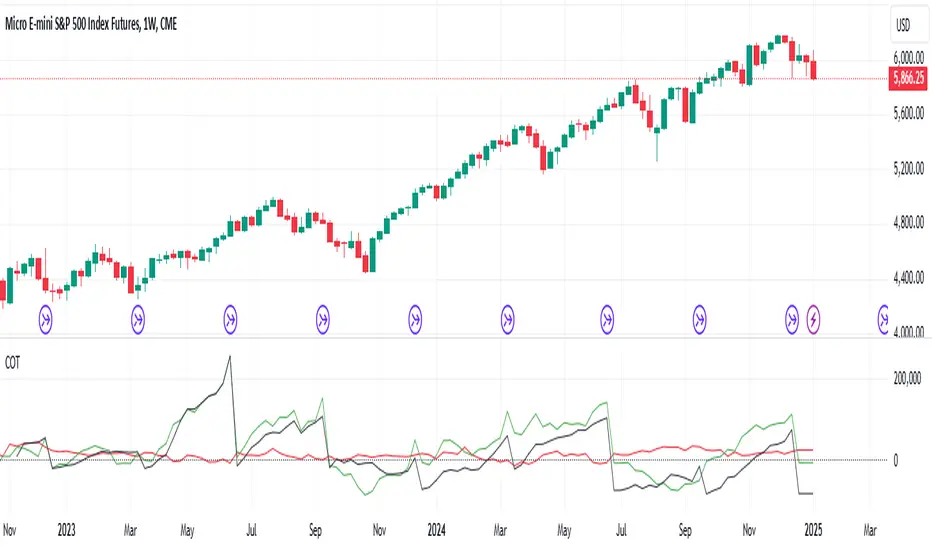
COT Net PositioningNote that I've inverted the scale of the "large specs" to clear up some noise.
- you simply revert to normal by unticking the checkbox
Sizes on crosses are calculated for you
- but they may not be perfectly reflective of true positioning
- due to differences in open interest of the underlying majors.
Orange = Commercials
Blue = Non Commercials (aka Large Specs)

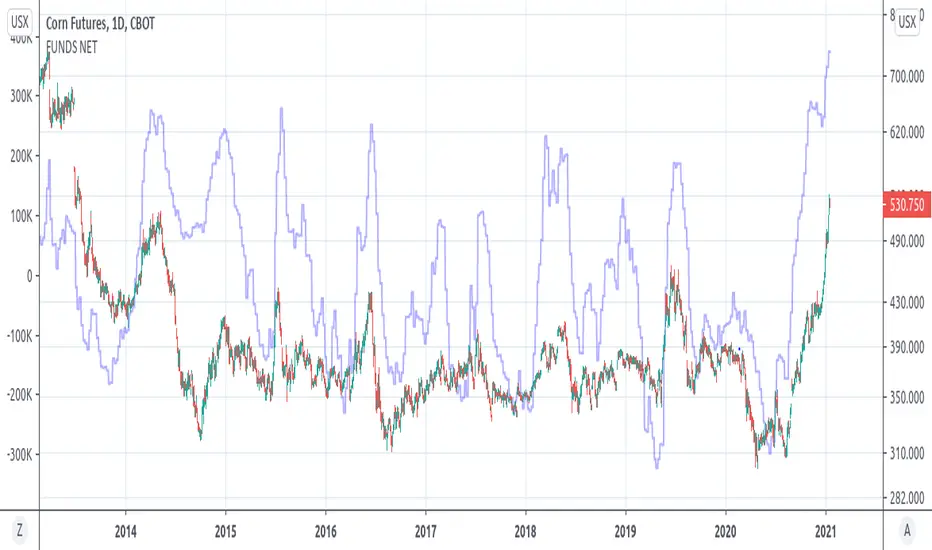
COT GRAINS FUNDS NET POSITION(GRAINSTATS)- Retrieves fund net position from CFTC Commitments of Traders(COT) Reports
- Overlays fund net positions on left y-axis vs price on right y-axis
- Current supported Grain Products
- Corn (CBOT) (QUANDL: 002602)
- Soybeans (CBOT) (QUANDL: 005602)
- Kansas City Wheat(CBOT) (Hard Red Winter) (QUANDL: 001612)
- Oats (CBOT) (QUANDL: 004603)
- Soybean Meal (CBOT) (QUANDL: 026603)
- Soybean Oil (CBOT) (QUANDL: 007601)
- Wheat (CBOT) (Soft Red Winter) (QUANDL: 001602)
(MGEX WHEAT IS UNSUPPORTED)

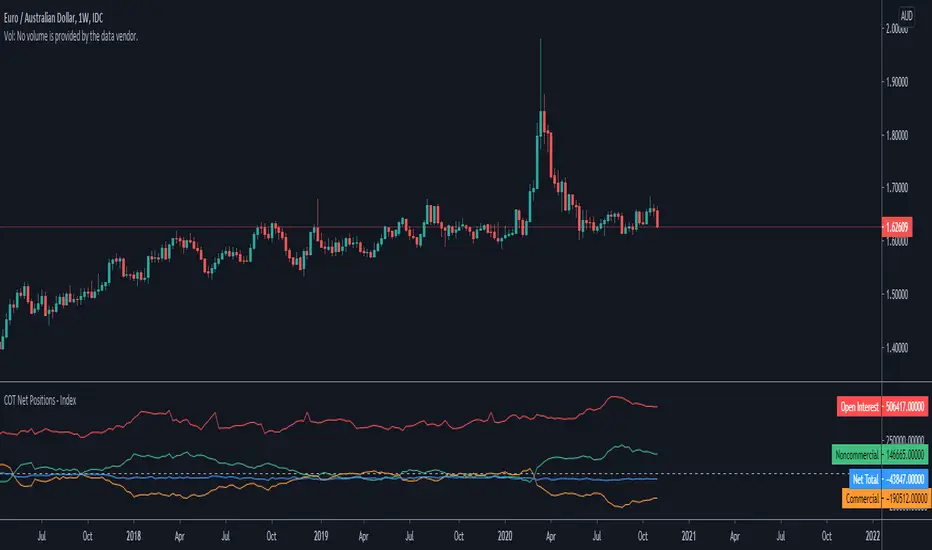
COT Net Positions Index - Currencies Only (Legacy Report)This indicator is based on the Commitment of Traders legacy report and compares the combined net noncommercial positions of the base and quote currency to the combined commercial positions of the base and quote currency.
The indicator currently works on aal the major and minor currency pairs including the inversed charts, and I will be adding exotic currencies and metals shortly. Please request any other instruments in the comments below.
Something to be aware of is that for any pair containing the U.S. Dollar, the U.S. Dollar is represented by the U.S. Dollar Index. For example, if we take the EURUSD the script combines the Euro FX futures contracts and combines the U.S. Dollar Index futures contracts, where as with for example the NZDCAD, the New Zealand Dollar is indexed against the Canadian Dollar. You should keep this in mind, because the Euro positions are 125,000 Euro FX futures contracts, while the U.S. Dollar Index futures contracts are only 1,000 U.S. Dollars.
By default the total open interest and net total of all the positions are showing as well, however, these can be turned off in the indicator settings along with the noncommercial and commercial positions.
You can also turn on the indicator lables on the scale, and it will show the name label for the open interest, noncomercials, commercials, and net total.
Cumulative distribution function - Probability Cumulative distribution function (tScore and zScore)
This script provides the calculation of the cumulative distribution function (i.e., probability). The measure allows you to calculate the chances of a value of interest being above or below a hypothesized value over the measurement period—nothing fancy here, just good old statistics and mathematics. The closer you are to 0 or 1, the more significant your measurement. We’ve included a significance level highlighting feature. The ability to turn price and/or volume off.
We have included both the Z and T statistics. Where the ‘Z’ is looking at the difference of the current value, minus the mean, and divided by the standard deviation. This is usually pretty noisy on a single value, so a smoother is included. Nice shoutout to the Pinecoders Github Page with this function also. The t-statistic is measuring the difference between a short measurement, an extended measurement, and divided by the standard error (sigma/sqrt(n)). Both of these are neatly wrapped into a function, so please feel free to use them in your code. Add a bit of science to your guessing game. For the purists out there, we have chosen to use sigma in the t-statistic because we know the population's behavior (as opposed to the s-measure). We’ve also included two levels of the t-statistic cumulative distribution function if you are using a short sample period below 6.
Finally, because everyone loves choices, we’ve included the ability to measure the probability of:
the current value (Price and volume)
change
percent change
momentum (change over a period of time)
Acceleration (change of the change)
contribution (amount of the current bar over the sum)
volatility (natural log ratio of today and the previous bar)
Here is a chart example explaining some of the data for the function.
Here are the various options you have the print the different measurements
A comparison of the t-statistic and z-statistic (t-score and z-score)
And the coloring options

COT Net Non-Commercials vs Commercials (Updated MTF Non-Repaint)Hello there,
With this script, you can see CFTC COT Non Commercial and Commercial Positions together.
This way, you can analyze net values greater than 0 and smaller, as well as very dense and very shallow positions of producers and speculators.
Green - Non Commercials - Speculators
Red - Commercials - Producers
This script is multi time-frame and non-repaint script.
Data pulled through Quandl.
And the latest version codes have been used.
As time goes by, I will try to make useful modifications to this scheme.
Regards.
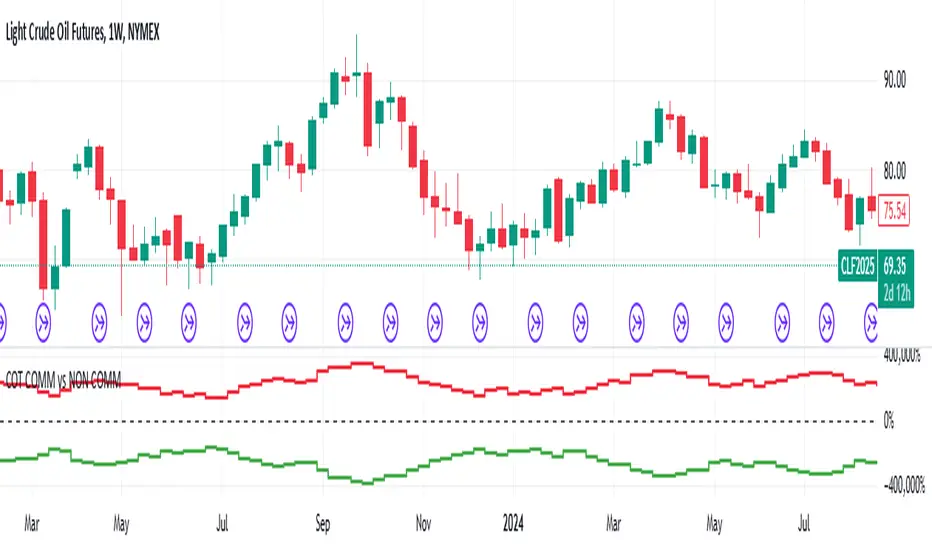
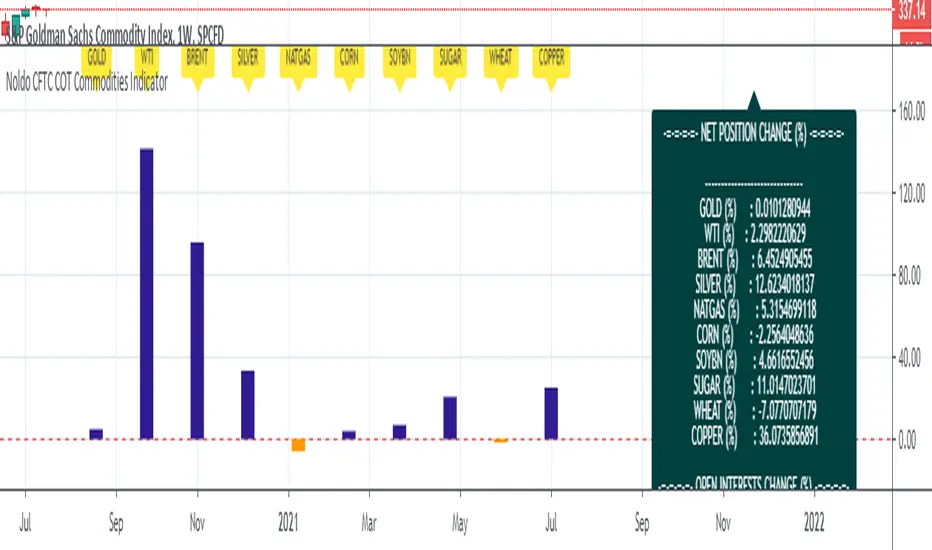
Noldo CFTC COT Commodities IndicatorHi.
Hello, this script has the same logic as Noldo CFTC COT Forex indicator :
It is the version for the future markets.
Major future assets are the subject.
Usage
This script works only on SPGSCI (S&P Goldman Sachs Commodity Index).
You must open SPGSCI :
www.tradingview.com
It only works on 1W graphics.
Because COT data is announced on Tuesday, it will cause repaint every Tuesday.
However, since it is a terminal, this factor is not strong enough to affect your decisions.
For use, you should open the bottom panel, go a little to the right in the history section and enlarge the panel you have opened.
The terminal will take its form in the presentation and provide analysis on the big screen.
COT data are pulled via Quandl.
Regards.
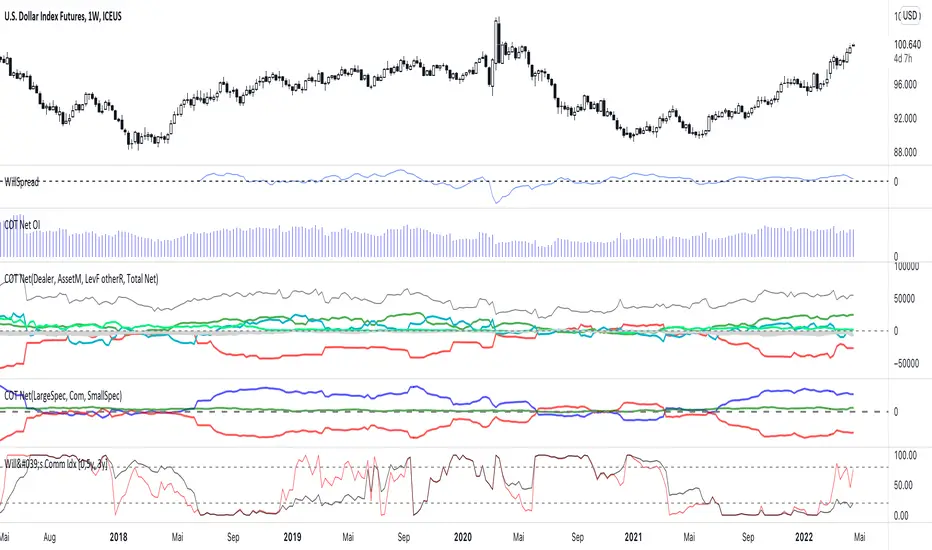
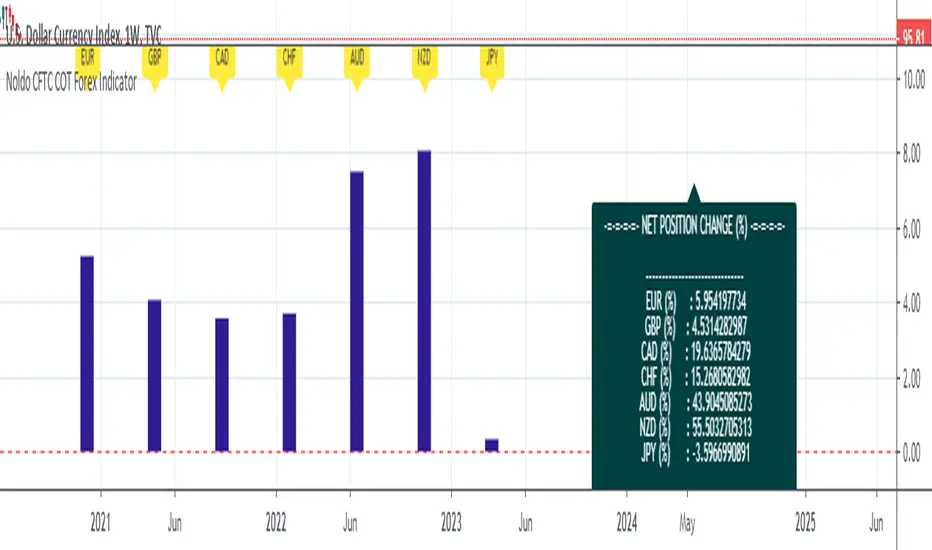
Noldo CFTC COT Forex IndicatorHello.
I decided to publish the COT Forex Indicator, which I created for convenience, as an open source.
The period DXY is determined by the differences between the two signals on the Pivot Reversal Strategy on the weekly chart.(1W)
Thus, relative period point search is automated.
When the new signal comes, after the closing, the number of bars between the previous bar before the new signal comes both directions.
This elapsed time is our period in which we will look back on relative changes.
If there is no signal, the period remains constant, thereby allowing us to notice excessive changes.
And in this period, COT data exchange and price changes are reflected in the terminal.
The automatic time-keeping of the period and the automatic generation of the relative differences of the terminals according to the period prevents a great loss of time.
Thus, we create one of the strong columns that enable us to make decisions.
The other column is the signals we obtained as a result of technical analysis.
The last column is the economic agenda and data tracking.
That's why I made my decision to share this:
Real life should not be distracted,
should not be drowned in the sea of technical analysis.
COT data is one of the most important and valuable tools that bring us signs of real life,
It should not be forgotten !
A lot of time is lost while doing these analyzes, and I wanted this to be much more practical and tidy!
And we can see if there are factors that will back up our incoming signals.
Usage
This script works only on DXY .
You must open DXY.
It only works on 1W graphics.
Because COT data is announced on Tuesday, it will cause repaint every Tuesday.
However, since it is a terminal, this factor is not strong enough to affect your decisions.
For use, you should open the bottom panel, go a little to the right in the history section and enlarge the panel you have opened.
The terminal will take its form in the presentation and provide analysis on the big screen.
COT data are pulled via Quandl.
General kind request:
Authors who know the technical broad expression of the security function or have an idea about its creation, please reach me.
Best regards.
[KY]COT (Commitment of Traders)(1) What is COT(Commitment of Traders)?
COT reports provide a breakdown of each Tuesday’s open interest for futures and options on futures markets.
(Traders categories are Commercials, Speculators, Non-Reportables)
* Data itself is published Friday but its source is as of Tuesday close!! This is important.
* You MUST read CFTC site before you use my script.
www.cftc.gov
(2) What can you do with my COT indicator?
You can illustrate the following data from COT report.
- Open Interest: total number of positions of each traders
- Commercials net position: the net position of "Producer/Merchant/Processor/User" and "Swap Dealers"
- Speculators net position: the net position of "Money Managers" (or sometimes called "Managed Money", "Funds", "Large Speculators")
- Other Reportables net position: the net position of "Other Reportables" (aka "Small Speculators")
- Non Reportables net position: the net position of "Non Reportables" (aka "Retail/individual investors")
In addition to these, you can show detailed information as follows:
- Speculators long/short position: sometimes you need not only "Net position" but also "Long/Short posotion". Use this.
- Long/Short ratio of each traders: Long ratio is shown as percentage. calculation is
Long ratio = (Long Interest + Spread) / (Long Interest + Short Interest + 2 * Spread)
(3) What data source do I use?
I use quandl CFTC data.
www.quandl.com
(4) How to use my indicator?
- add at least three indicator.
- wait until data is loaded.(my script collects a lot of data from CFTC so usually it takes 5-10 seconds.)
- open the settings and choose what you want to display.
options are
(4) Have any questions? Or any requests or ideas for improvement?
Please message me.
www.tradingview.com
(5) Happy Trading Everyone!!

CFTC AXEIndicator that fetch data and presents non commercial futures of Commitment of Traders report
In order to attach data on chart click confirm or manually type in case will not find CGTC code for example 099741 that equals EURO FX and can be find in CFTC website.

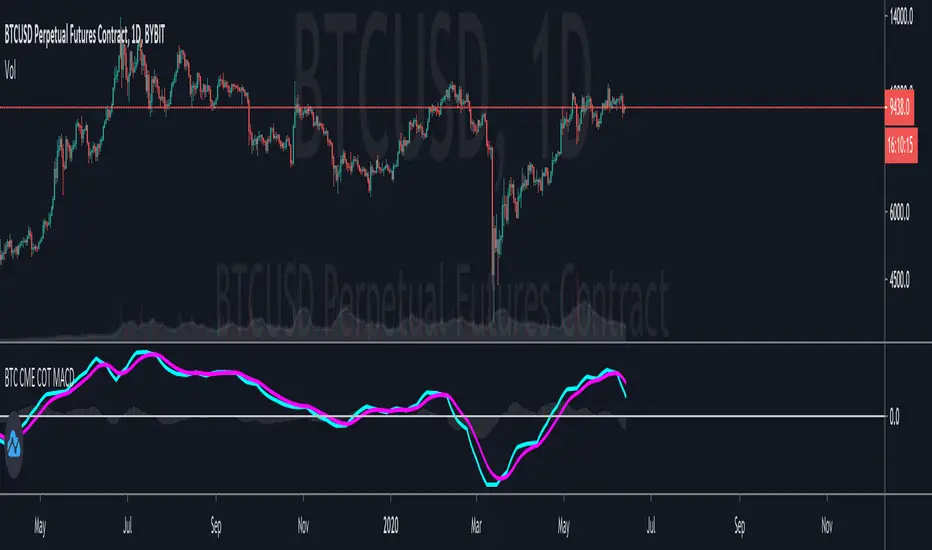
Bitcoin CME Retail vs Professionals MACD
This is an interesting study using the data provided by the Bitcoin CME Commitment of Traders report.
The MACD plot the difference between the Retail Traders positions and the Professional Traders positions.
The general idea is that Professional Traders have a better read on the market than Retail Traders.
The signal line helps to identify the trend that it is moving in.
I believe that this plot helps to visualize the overall market sentiment better than the raw COT data.
Try it out and let me know what you think!
Scalper Pro Pivot - Scalpers WeaponToday I feel good to share with my all pals a new "Pivot Point" indicator which I never thought that it could be that easily done. I have been trading for years but I am, to be honest, new to pine script. I used to code other programming languages in the past like HTML, CSS, javascript, PHP, etc web-based programming language which luckily helped me to understand pinescript. It was a bit of my history about coding now talking to the main reason why I created this script in the first place? The answer is simple "I mean who the hell don't want to make their own indicators which work to accomplish own goals". There are lots of indicators which I saw in the public library as well as inside build in but, to be honest, I didn't found any pivot point indicator which calculates the "Fibonacci" method. Even if there are hundreds of pivot point indicators out there in public and built-in but they were either in higher timeframe (daily or above resolution) and weren't on a lower timeframe like starting from 1-minute resolution. There are some lower timeframe pivot point indicators but they aren't using the same method of calculation which I wished and if I ever figure out one then they just end up being repaints which didn't work properly as I wanted. The last but not least reason to create this indicator was obviously for all those short term traders (Scalpers) which I believe this indicator will be a game-changer by adding more support on their current trading strategies. It is so flexible that we can change the resolution from 1min to 1month and, to be honest with you all Fibonacci method used pivot points works most of the time with my own years of personal experience using them in higher timeframes and that is mainly one reason why I was eager to make one which can be used in lower timeframes. It will be useful for all types of traders (short-mid-long). The indicator was specially created for my own scalping purposes and indeed at the end, the creation of this indicator became like if I was mean to dedicate this to my fellow scalper's out there who value the pivot point! Lastly, I would like to give credit to pine script who gave support and knowledge for pine script as well as 'LonesomeTheBlue ' my friend who fixed some issue within the code and without him, my imagination wouldn't have been a reality. Inbox me if you are interested in it. Cheers!

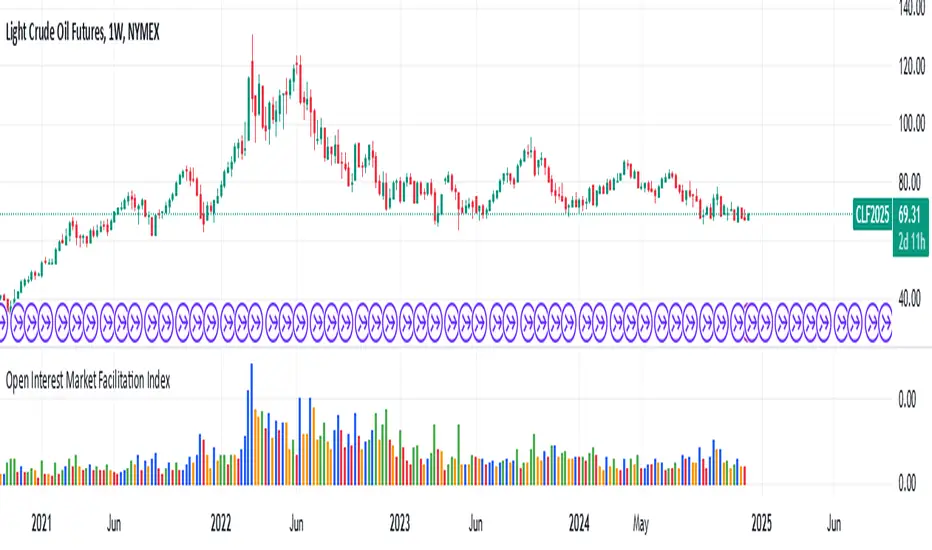
Open Interest Market Facilitation IndexOriginal script from ChartChampions :
Let's start.
This script was created by using Open Interest instead of Volume in the Market Facilitation Index.
Thus, it can make a difference in the Future and CFD Markets.
If your financial instrument is not from these markets, that is, if Open Interest is not used, you can choose Volume.
You can set "FUTURES" and "OTHERS" from the menu.
If you use the Open Interest (FUTURES) option in the menu on 1W bars and defined Future markets, it will not repaint.
This is the best use for Open Interests, as data is extracted from Quandl and CFTC COT reports are published once a week.
Color Change Rules :
In my version :
Green Bars = Green
Fade Bars = Orange
Fake Bars = Blue
Squat Bars = Red
To show the difference in the presentation, both the Futures option using Open Interest and the Others option using Volume were published to compare.
You can observe the difference.
Best regards.