BEST Supertrend CCIHello traders
Today I present you a Supertrend not based on candle close but based on a CCI (Commodity Channel Index)
How does it work?
Bull event: CCI crossing over the 0 line
Bear event: CCI crossing below the 0 line
When the event is triggered, the script will plot the Supertrend as follow
UP Trend = High + ATR * Factor
DOWN Trend = Low - ATR * Factor
This is an alternative of the classical Supertrend based on candle close being above/beyond the previous Supertrend level.
Hope you'll enjoy it and it will improve your trading making you a better trader
Dave
順勢指標(CCI)

Divergence Detector v1This indicator looks for divergences between price (close) and the indicator of your choice. You can see which indicators are supported further down. I discovered that there are 2 slight variations on how to calculate divergences in Pinescript, so I used both in this script.
Benefit : The accuracy of divergence detection becomes much higher.
Tradeoff : Some of the labels will overlap each other, not looking too pretty. I know how to fix this, but I didn't prioritize it with this version.
Supported indicators:
RSI (Relative Strength Index) - www.investopedia.com
ROC (Rate of Change) - www.investopedia.com
CCI (Commodity Channel Index) - www.investopedia.com
OBV (On Balance Volume) - www.investopedia.com
You can switch between them in the settings display of the indicator. Default is set to RSI.

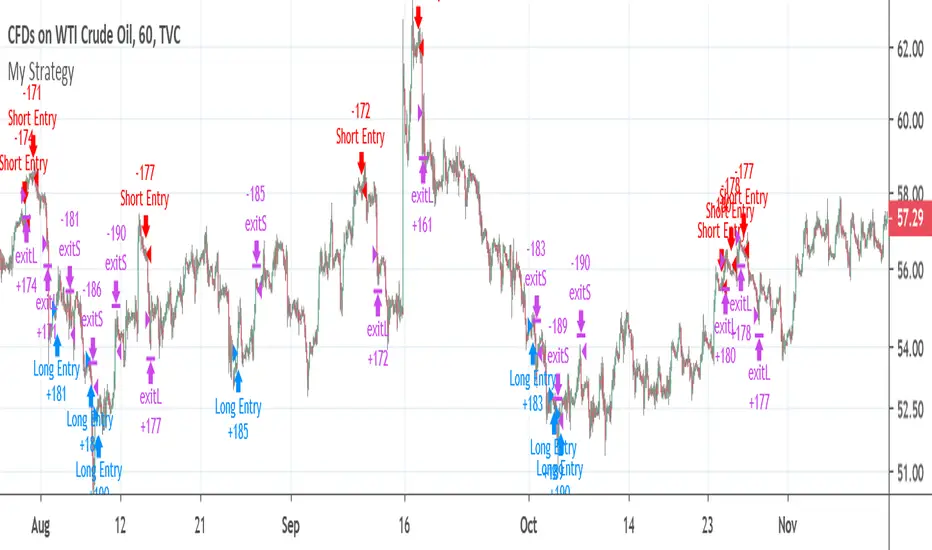
CCI strategy on OIL1HThis indicator is based on Commodity Channel Index.
It buys when CCI on period 200 is under -130 and it´s rising last 12 bars. It closes the position by hitting Take Profit, Stop Loss or opening short position.
It sells when CCI on period 200 is over 130 and it´s falling last 12 bars. It closes the position by hitting Take Profit, Stop Loss or opening short position.
This strategy seems to working just on USOIL on 1 hour chart. This can predict that it´s just luck and not proper strategy or indicator I would use for trading.
This script is just for educational purposes and that´s why the script is open. I will be happy if you will leave comment and try to come up with some ideas how to improve this strategy, so it can be used also on other commodities/forex pairs.
Cracking Cryptocurrency - ParalloxParallox
Many traders are familiar with or utilize the Relative Strength Index ( RSI ) and/or the Commodity Channel Index ( CCI ). For good reason, these classic and simple to understand indicators have made their way into many traders indicator bays with mixed results. As we often do with our trading style and indicators here at Cracking Cryptocurrency is take things that traders have used one way and attempt to view it in a different light to improve our trading efficiency and performance. That is what we have done with Parallox.
Parallox harnesses the calculations of both the Relative Strength Index and Commodity Channel Index , but through a calculation for a new breed of trader and a new market. RSI and CCI were designed to work in the stock markets of old, and their effectiveness nowadays is more-so due to the "self fulfilling prophecy" concept of so many traders using them rather then their technical applicability to any particular market or market circumstance. Moreover, because so many retail traders now utilize the RSI and CCI , trading it the traditional way, for reversals, has created a golden zone of opportunity for larger traders, institutions, and whales to come in and grab the liquidity of counter-trend retail traders basing their signals off of overbought and oversold conditions in the market utilizing RSI and CCI .
What Parallox does is quite different. Instead of relying on the readings of RSI and CCI , it looks at the value of RSI relative to the value of CCI . By looking at the convergence or divergence of these two indicators, a much more accurate reading of the directional trend can be established. No more using these oscillators to pick false tops and bottoms, instead we can utilize their relative conditions to determine market trend. Not only that, but we can identify objective signals when we cross the barrier between convergence and divergence, therefore giving us clear buy and sell signals for any trading asset.
However, we haven't left reversal traders completely by the way side. What is often an "entry" point for reversal traders, when one has determined that the particular direction of the market is at it's extreme, is where Parallox crosses back the other way, identifying an "overbought" and "oversold" region of sorts, from which we can utilize as an exit indicator when in deeply profitable trending trades.
How to Use
Using Parallox is quite simple. It can be utilized as an Initiator or Confirmer, or also as a longer-term directional marker on any time frame. In it's most simple form, the Parallox Line will cross zero from below and the line will turn green. This is an indication that the market has moved from a bearish zone of control to a bullish zone of control, and can be viewed as a potential buy signal. Conversely, when the line crosses zero from above, the line will turn red, indicating the opposite and can be viewed as a potential short sell signal.
For exit indications in strongly trending markets, when the line goes below the lower dashed line when bearish , and above the upper dashed line when bullish , and comes either back below or back above, those can be seen as trend exhaustion signals and often represent great moments to take profit or to go flat in the market until another trend establishes itself.
Settings
Let's take a look at the settings of Parallox.
First, we can input the look back length we want for our RSI and CCI indicators. You will notice that the defaults are unnatural, that is because they are tuned specifically for the BTC USD market. When trading a different asset, you will want to experiment with the optimum look back length for the best signals.
We then take a moving average of our indicators to have plotted values to work with. As above, the look back lengths for the two moving averages are optimized for BTC USD. The same caveats for optimization apply.
Then we can select the smoothing, or type of moving average we wish to utilize. Parallox performs well with different types of moving average smoothing, and I recommend that you experiment with your style of trade to find the signals that best suit your trading system.
We can also select the source of our indicator values. By default, this is hl2 , which I find to be the best for most indicators, in a close tie with hlc3.
Strategy
Please let me know of your success stories, as well as any features you think would be helpful to add. If you notice any errors within it, please notify me so I can fix them. Trade Safely.

CCI CANDLE ICHIMOKU v1.0This indicator plots CCI candles with Ichimoku cloud and lines.
So you can get buy or sell signals like Ichimoku strategy system.
Your comments and suggestions will be greatly appreciated.
Good Luck,

Commodity Channel Indexcci in trading view is based on close price but the real formula Developed by Donald Lambert is based on typical price so I modified a formula little bit , and the result now are little smoothed

CCI RiderThis is my thank you to the TradingView community, for the people who are sharing their scripts, which allowed me to learn Pine Script.
So here is my first creation, feel free to experiment, modify and use it as you wish.
It is a CCI(default value is 100, can be changed), combined with an EMA of that CCI(default 21,changeable) that then colors the background according to the strength of the signal(if selected to do so).
To generate strong signals, it also uses Bollinger Bands to prevent whipsaws in high volatility situations.
The best signals are generated when the CCI crosses the limits set by the user (default is 100/-100), and is above/belov its EMA.
Exit signals are indicated, when the CCI crosses its EMA.
Unfortunately in strong trends, this exit signal is sometimes premature, using a 3x resolution of the indicator will improve this, maybe I will implement this in a later version.
I use it mostly in 15min charts and higher, I found in shorter timeframes still a lot of whipsaws, maybe experimenting with different lengths and levels will improve this.
As the Indicator allows the user to experiment with different lenghts and levels, and the colors will change according the setting, I find it a nice tool to search for the best mixture for different securities and timeframes.
See below an example of a nice signal.
I do suggest to use it in combination with other indicators.

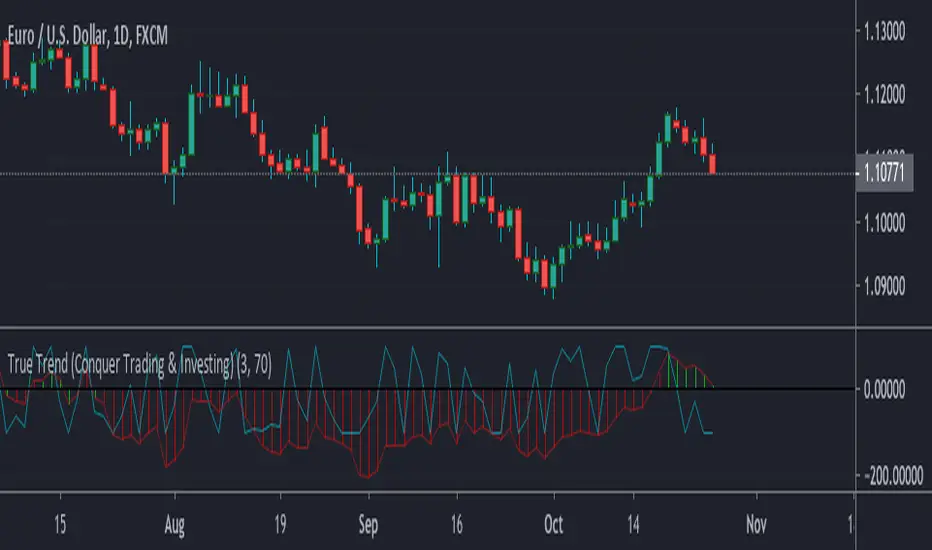
True Trend (Conquer Trading & Investing)Simple yet powerful indicator that is the best way to define the trend that I've ever seen.
True Trend BTC (Conquer Trading & Investing)Bitcoin tends to really trend for long period of times, whether it’s up or down. It’s a trending asset because it’s a new asset, full of price discovery.
I really hope this indicator is instrumental in your Bitcoin trading, it really does an outstanding job in defining the trend and helping you stay with it.

TSI CCI HullThis is TSI and CCI combined. The CCI is customized and is using HullMA, but the TSI is default TSI
For use with the HMAv420 indicator, to form trading strategy based on the 3 indicators.
Best as all 3 indicators used on 3 timeframes at once, ie 1m 5m 1H

CCI Divergence PointerThis script points regular and optionally hidden types of bullish and bearish CCI divergences on the chart by drawing the divergence lines and optionally labels.
Hidden divergence is disabled by default, it can be enabled over settings window.
Regular divergence is enabled by default, it can be disabled over settings window.
There is an option to display the price channel additionally.
Added alerts for all types of divergences.

Multi momentum indicatorScript contains couple momentum oscillators all in one pane
List of indicators:
RSI
Stochastic RSI
MACD
CCI
WaveTrend by LazyBear
MFI
Default active indicators are RSI and Stochastic RSI
Other indicators are disabled by default
RSI, StochRSI and MFI are modified to be bounded to range from 100 to -100. That's why overbought is 40 and 60 instead 70 and 80 while oversold -40 and -60 instead 30 and 20.
MACD and CCI as they are not bounded to 100 or 200 range, they are limited to 100 - -100 by default when activated (extras are simply hidden) but there is an option to show full indicator.
In settings there are couple more options like show crosses or show only histogram.
Default source for all indicators is close (except WaveTrend and MFI which use hlc3) and it could be changed but for all indicators.
There is an option for 2nd RSI which can be set for any timeframe and background calculated by Fibonacci levels.

EMA20 MA50 MA200 + T3-CCIEMA20 MA50 MA200 + T3-CCI
This combination of triple Moving Average and CCI is a strategy to be used in conjunction with Harmonical Patterns and Fibonacci Rations .
Heikin Ashi price can be used as the price source for the Moving Averages and the T3-CCI, instead of the real price.
Two instances of the indicator can be spawned to have both the triple MAs and the T3-CCI on the chart (L-Click on the Indicator > Move To > New Pane Below).
Alerts are available to warn of possible opportunities in the markets .
A single alert that can fire on both conditions can be set. It can also be used by other indicators, such as the Risk Management Wrapper .
Additional Technical Analysis is required to confirm the signals before opening a position.
This indicator is an update to MA50 EMA20 MA200 .

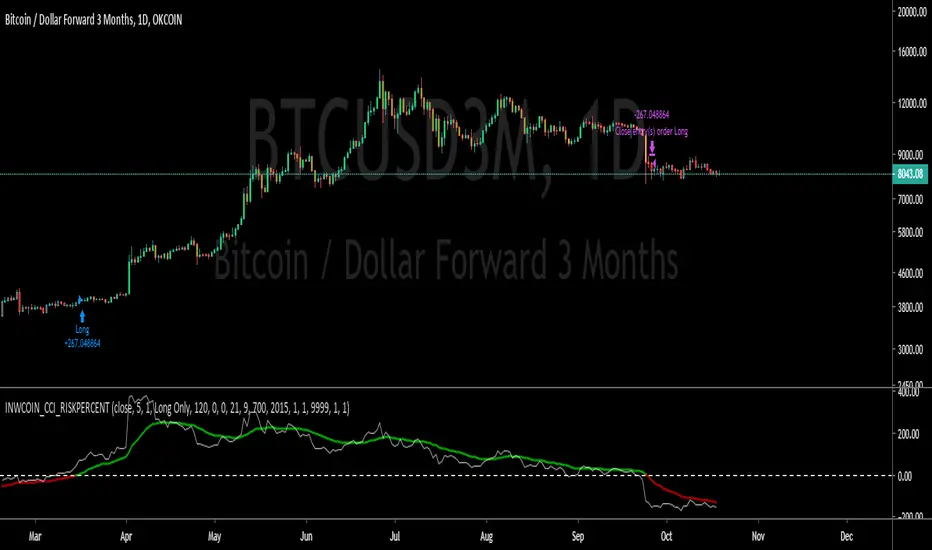
inwCoin CCI Risk% Strategy=========================
English
=========================
inwCoin CCI Risk% Strategy using CCI ( Commodity channel index ) and EMA of CCI to determine entry/ exit.
It's very good trend following strategy that it will not exit until the trend completely change.
Buy = EMA of CCI cross above 0
Sell = EMA of CCI cross under 0
You can adjust each parameters to see how's working for your setup.
==========================
Thai
==========================
inwCoin CCI Risk% Strategy ตัวนี้ผมเอา CCI มาช่วยในการหาจุดเข้าและจุดออก
โดยผมจะเอา EMA มาใส่ CCI ซ้อนไปอีกที เพื่อหาจุดเข้าและออกครับ
หลังจาก backtest แล้วก็พบว่า เป็นตัว trend following strategy ที่ค่อนข้างจับ trend ได้อยู่หมัด ( คือไม่ยอมออกง่ายๆ ถ้าราคาไม่หัวปักหนักๆ จริงๆ )
ตอนนี้ สำหรับ BTC ก็อย่างที่เห็น ว่า confirm trend ขาลงแล้ว .. หลังจากนี้ก็คงได้แต่รอการลงแรงๆ เพื่อปิดฉากขาลงสักรอบ แล้วค่อยขึ้นใหม่ 555
MS MONEY CCI SQUEEZEAbout
I have used this indicator to find many lucrative opportunities. This indicator takes the moving average of CCI in custom, volatility-specific conditions. CCI measures "overbought" in the red-shaded region and "Oversold" in the green-shaded region. The shaded regions do not constitute a buy/sell signal alone, the MS CCI Squeeze is best used when market conditions agree and is best used when the user has fundamental reasoning for "reversal-like" situations to align. The MS CCI Squeeze will soon have a synergistic partner called "MS RSI Squeeze" indicator that will look similar to help better measure volatility and strength trend.
About the Commodity Channel Index (CCI)
The commodity channel index (CCI) is an oscillator originally introduced by Donald Lambert in 1980. Since its introduction, the indicator has grown in popularity and is now a very common tool for traders in identifying cyclical trends not only in commodities, but also equities (stocks) and currency trading.
How to set an Alert
If the user wants to set an alert , click on one of the support/ resistance lines (black-dashed) near the zero mark. Clicking on the horizontal line above or below the zero line will populate a yellow arrow which will allow you to set alerts when wanted.
Please Read For Better Efficiency
When using this indicator, keep an eye out for harmonic patterns, both bullish and bearish head and shoulders patterns for "HIDDEN" breakout opportunities.
Please like, follow and share and I will continue building better indicators.

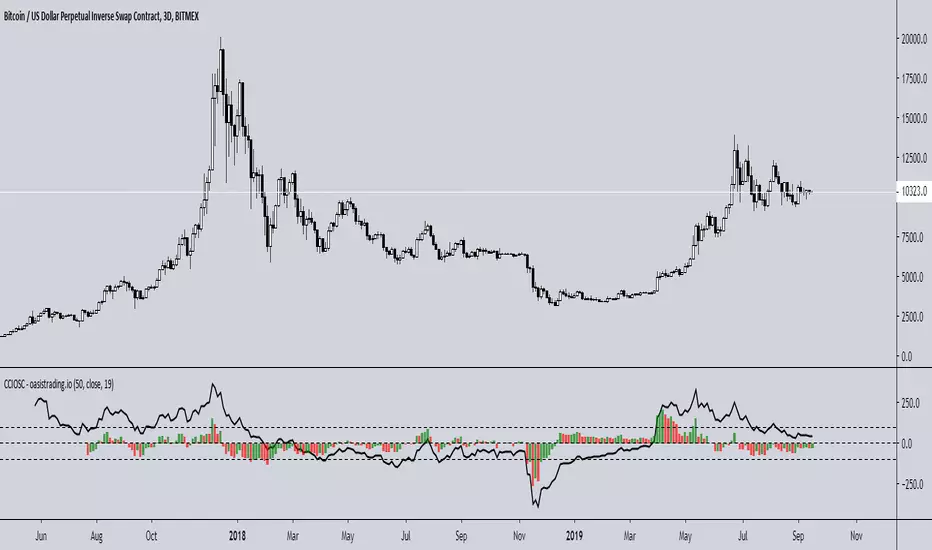
Improved CCI with Momentum OscillatorThis indicator is free to all Oasis Trading Group members.
The Improved CCI is a basic CCI with a momentum gauge applied to the zero line. This indicator is used to find breakouts/breakdowns and when they have lost momentum.
A bullish entry would be found when the CCI has broken the 100 line when the Momentum gauge is above zero or when the CCI has crossed above the -100 line when the Momentum gauge is above zero.
A bearish entry would be found when the CCI has broken the -100 line when the Momentum gauge is below zero or when the CCI has crossed below the 100 line when the Momentum gauge is below zero.
For Access or Questions: Private message us. Thank you.
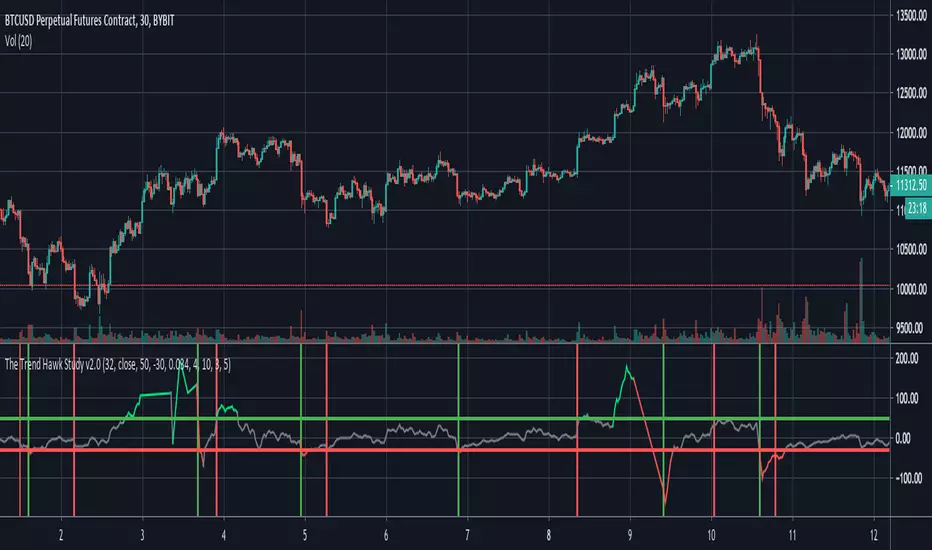
The Trend Hawk Study v2.0Study Version of the TrendHawk Strategy based on Commodity Channel Index(CCI). Comes with built-in alerts and stop loss.
Fishnet CCICCI is capable of showing high levels.
This chart uses CCI from 10 days to 200 days.
100 levels are divided into blue and 250 levels are gray.
You'll see divergence in a small time frame. (ex. 1 or 4 hour)
We can consider buying in the green area.
Enjoy!

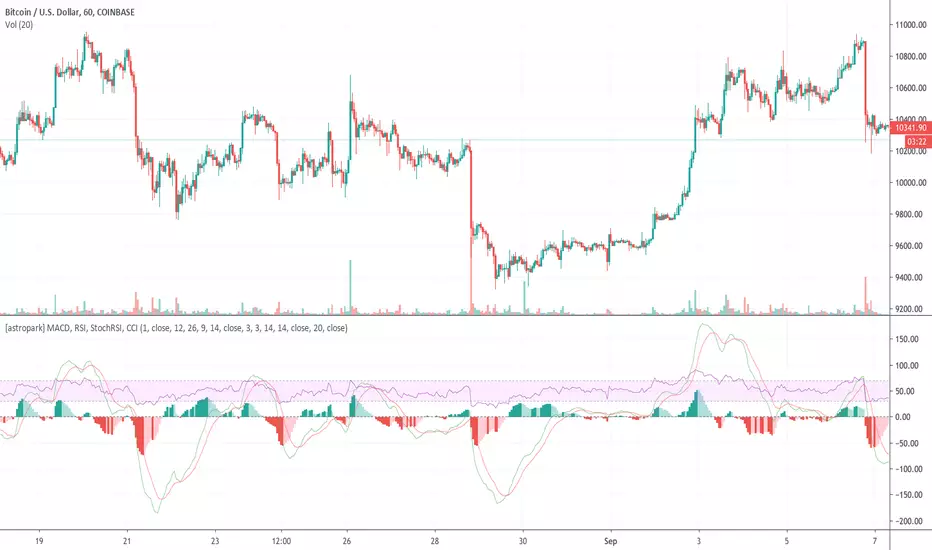
[astropark] MACD, RSI, StochRSI, CCIHi Followers,
here it is a new script, which unifies many very useful oscillator just in one: RSI + MACD + Stochastic RSI + CCI
This is not a public indicator, so send me a private message in order to get access to this script.
Do you like my scripts? Offer me a coffee , a beer, a pizza or whatever :)
BTC jar: 1K5kuYQPEqoNo6GRmJbHWMPmqwKM5S3oRR
ETH jar: 0x091b541a6dd6fe08c4e7bd909baafb2fce9b975e
LTC jar: LSVoAChsZrVsvbNyUfdpxtFpDAUSaUTUig
XRP jar: (XRP deposit tag) 103997763 (XRP deposit address) rEb8TK3gBgk5auZkwc6sHnwrGVJH8DuaLh
PS: Do you need a customization or do you need a dev who implements your strategy? send me a private message ;-)


CCI Stochastic and a quick lesson on Scalping & Trading SystemsHello traders
Still on holidays but I don't and will never forget you <3
I realize more and more that you guys don't only want some indicators and learn about pinescript. You also want some guidance and get some mentors providing you with comprehensive and simple trading methods and tricks.
I'm against those posting many scripts a day that in the end will make you lose your money because they don't give you the methodology to use them
It might look nice on the charts but we're not here to do some painting.... but to improve our lifestyle right :)
The today indicator is based on an indicator that I used for scalping : Fxcodebase CCI Stochastic
A CCI stochastic is very reactive and allows us to take many scalps trades per day with a few pips/USD gain for each trade. I don't recommend novice traders to use it and I strongly recommend everyone reading my disclaimer below basically saying "I'm not a financial advisor, don't be dumb, stay safe"
(I also recommend the few scripts copy-pasters to read my disclaimer as well)
What's a novice trader, sir? Well... thanks for asking. A novice trader is any trader with less than 5 years of live trading experience
From a pinescript perspective, this script will be however interesting for everyone :)
How to use it?
The indicator gives 3 possible entries for Longs and Shorts:
- Arrows at Enter - Will give signals whenever the Stoch CCI will enter in the BUY/SELL zone
- Arrows at Exit - Will give signals whenever the Stoch CCI will exit the BUY/SELL zone
- Arrows at Center - Signals whenever the Stoch CCI will cross the mid-line (50)
All arrows have different colors because ... painting is cool and nice.... kidding.... it gives clearer and more readable signals on the chart (but painting sir...)
A possible trading method could be to use the 3 modes at the same time to get the maximum of opportunities.
The safer bet is to use the "Arrows at Exit" only mode but for those who want to accumulate more scalping positions, adding the "Arrows at Enter" mode is an option as well. In other words, you accumulate a few scalping positions whenever the Stoch CCI get in the BUY/SELL zone and will stop accumulating whenever it will exit the BUY/SELL zone
You can add a few extra positions whenever the Stoch CCI will cross the mid-line as it often translates in a trend continuation
Life hack
Very important note : (probably the most important gem I shared until now) The inputs set by default will have to be changed for your asset/timeframe and can't be generic for everything. You have to play with the inputs until the signals will make sense to you
The indicator/strategy with a unique configuration that you'll never check or update according to the market condition DOES NOT exit.
If you find such a tool and prove me that you're making constant gains with it over a year, please patent it and then show it to me as I'd like to study it to replicate :) But most likely this is a myth/unicorn
Who I am to say this? Well, I worked in a Bank with real traders and I have a good sense of what works and what will certainly not work
My guru said scalping crypto in 1 second timeframe was the way to get rich quick. Do you agree sir?
But in trading, this is not because you take the maximum of trades possible that your gains will increase. This is the contrary.
There is a strong and proven inverse correlation between the number of trades taken and how fast you'll burn your capital. A swing trader taking 2/3 trades a month is more likely to beat 99% of the scalpers out there trying to predict all market movements. (and I'm not even talking about how dangerous it is to scalp with leverage)
You're starting to know me a bit more right now. I prefer to tell you what you need to hear vs what you want to hear because the second option doesn't allow to stay in the game very long.
I might lose some futures clients along the way by saying that but for my own conscience and ethics, I prefer to warn about the true risks of trading and to select who you listen very carefully (the advice also works for me, if you feel what I said doesn't make sense, this is totally your right but I hope this is because I'm french and not because of the content ^^).
See you tomorrow for another indicator or idea
Love you all
Dave
____________________________________________________________
Be sure to hit the thumbs up. Building those indicators take a lot of time and likes are always rewarding for me :) (tips are accepted too)
- If you want to suggest some indicators that I can develop and share with the community, please use my personal TRELLO board
- I'm an officially approved PineEditor/LUA/MT4 approved mentor on codementor. You can request a coaching with me if you want and I'll teach you how to build kick-ass indicators and strategies
Jump on a 1 to 1 coaching with me
- You can also hire for a custom dev of your indicator/strategy/bot/chrome extension/python
Disclaimer:
Trading involves a high level of financial risk, and may not be appropriate because you may experience losses greater than your deposit. Leverage can be against you.
Do not trade with capital that you can not afford to lose. You must be aware and have a complete understanding of all the risks associated with the market and trading. We can not be held responsible for any loss you incur.
Trading also involves risks of gambling addiction.
Please notice I do not provide financial advice - my indicators, strategies, educational ideas are intended to provide only some source code for anyone interested in improving their trading
The proprietary indicators and strategies developed by Best Trading Indicator, the object of intellectual property rights are and remain the exclusive property of Best Trading Indicator, at the exclusion of images and videos and texts free of rights or provided by the Company or external legal or physical person.
No assignment of intellectual property rights is carried out through these Terms and Conditions.
Any total or partial reproduction, modification or use of these properties for any reason whatsoever is strictly prohibited without the express written authorization of the Company.

HA_CCI Long onlyStratégie calculée sur le croisement d'in CCI lent et d'un CCI Rapide
Le CCI est calculé sur la cloture de bougie henki hashi
