CCI by Minh DucCommodity Channel Index by Minh Duc
- Fast Line Cross
- Master Trendline
Use for all time frame.
Price: 50$ for a month with user guide trading system.
Contact me: Telegram @minhduc1712
順勢指標(CCI)


PriceDivergence (ps4)This script implements price divergence module using signals from several factors like:
RSI, RSI Stochastic, MACD, Volume MA, Accumulation/Distribution, Fisher Transform and CCI

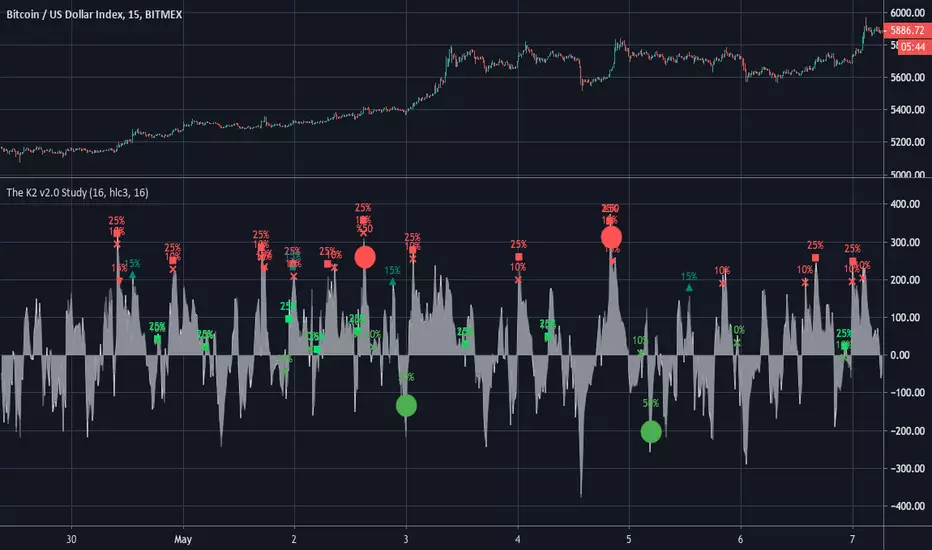
The K2 v2.0 StudySTUDY VERSION:
The updated version of THE K2 is finally here! A lot of changes were made when creating the second version of the K2, but the result was a much higher level of performance.
The new K2 consists of a 1 minute 'fast' CCI and 15 minute slow CCI . We identified key thresholds for each one to construct a more complex trading approach. The green shapes on the chart represent buy signals and the red shapes are sell signals. The text above them is the percentage of equity used in each trade. These percentages are based on the CCI's position relative to the fixed thresholds. By doing this, the strategy achieves a higher frequency of trades and lower max drawdown.
Here's a guide to help understand the various shapes:
Circles: Slow CCI trades using 50% equity.
Squares: 25%
Triangles: 15%
Crosses(X's): 10%
We will update the user guide on our website(ProfitProgrammers.com) to include an in-depth guide to using the new K2.
The results displayed on the chart are the results for the month of April. As always, the K2 strategy comes with its study equivalent(at no extra cost).
If you're interested in the K2, message us for a free 3 day trial!
This study can also be updated for fully automated trading.
All of our invite only studies and strategies can be found on our website ProfitProgrammers.com
The K2 v2.0 StrategyThe updated version of THE K2 is finally here! A lot of changes were made when creating the second version of the K2, but the result was a much higher level of performance.
The new K2 consists of a 1 minute 'fast' CCI and 15 minute slow CCI. We identified key thresholds for each one to construct a more complex trading approach. The green shapes on the chart represent buy signals and the red shapes are sell signals. The text above them is the percentage of equity used in each trade. These percentages are based on the CCI's position relative to the fixed thresholds. By doing this, the strategy achieves a higher frequency of trades and lower max drawdown.
Here's a guide to help understand the various shapes:
Circles: Slow CCI trades using 50% equity.
Squares: 25%
Triangles: 15%
Crosses(X's): 10%
We will update the user guide on our website(ProfitProgrammers.com) to include an in-depth guide to using the new K2.
The results displayed on the chart are the results for the month of April. As always, the K2 strategy comes with its study equivalent(at no extra cost).
If you're interested in the K2, message us for a free 3 day trial!
All of our invite only studies and strategies can be found on our website ProfitProgrammers.com


Combo Strategy 123 Reversal & CCI This is combo strategies for get a cumulative signal.
First strategy
This System was created from the Book "How I Tripled My Money In The
Futures Market" by Ulf Jensen, Page 183. This is reverse type of strategies.
The strategy buys at market, if close price is higher than the previous close
during 2 days and the meaning of 9-days Stochastic Slow Oscillator is lower than 50.
The strategy sells at market, if close price is lower than the previous close price
during 2 days and the meaning of 9-days Stochastic Fast Oscillator is higher than 50.
Second strategy
The Commodity Channel Index (CCI) is best used with markets that display cyclical or
seasonal characteristics, and is formulated to detect the beginning and ending of these
cycles by incorporating a moving average together with a divisor that reflects both possible
and actual trading ranges. The final index measures the deviation from normal, which indicates
major changes in market trend.
To put it simply, the Commodity Channel Index (CCI) value shows how the instrument is trading
relative to its mean (average) price. When the CCI value is high, it means that the prices are
high compared to the average price; when the CCI value is down, it means that the prices are low
compared to the average price. The CCI value usually does not fall outside the -300 to 300 range
and, in fact, is usually in the -100 to 100 range.
WARNING:
- For purpose educate only
- This script to change bars colors.

The K2 StrategyStrategy version of the K2 Indicator. The K2 uses a fast and slow CCI to identify optimal long entry and exit opportunities.


Enhanced Commodity Channel Index(CCI) Cycle Indicator - MTFThis is a heavily modified and enhanced version of CCI Cycle and my first indicator released using Pine Script version 4.0, something I contributed to often in a small role, and will continue to do, in my free time. This indicator is highly reactive and does a magnificent job of identifying fluctuations in market cycles when they are not trending. Compared to my free "Enhanced Schaff Trend Cycle Indicator" presented above along side this indicator, CCI Cycle is superior in it's own way, but a superb companion for providing a more accurate signals analysis. I packed as much tech as I could into this indicator along with astounding color and agility, and I'm unsure if there is any room for major improvements in the near future.
Features List Includes:
I.P.O.C.S.(Initial Public Offering Clean Start) Technology - plotting from day one, minute one of IPO
Fully adjustable M.T.F. ( Multiple Time Frame ) is enable/disable capable
Enable/disable dark background for enhanced visibility
"Source" Selection
Multiple CCI Cycle adjustments
Moving average selection
Ranges and thresholds are enable/disable capable
Upper threshold adjustment
Red/green secondary range that adjusts +/- from the upper/lower thresholds
Lower threshold adjustment
Adjustable centered medial zone
Highlighting is enable/disable capable
Normalized zero mean to +/-1
This is not a freely available indicator, FYI. To witness my Pine poetry in action, properly negotiated requests for unlimited access, per indicator, may ONLY be obtained by direct contact with me using TV's "Private Chats" or by "Message" in my member name above. The comments section below is solely just for commenting and other remarks, ideas, compliments, etc... If you do have any questions or comments regarding this indicator, I will consider your inquiries, thoughts, and ideas presented below in the comments section, when time provides it. As always, "Like" it if you like it, and also return to my scripts list occasionally for additional postings. Have a profitable future everyone!

Woodies CCX Vol Weighted + CZ + SW indicatorsVersion of Woodies CCX that takes in account volume (uses Vol Weighted JMA). All credits for the original code go to @4alphabsolute

Woodies CCX + CZ + SW indicatorsVersion of Woodies CCI that uses JMA ("zero-lag" Jurik's Moving Average) instead of SMA (and EMA34). CCX responds on price much faster than CCI. I recommend to play with Power parameters, higher Power will fit MA closer to prices, lower values will give smoother result.
All credits for the original code go to @4alphabsolute
Crypto HODLCrypto indicator for the longterm traders. Getting good low entries and with the right stragety highly profitble.


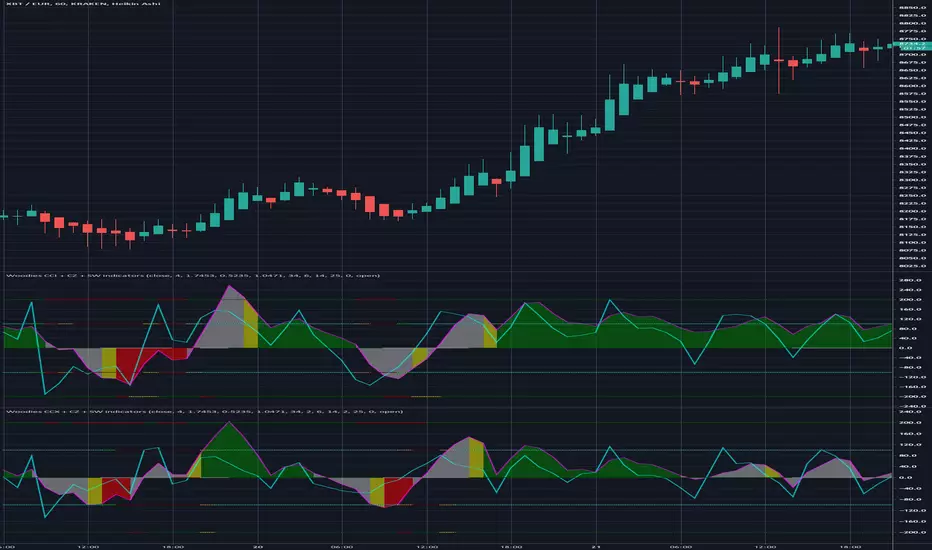
Woodies CCI + CZ + SW indicatorsBased on
Changes:
- red bars removed and replaced by silver ones
- yellow bar (start of new trend) had been added
- more parameters can be set in settings dialogue (SW constants as well)
