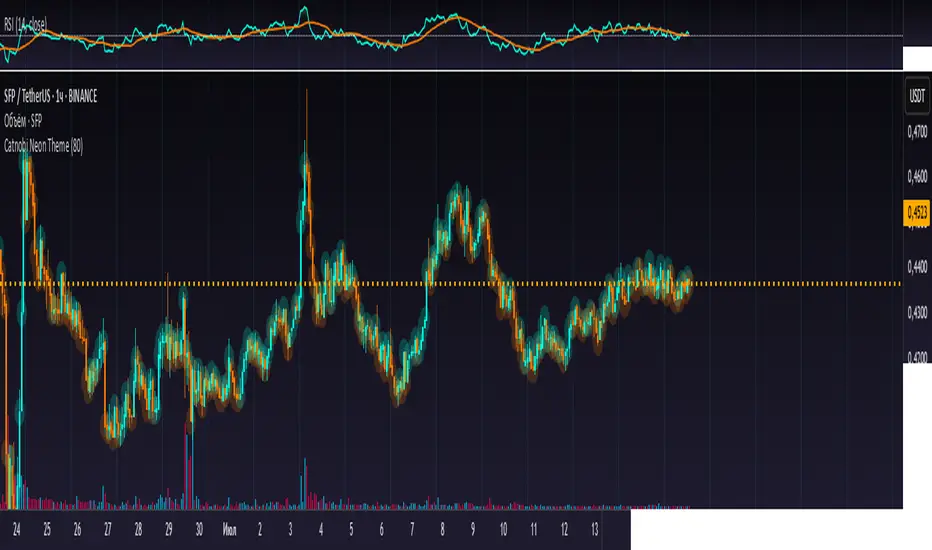
Catnobi Neon ThemeCatnobi Neon Theme 80 — A Purely Visual Candle-Glow Overlay (Open-Source)
What the script does
Catnobi Neon Theme 80 swaps the regular candle view for a vivid neon-glow style:
Candles (body + wicks) show up in bright turquoise when the bar closes up and in bright amber when it closes down.
Glow halo A soft, semi-transparent outline surrounds every candle, giving the impression of neon light.
Volume histogram Bars use the same palette as the candles so the entire chart keeps a consistent, cyber-punk colour scheme.
The script contains no trading signals, alerts, or calculations—it is purely decorative.
How it works (high-level)
Dual plot() technique – Each candle is drawn twice:
an enlarged, low-opacity outline creates the halo;
a second, normal-width layer renders the actual candle.
plotcandle() core – Price is still displayed with Pine’s built-in candle plotting, so the visual effect never distorts OHLC values.
Volume overlay – A simple plot() of volume with the same colour map keeps chart styling unified.
Because only basic Pine primitives are used, the script is light on resources and responsive even on lower-end machines.
Inputs / Settings
Input name Purpose Range / type Default
Theme Pick one of five curated colour sets 1 – 5 3
Glow width Thickness of the halo line (pixels) 1 – 10 4 px
Glow opacity Halo transparency 0 – 100 % 70 %
Hide volume Toggle neon volume bars true/false false
All colours are defined in HSL space, so you can easily tweak hues without losing contrast.
How to use it
Switch to a dark chart background – The glow effect is optimised for dark hex #0e0e0e, but any dark theme works.
Add Catnobi Neon Theme 80 as an overlay indicator.
(Optional) Hide the native candles via Chart settings ▸ Symbol ▸ Bar color opacity = 0 %.
Experiment with Theme, Glow width, and Glow opacity until the style matches your preference.
Why it qualifies for publication
Open-source – Code is fully visible, so the script does not fall under the “closed-source needs unique logic” rule.
Originality is visual, not trading – There are many indicator strategies, but very few lightweight, purely aesthetic glow overlays that rely solely on stock Pine functions.
Clear description – Users know exactly what to expect (no hidden buy/sell logic) and how the glow is generated.
MIT License
This script is released under the MIT licence. Feel free to fork, adapt, or redistribute—just keep the original author attribution somewhere in your code header.
The script is intended for traders who enjoy a cyber-punk vibe on their charts without compromising clarity or performance. Happy glowing!
Concept
ARSI – (VWAP & ATR) 3QKRAKThe ARSI Long & Short – Dynamic Risk Sizing (VWAP & ATR) indicator combines three core components—an adjusted RSI oscillator (ARSI), Volume‐Weighted Average Price (VWAP), and Average True Range (ATR)—so that entry/exit signals and position sizing are always tailored to current market conditions. ARSI, plotted from 0 to 100 with clearly marked overbought and oversold zones, is the primary signal driver: when ARSI falls below the lower threshold it indicates an excessive sell‐off and flags a long opportunity, whereas a break above the upper threshold signals overextended gains and foreshadows a short. A midpoint line at 50 can serve as an early exit or reduction signal when crossed against your position.
VWAP, showing the volume‐weighted average price over the chosen period, acts as a trend filter—long trades are only taken when price sits above VWAP, and shorts only when it’s below—ensuring each trade aligns with the prevailing market momentum. ATR measures current volatility and is used both to set safe stop‐loss levels and to dynamically size each position. In practice, this means positions automatically shrink in high‐volatility environments and grow in quieter markets, all while risking a fixed percentage of your capital.
Everything appears on a single chart: the ARSI pane below the price window with its reference levels; VWAP overlaid on the price; and the ATR‐based stop‐loss distances graphically displayed. Traders thus get a comprehensive, at-a-glance view of entries, exits, trend confirmation, and exactly how large a position they can safely take. The indicator runs in real time, removing the need for manual parameter calculations and letting you focus on strategic decision-making.

Thursday High & Friday Low Breakout (Safe)This TradingView Pine Script indicator is designed to help traders visually track two key situational breakout patterns that occur across the Thursday–Monday trading window. Specifically, it detects:
Whether the high of Thursday has been taken out on Friday, and
Whether the low of Friday has been breached on Monday.
These conditions are based on commonly observed market behaviors where key highs and lows from the previous days often act as liquidity targets or decision points. By identifying these events, traders can better understand the unfolding market structure and anticipate potential follow-through or reversals.
The script stores Thursday's high and Friday's low at the close of each respective day and evaluates the breakout conditions in real-time as new bars are printed. When Friday’s price action exceeds Thursday’s high, an upward-pointing green triangle is plotted above the bar. Conversely, when Monday’s price breaks below Friday’s low, a red downward triangle is plotted below the bar.
Unlike scripts that rely on label.new (which can create compatibility issues on certain platforms or versions), this version uses plotshape() to ensure wide compatibility and reliable visual cues, even on older Pine Script environments. This makes it lightweight, robust, and ideal for traders who want a quick-glance tool without cluttering their charts.
The indicator is best used on 1H, 4H, or daily timeframes to clearly observe the Thursday–Friday–Monday structure. It works well in both trending and consolidating markets as a tool to mark potential liquidity sweeps or break-of-structure setups.

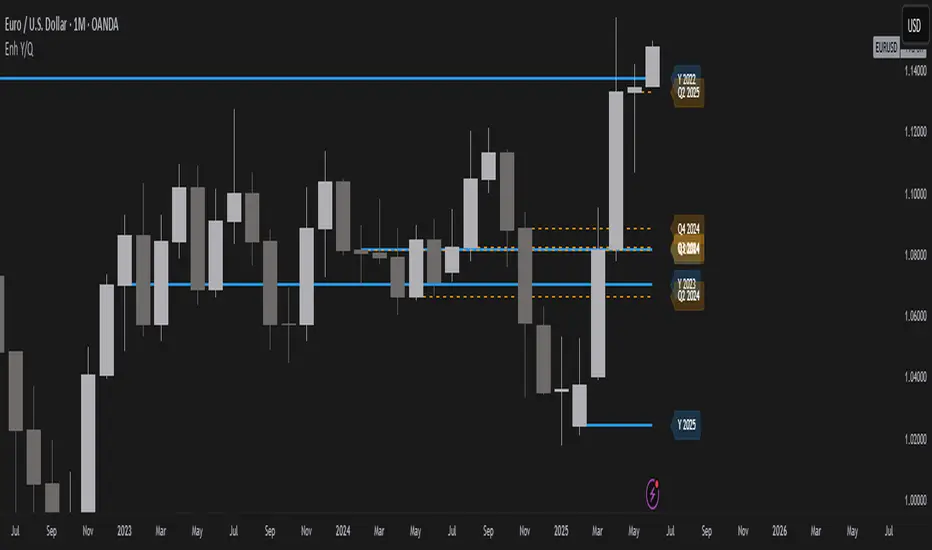
Year/Quarter Open LevelsDeveloped by ADEL CEZAR and inspired by insights from ERDAL Y, this indicator is designed to give traders a clear edge by automatically plotting the Yearly Open and Quarterly Open levels — two of the most critical institutional reference points in price action.
These levels often act as magnets for liquidity, bias confirmation zones, and support/resistance pivots on higher timeframes. With customizable settings, you can display multiple past opens, fine-tune label positions, and align your strategy with high-timeframe structure — all in a lightweight, non-intrusive design.
If you follow Smart Money Concepts (SMC), ICT models, or build confluence using HTF structures and range theory, this script will integrate seamlessly into your workflow.
McGinley Dynamic debugged🔍 McGinley Dynamic Debugged (Adaptive Moving Average)
This indicator plots the McGinley Dynamic, a mathematically adaptive moving average designed to reduce lag and better track price action during both trends and consolidations.
✅ Key Features:
Adaptive smoothing: The McGinley Dynamic adjusts itself based on the speed of price changes.
Lag reduction: Compared to traditional moving averages like EMA or SMA, McGinley provides smoother yet responsive tracking.
Stability fix: This version includes a robust fix for rare recursive calculation issues, particularly on low-priced historical assets (e.g., Wipro pre-2000).
⚙️ What’s Different in This Debugged Version?
Implements manual clamping on the source / previous value ratio to prevent mathematical spikes that could cause flattening or distortion in the plotted line.
Ensures more stable behavior across all instruments and timeframes, especially those with historically low price points or volatile early data.
💡 Use Case:
Ideal for:
Trend confirmation
Entry filtering
Adaptive support/resistance visualization
Improving signal precision in low-volatility or high-noise environments
⚠️ Notes:
Works best when combined with volume filters or other trend indicators for validation.
This version is optimized for visual use—for signal generation, consider pairing it with additional logic or thresholds.

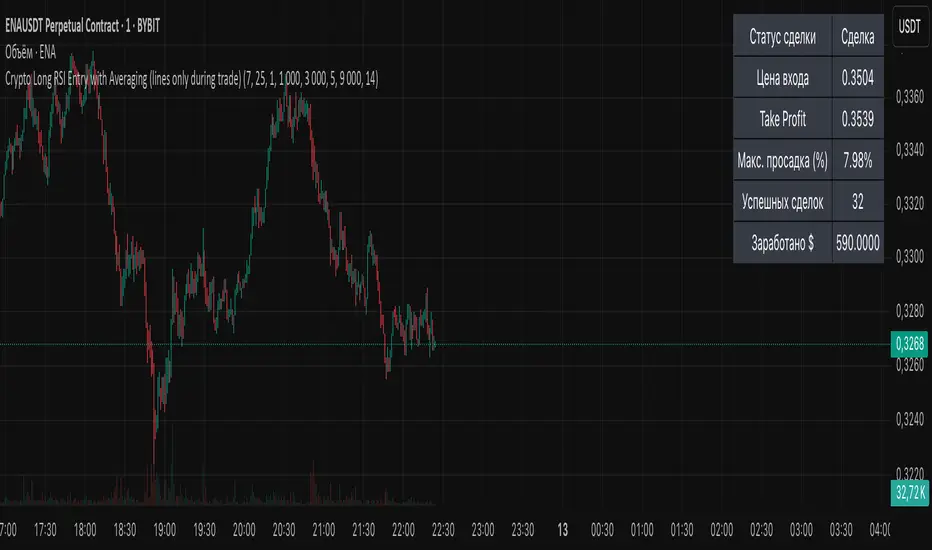
Crypto Long RSI Entry with AveragingIndicator Name:
04 - Crypto Long RSI Entry with Averaging + Info Table + Lines (03 style lines)
Description:
This indicator is designed for crypto trading on the long side only, using RSI-based entry signals combined with a multi-step averaging strategy and a visual information panel. It aims to capture price rebounds from oversold RSI levels and manage position entries with two staged averaging points, optimizing the average entry price and take-profit targets.
Key Features:
RSI-Based Entry: Enters a long position when the RSI crosses above a defined oversold level (default 25), with an optional faster entry if RSI crosses above 20 after being below it.
Two-Stage Averaging: Allows up to two averaging entries at user-defined price drop percentages (default 5% and 14%), increasing position size to improve average entry price.
Dynamic Take Profit: Adjusts take profit targets after each averaging stage, with customizable percentage levels.
Visual Signals: Marks entries, averaging points, and exits on the chart using colored labels and lines for easy tracking.
Info Table: Displays current trade status, averaging stages, total profit, number of wins, and maximum drawdown percentage in a table on the chart.
Graphical Lines: Shows horizontal lines for entry price, take profit, and averaging prices to visually track trade management.
Dr.Avinash Talele quarterly earnings, VCP and multibagger trakerDr. Avinash Talele Quarterly Earnings, VCP and Multibagger Tracker.
📊 Comprehensive Quarterly Analysis Tool for Multibagger Stock Discovery
This advanced Pine Script indicator provides a complete financial snapshot directly on your chart, designed to help traders and investors identify potential multibagger stocks and VCP (Volatility Contraction Pattern) setups with precision.
🎯 Key Features:
📈 8-Quarter Financial Data Display:
EPS (Earnings Per Share) - Track profitability trends
Sales Revenue - Monitor business growth
QoQ% (Quarter-over-Quarter Growth) - Spot acceleration/deceleration
ROE (Return on Equity) - Assess management efficiency
OPM (Operating Profit Margin) - Evaluate operational excellence
💰 Market Metrics:
Market Cap - Current company valuation
P/E Ratio - Valuation assessment
Free Float - Liquidity indicator
📊 Technical Positioning:
% Down from 52-Week High - Identify potential bottoming patterns
% Up from 52-Week Low - Track momentum from lows
Turnover Data (1D & 50D Average) - Volume analysis
ADR% (Average Daily Range) - Volatility measurement
Relative Volume% - Institutional interest indicator
🚀 How It Helps Find Multibaggers:
1. Growth Acceleration Detection:
Consistent EPS Growth: Identifies companies with accelerating earnings
Revenue Momentum: Tracks sales growth patterns quarter-over-quarter
Margin Expansion: Spots improving operational efficiency through OPM trends
2. VCP Pattern Recognition:
Volatility Contraction: ADR% helps identify tightening price ranges
Volume Analysis: Relative volume shows institutional accumulation
Distance from Highs: Tracks healthy pullbacks in uptrends
3. Fundamental Strength Validation:
ROE Trends: Ensures management is efficiently using shareholder capital
Debt-Free Growth: High ROE with growing margins indicates quality growth
Scalability: Revenue growth vs. margin expansion analysis
4. Entry Timing Optimization:
52-Week Positioning: Enter near lows, avoid near highs
Volume Confirmation: High relative volume confirms breakout potential
Valuation Check: P/E ratio helps avoid overvalued entries
💡 Multibagger Characteristics to Look For:
✅ Consistent 15-20%+ EPS growth across multiple quarters
✅ Accelerating revenue growth with QoQ% improvements
✅ ROE above 15% and expanding
✅ Operating margins improving over time
✅ Low debt (indicated by high ROE with growing profits)
✅ Strong cash generation (reflected in consistent growth metrics)
✅ 20-40% down from 52-week highs (ideal entry zones)
✅ Above-average volume during consolidation phases
🎨 Visual Design:
Clean white table with black borders for maximum readability
Color-coded QoQ% changes (Green = Growth, Red = Decline)
Centered positioning for easy chart analysis
8-quarter historical view for trend identification
📋 Perfect For:
Long-term investors seeking multibagger opportunities
Growth stock enthusiasts tracking earnings acceleration
VCP pattern traders looking for breakout candidates
Fundamental analysts requiring quick financial snapshots
Swing traders timing entries in growth stocks
⚡ Quick Setup:
Simply add the indicator to any NSE/BSE stock chart and instantly view comprehensive quarterly data. The table updates automatically with the latest financial information, making it perfect for screening and monitoring your watchlist.
🔍 Start identifying your next multibagger today with this powerful combination of fundamental analysis and technical positioning data!
Disclaimer: This indicator is for educational and analysis purposes. Always conduct thorough research and consider risk management before making investment decisions.

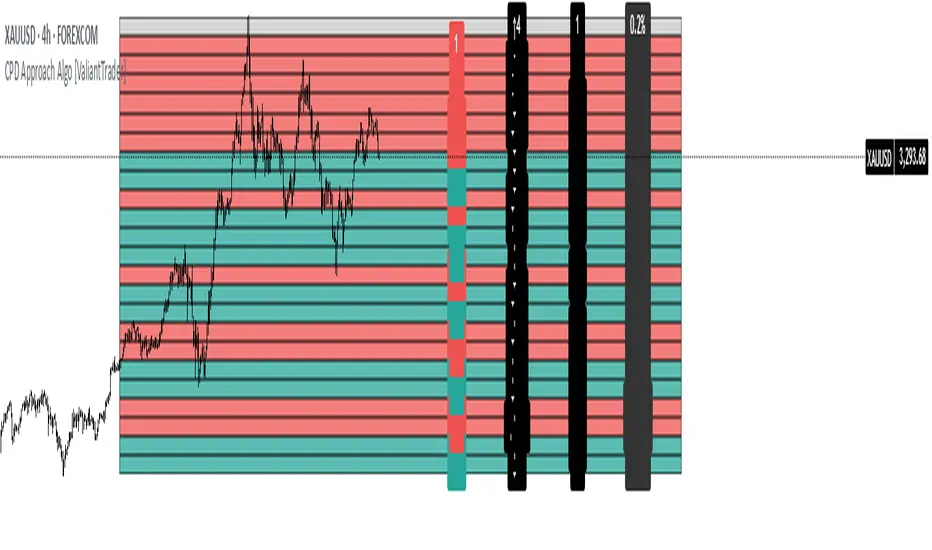
CPD Approach Algo [ValiantTrader]CPD Approach Algo Indicator Explained
This indicator, created by ValiantTrader, is a sophisticated tool for analyzing price action and market structure across different timeframes. Here's how it works and how traders use it:
Core Functionality
The CPD (Candle Price Distribution) Approach Algo divides the price range into horizontal zones and analyzes several key metrics within each zone:
Price Distribution: Shows where price has spent most time (high concentration areas)
Volume Clusters: Identifies zones with significant trading volume
Pressure Zones: Detects buying/selling pressure in specific price levels
Candle Differences: Highlights transitions between zones
How Traders Use It
1. Identifying Key Levels
The colored zones (green for buy, red for sell, gray neutral) show where price has historically reacted
Dense candle clusters indicate strong support/resistance areas
2. Volume Analysis
Volume clusters reveal where most trading activity occurred
High volume zones often act as magnets for price or reversal points
3. Pressure Detection
The pressure zones (with ↑ and ↓ arrows) show where buying or selling pressure was strongest
Helps identify potential breakout or reversal points
4. Multi-Timeframe Analysis
The custom timeframe input allows analyzing higher timeframe structure while viewing lower timeframe charts
Helps align trades with the dominant timeframe's structure
5. Transition Analysis
The delta values between zones show how price is moving between levels
Positive deltas (green) show upward momentum, negative (red) show downward
Practical Trading Applications
Support/Resistance Trading: Fade price at dense candle clusters with opposing pressure
Breakout Trading: Trade breaks from low-candle-count zones into high-volume zones
Mean Reversion: Trade returns to high-volume value areas after deviations
Trend Confirmation: Consistent pressure in one direction confirms trend strength
The indicator provides a comprehensive view of market structure by combining price, volume, and time elements across customizable timeframes, helping traders make more informed decisions about potential entries, exits, and key levels to watch.
Liquidity Pools [ValiantTrader_]Liquidity Pools Indicator Explanation
This "Liquidity Pools" indicator by ValiantTrader is designed to help traders visualize potential areas of liquidity in the market. Here's how it works and how traders use it:
Core Functionality
Anchor Price: The indicator uses the opening price of each new bar as its anchor point (base reference price).
Liquidity Levels: It creates multiple price levels above and below this anchor price based on:
User-defined number of levels (default 24)
User-defined price range percentage (default 2%)
Liquidity Size Calculation: For each level, it calculates a "size" value (between 100-500) based on the distance from the anchor price.
How Traders Use It
Identifying Potential Support/Resistance: The horizontal lines mark price levels where liquidity might pool, which can act as support or resistance zones.
Order Placement: Traders may place limit orders near these levels anticipating price reactions.
Breakout Trading: When price breaks through multiple levels with conviction, it may signal a strong trend.
Mean Reversion: The indicator helps identify how far price has moved from its anchor point, which can be useful for mean-reversion strategies.
Size Interpretation: The numeric labels show relative "size" values - higher numbers indicate levels farther from anchor, potentially representing stronger liquidity zones.
Visualization
The indicator draws horizontal lines at each liquidity level
On the last bar, it displays numeric size values at each level
A table at the bottom right summarizes the levels and their sizes
Key Settings
Liquidity Levels: Controls how many levels to display (more levels show a wider price range)
Price Range: Determines how far apart the levels are spaced (percentage from anchor)
This tool is particularly useful for traders who incorporate liquidity concepts into their trading strategies, helping them visualize where resting orders might cluster in the market

Candle Liquidity Algo [ValiantTrader]Explanation of the "Candle Liquidity Algo" Indicator
This indicator is designed to help traders identify potential trading opportunities by analyzing liquidity zones and divergences between price action and these zones on higher timeframes.
Key Components:
1. Timeframe Settings
The indicator allows you to select a custom timeframe (like 'D' for daily, '60' for 60 minutes, etc.)
It then displays the first candle of each new period on this higher timeframe directly on your chart
2. Liquidity Zones
Creates smoothed high and low levels (using a simple moving average) from the higher timeframe
These act as potential support/resistance zones where liquidity may be concentrated
3. Divergence Detection
Looks for divergences between price action and the liquidity zones:
Bullish Divergence: When price makes a lower low but the liquidity zone low is higher
Bearish Divergence: When price makes a higher high but the liquidity zone high is lower
4. Visual Elements
Plots the first candle of each new higher timeframe period on your chart (colored green for up, red for down)
Draws labels when divergences are detected (green "Bullish Div" below price for bullish divergences, red "Bearish Div" above for bearish)
Draws temporary lines marking the relevant price levels where divergences occur
5. Alerts
The indicator can trigger alerts when divergences are detected, which can be useful for traders who want notifications about potential trading setups
How to Use in Trading:
Identify the Higher Timeframe Structure: The indicator shows you how the higher timeframe is developing while you're looking at a lower timeframe chart.
Watch for Divergences: When you see:
Price making lower lows but liquidity zones making higher lows → potential bullish reversal
Price making higher highs but liquidity zones making lower highs → potential bearish reversal
Use Liquidity Zones as Targets/Stops: The smoothed high/low levels can act as potential take-profit areas or stop-loss levels.
Combine with Other Confirmation: Like any indicator, it's best used with other confirmation signals (price action patterns, volume analysis, etc.)
The indicator is particularly useful for traders looking to align their trades with higher timeframe structure while operating on lower timeframes for entry precision.

Supertrend with Volume Filter AlertSupertrend with Volume Filter Alert - Indicator Overview
What is the Supertrend Indicator?
The Supertrend indicator is a popular trend-following tool used by traders to identify the direction of the market and potential entry/exit points. It is based on the Average True Range (ATR), which measures volatility, and plots a line on the chart that acts as a dynamic support or resistance level. When the price is above the Supertrend line, it signals an uptrend (bullish), and when the price is below, it indicates a downtrend (bearish). The indicator is particularly effective in trending markets but can generate false signals during choppy or sideways conditions.
How This Script Works
The "Supertrend with Volume Filter Alert" enhances the classic Supertrend indicator by adding a customizable volume filter to improve signal reliability.
Here's how it functions:
Supertrend Calculation:The Supertrend is calculated using the ATR over a user-defined period (default: 55) and a multiplier (default: 1.85). These parameters control the sensitivity of the indicator:A higher ATR period smooths out volatility, making the indicator less reactive to short-term price fluctuations.The multiplier determines the distance of the Supertrend line from the price, affecting how quickly it responds to trend changes.The script plots the Supertrend line in cyan for uptrends and red for downtrends, making it easy to visualize the market direction.
Volume Filter:A key feature of this script is the volume filter, which helps filter out false signals in choppy markets. The filter compares the current volume to the average volume over a lookback period (default: 20) and only triggers signals if the volume exceeds the average by a specified multiplier (default: 2.0).This ensures that trend changes are accompanied by significant market participation, increasing the likelihood of a genuine trend shift.
Signals and Alerts:
Buy signals (cyan triangle below the bar) are generated when the price crosses above the Supertrend line (indicating an uptrend) and the volume condition is met.Sell signals (red triangle above the bar) are generated when the price crosses below the Supertrend line (indicating a downtrend) and the volume condition is met.Alerts are set up for both buy and sell signals, notifying traders only when the volume filter confirms the trend change.
Customizable Settings for Multiple Markets
The default settings in this script (ATR Period: 55, ATR Multiplier: 1.85, Volume Lookback Period: 20, Volume Multiplier: 2.0) were carefully chosen to provide a balance of sensitivity and reliability across various markets, including stocks, indices (like the S&P 500), forex, and cryptocurrencies.
Here's why these settings work well:
ATR Period (55): A longer ATR period smooths out volatility, making the indicator less prone to whipsaws in volatile markets like crypto or forex, while still being responsive enough for trending markets like indices.
ATR Multiplier (1.85): This multiplier strikes a balance between capturing early trend changes and avoiding noise. A smaller multiplier would make the indicator too sensitive, while a larger one might miss early opportunities.
Volume Lookback Period (20): A 20-bar lookback for volume averaging provides a robust baseline for identifying significant volume spikes, adaptable to both short-term (e.g., daily charts) and longer-term (e.g., weekly charts) timeframes.
Volume Multiplier (2.0): Requiring volume to be at least 2x the average ensures that only high-conviction moves trigger signals, which is crucial for markets with varying liquidity levels.
These parameters are fully customizable, allowing traders to adjust the indicator to their specific market, timeframe, or trading style. For example, you might reduce the ATR period for faster-moving markets or increase the volume multiplier for more conservative signal filtering.
How the Volume Filter Reduces Bad Trades in Choppy Markets
One of the main drawbacks of the Supertrend indicator is its tendency to generate false signals during choppy or ranging markets, where price fluctuates without a clear trend. The volume filter in this script addresses this issue by ensuring that trend changes are backed by significant market activity:
In choppy markets, price movements often lack strong volume, leading to false breakouts or reversals. By requiring volume to be a multiple (default: 2x) of the average volume over the lookback period, the script filters out these low-volume, low-conviction moves.This reduces the likelihood of taking bad trades during sideways markets, as only trend changes with strong volume confirmation will trigger signals. For example, on a daily chart of the S&P 500, a buy signal will only fire if the price crosses above the Supertrend line and the volume on that day is at least twice the 20-day average, indicating genuine buying pressure.
Usage Tips
Markets and Timeframes: This indicator is versatile and can be used on various assets (stocks, indices, forex, crypto) and timeframes (1-minute, 1-hour, daily, etc.). Adjust the settings based on the market's volatility and your trading strategy.
Combine with Other Indicators: While the volume filter improves reliability, consider using additional indicators like RSI or MACD to confirm trends, especially in ranging markets.
Backtesting: Test the indicator on historical data for your chosen market to optimize the settings and ensure they align with your trading goals.
Alerts: Set up alerts for buy and sell signals to stay informed of high-probability trend changes without constantly monitoring the chart.
ConclusionThe "Supertrend with Volume Filter Alert" is a powerful tool for trend-following traders, combining the simplicity of the Supertrend indicator with a volume-based filter to enhance signal accuracy. Its customizable settings make it adaptable to multiple markets, while the volume filter helps reduce false signals in choppy conditions, allowing traders to focus on high-probability trades. Whether you're trading stocks, indices, forex, or crypto, this indicator can help you identify trends with greater confidence.

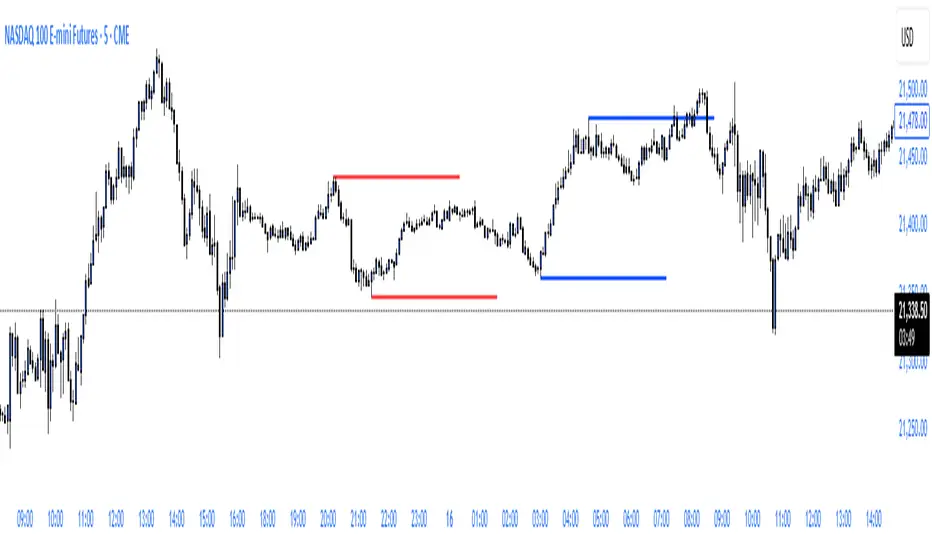
ryantrad3s session highs and lowsThis indicator allows you find London Session and Asia Session highs and lows without marking them yourself. This indicator can also help you find good draws on liquidity for the day and potential highs and lows you can target during that trading day. I recommend trading NQ and ES with this indicator because that's what I seen it work best with. The blue lines are London Session high and low and the red lines are Asia Session high and low. Hope this can save you time marking out your chart before market open.
RSI Z-Score + TableHow It Works
RSI Calculation
The standard RSI is computed over a user-defined period (default: 14), measuring the strength of recent price movements.
Z-Score Transformation
The RSI is then normalized using the Z-Score formula:
ini
Kopieren
Bearbeiten
Z = (RSI - Mean) / Standard Deviation
This highlights whether RSI is unusually high or low compared to its historical behavior.
Smoothing
An optional EMA is applied to the Z-Score for smoother and more reliable signals (default: 10-period smoothing).
Z-Score Table
A real-time value of the RSI Z-Score is displayed in a table in the top-right of the indicator pane.
The value is clamped between +2 and -2
+2 aligns with strong overbought RSI conditions
-2 aligns with strong oversold RSI conditions
How to Use It
Buy Signal Potential: When the Z-Score drops below -1.5 or -2 → statistically oversold RSI
Sell Signal Potential: When the Z-Score rises above +1.5 or +2 → statistically overbought RSI
Use in Confluence: Combine with price action, trend filters, or other Z-Score indicators (e.g. OBV, VWAP, VIX) for SDCA or mean-reversion strategies

UNITED TRADING COMMUNITY WaterMarkWATER MARK indicator. Will allow you to improve the order of the entries you need on the chart.
1. Name and date for the traded instrument
2. Watermarks to protect your charts (in the center and around the perimeter of the chart)
3. The new "notes" option will allow you to keep focus on the factors that are important to you on the chart.
Very flexible settings for any notes, labels, watermarks on the chart that are important to you.
Индикатор WATER MARK . Даст возможность вам улучшить порядок нужных вам записей на графике.
1. Название и дата для торгуемого инструмента
2. Водные знаки для защиты ваших графиков ( в центре и по периметру графика)
3. Новая опция "заметки" позволит вам держать фокус на важных для вас факторах на графике.
Очень гибкая настройка , любых значимых для вас заметок , лейблов , вотермарк на графике.

PORTFOLIO TABLE Full [Titans_Invest]PORTFOLIO TABLE Full
This is a complete table for monitoring your assets or cryptocurrencies in your SPOT wallet without needing to access your broker’s website or app.
⯁ HOW TO USE THIS TABLE❓
Simply select the asset and enter the amount you hold.
The table will display the value of each asset and the total value of your portfolio.
You can monitor up to 19 assets in real time.
⯁ CONVERT VALUES
You can also enable and select a currency for conversion.
For example, cryptocurrencies are calculated in US dollars by default, but you can choose euros as the conversion currency.
The values originally in dollars will then be displayed in euros.
⯁ TRACK THE DAILY VARIATION OF YOUR PORTFOLIO
You’ll be able to monitor your portfolio’s raw daily variation in real time.
🔶 Track your Portfolio in real time:
🔶 Add your local Currency to Convert Values:
🔶 Follow your Portfolio Live:
___________________________________________________________
📜 SCRIPT : PORTFOLIO TABLE Full
🎴 Art by : @Titans_Invest & @DiFlip
👨💻 Dev by : @Titans_Invest & @DiFlip
🎑 Titans Invest — The Wizards Without Gloves 🧤
✨ Enjoy!
___________________________________________________________
o Mission 🗺
• Inspire Traders to manifest Magic in the Market.
o Vision 𐓏
• To elevate collective Energy 𐓷𐓏

Order Blocks [TakingProphets]The Order Blocks indicator automatically finds and highlights institutional Order Blocks (OBs) on your chart — powerful price zones where smart money has previously entered the market with large orders. These areas often act as strong support or resistance, and they’re key tools for traders using ICT (Inner Circle Trader) and Smart Money Concepts (SMC) strategies.
📘 What’s an Order Block?
An Order Block is usually the last bullish or bearish candle before a big move or shift in market structure. It represents where banks, funds, or institutions placed large buy or sell orders. Retail traders often miss these zones, but smart money traders use them to anticipate where price may return, stall, or even reverse.
This indicator identifies these zones for you — both bullish and bearish — so you don’t have to manually mark them.
🔍 How the Indicator Works
It waits for a market structure shift — when price breaks out of a recent high or low range.
Then it looks back to find the last opposite candle before that breakout — that candle becomes the OB.
It draws a box from the open of that candle to the high/low (depending on type) and keeps updating the box forward.
You can choose how strict the OBs need to be (Small, Medium, or Large) using ATR-based size filtering.
🔄 Breaker Blocks (Optional Feature)
If price closes through an Order Block in the opposite direction, that OB is considered invalid. But instead of deleting it, the indicator can automatically draw a Breaker Block. Breakers are important because they often become new support or resistance zones — a sign the market has flipped direction and is now respecting that level in a new way.
🎛 Custom Settings
Choose OB detection sensitivity: High (shows smaller moves), Medium, or Low (only the biggest institutional moves).
Customize colors and whether you want to show borders on each block.
Turn Breaker Blocks on or off based on your strategy.
Everything is dynamic and updates live as price evolves.
💡 Why Use It?
Knowing where smart money entered the market gives you a huge edge. Price often returns to these Order Blocks to "rebalance" or fill unfilled orders. With this indicator, you’ll:
Spend less time marking charts.
Spot high-probability entry zones faster.
Avoid common retail traps and trade with the algorithm.

DXY-XAUUSD Correlation with ThresholdsIndicator Description: "DXY-XAUUSD Correlation with Thresholds"
This indicator tracks the dynamic correlation between the US Dollar Index (DXY) and gold prices (XAUUSD) over a user-defined period, expressed as a percentage. It calculates the rolling correlation coefficient between the closing prices of these two assets, scaled to ±100%, and visualizes it as a histogram.
Key Features:
Adjustable correlation period (default: 30 bars) and configurable positive/negative thresholds (default: ±70%).
Color-coded histogram: Intense green/red highlights correlations exceeding thresholds, signaling strong positive/negative relationships.
Horizontal dotted lines mark threshold levels, aiding in identifying overextended "overbought" or "oversold" correlation conditions.
An info table displays the current correlation value and active thresholds for quick reference.
Designed for traders analyzing the inverse relationship between the dollar and gold, this tool helps spot periods of extreme correlation divergence or convergence. The visual alerts and customizable parameters make it adaptable to various trading strategies and timeframes.
Note: The indicator is plotted in a separate pane (non-overlay) for clarity.

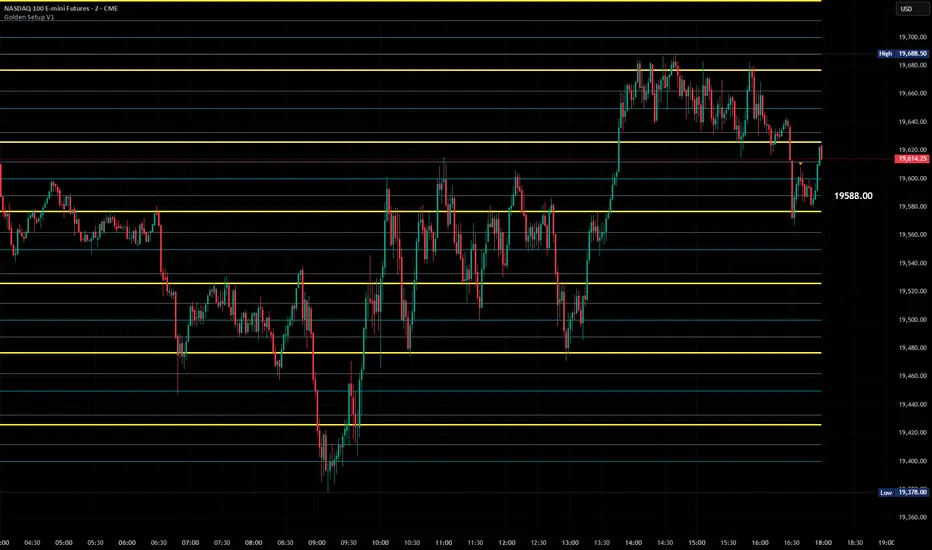
Golden Setup V1Golden Setup V1 is an overlay indicator that automates Tony Rago’s “Golden Setup” price-level framework. It divides the chart into fixed “blockSize” intervals (default 100 points) and plots a series of key horizontal levels within each block—levels at 00, 12, 26, 33, 50, 62, 77 and 88 offsets. These levels act as dynamic support and resistance grids that roll up or down as price moves between blocks.
Key Features
Customizable Offsets
Define eight offset levels corresponding to Rago’s Golden Setup:
00 (Round Number)
12 (Target 12)
26 (First “Golden” level)
33 (Target 33)
50 (Mid-block pivot)
62 (Target 62)
77 (Second “Golden” level)
88 (Target 88)
Multi-Block Coverage
Choose how many blocks above and below the current 100-point block you wish to display, so you always have levels drawn for the surrounding price range.
Golden-Only Filter
A handy toggle lets you show only the two “Golden” offsets (26 & 77), which many traders prioritize for high-probability bounce or breakout areas.
Dynamic Nearest-Level Label
Highlights the closest Golden Setup level (to the right edge of the chart) with a movable label, so you always know which level price is approaching.
Full Styling Control
Customize line colors, widths, block size, label fonts and opacity to suit your charting style.
How It Works
Block Calculation
On each bar, the indicator computes the “current block” by flooring (close / blockSize) and multiplying back by blockSize.
Level Offsets
It adds each of the eight user-defined offsets to that block base (and, if price has moved below the lowest offset, shifts the block down one interval).
Drawing
Each level is drawn as a horizontal line extending across the chart for as many blocks above/below as you select.
Nearest-Level Detection
Within the present block, it calculates which of the plotted levels is closest to price and displays that value on the right edge.
Usage Tips
Use the Golden-Only filter to declutter and focus solely on the 26 & 77 levels, which often act as strong intra-block pivot points.
Combine with volume or momentum indicators to confirm bounces at these levels.
Adjust blockSize (e.g. 50 or 200) if you wish to work in smaller or larger price increments.
⚠️ Disclaimer: This script is for educational and illustrative purposes only. Trading involves risk—always back-test and validate any strategy on a demo account before going live.
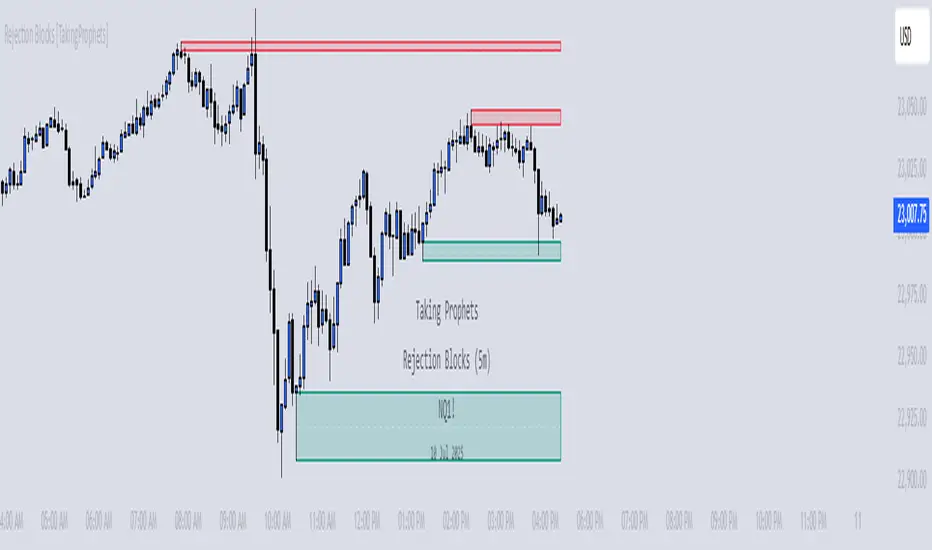
Rejection Blocks [Taking Prophets]🧠 Indicator Purpose:
The "Rejection Blocks" indicator is built for traders using Inner Circle Trader (ICT) concepts. It identifies key reversal zones where price action shows strong rejection through wick-dominant behavior around major swing points — often signaling institutional activity. Traders can use these rejection blocks to anticipate future support, resistance, and mitigation zones based on ICT principles.
🌟 What Makes This Indicator Unique:
Unlike standard support/resistance indicators, this script detects true rejection points by filtering only candles where the wick is significantly larger than the body, confirming potential order flow shifts according to ICT methodology.
It not only marks these zones but also:
Dynamically extends the blocks into the future.
Deletes blocks that get invalidated (mitigation logic).
Optionally plots a 50% midline within each block to refine entry or exit precision.
⚙️ How the Indicator Works:
Swing Detection: Identifies significant highs and lows based on pivot structures.
Rejection Filtering: Confirms strong rejections with wick-to-body ratio validation.
Block Creation: Highlights bullish or bearish rejection zones with customizable visuals.
Midline Plotting: (Optional) Marks the 50% midpoint of the block for entry targeting.
Mitigation and Cleanup: Blocks are deleted automatically when their structure is invalidated, maintaining a clean and accurate chart view.
🎯 How to Use It:
Identify Reaction Zones: Use rejection blocks as potential areas for price reversals or consolidations.
Plan Trade Entries: Monitor retests of the block boundaries or 50% lines for precision entries.
Manage Risk: If price closes beyond the block, treat it as a potential invalidation or Change in State of Delivery (CISD) event.
Best Contexts:
Near higher timeframe Points of Interest (POIs) such as Order Blocks or Fair Value Gaps.
During ICT Killzones (London Open, New York AM).
🔎 Underlying Concepts:
Wick Rejections: Indicate strong liquidity rejection, aligning with ICT liquidity sweep theories.
Mitigation Behavior: Blocks often serve as revisit zones where price rebalances after an aggressive move.
Adaptive Market Behavior: Rejection Blocks adjust dynamically based on real-time price action according to ICT market structure logic.
🎨 Customization Options:
Bullish and Bearish block colors with adjustable opacity.
Border visibility, border width, and 50% midline display toggles.
Label size customization for optimal chart clarity.
✅ Recommended for:
Traders following Inner Circle Trader (ICT) concepts.
Scalpers, intraday, and swing traders seeking accurate reversal and mitigation zones.
Traders looking to improve precision around liquidity rejection events.
CISD [TakingProphets]🧠 Indicator Purpose:
The "CISD - Change in State of Delivery" is a precision tool designed for traders utilizing ICT (Inner Circle Trader) conecpets. It detects critical shifts in delivery conditions after liquidity sweeps — helping you spot true smart money activity and optimal trade opportunities. This script is especially valuable for traders applying liquidity concepts, displacement recognition, and market structure shifts at both intraday and swing levels.
🌟 What Makes This Indicator Unique:
Unlike basic trend-following or scalping tools, CISD operates through a two-phase smart money logic:
Liquidity Sweep Detection (sweeping Buyside or Sellside Liquidity).
State of Delivery Change Identification (through bearish or bullish displacement after the sweep).
It intelligently tracks candle sequences and only signals a CISD event after true displacement — offering a much deeper context than ordinary indicators.
⚙️ How the Indicator Works:
Swing Point Detection: Identifies recent pivot highs/lows to map Buyside Liquidity (BSL) and Sellside Liquidity (SSL) zones.
Liquidity Sweeps: Watches for price breaches of these liquidity points to detect institutional stop hunts.
Sequence Recognition: Finds series of same-direction candles before sweeps to mark institutional accumulation/distribution.
Change of Delivery Confirmation: Confirms CISD only after significant displacement moves price against the initial candle sequence.
Visual Markings: Automatically plots CISD lines and optional labels, customizable in color, style, and size.
🎯 How to Use It:
Identify Liquidity Sweeps: Watch for CISD levels plotted after a liquidity sweep event.
Plan Entries: Look for retracements into CISD lines for high-probability entries.
Manage Risk: Use CISD levels to refine your stop-loss and profit-taking zones.
Best Application:
After stop hunts during Killzones (London Open, New York AM).
As part of the Flow State Model: identify higher timeframe PD Arrays ➔ wait for lower timeframe CISD confirmation.
🔎 Underlying Concepts:
Liquidity Pools: Highs and lows cluster stop orders, attracting institutional sweeps.
Displacement: Powerful price moves post-sweep confirm smart money involvement.
Market Structure: CISD frequently precedes major Change of Character (CHoCH) or Break of Structure (BOS) shifts.
🎨 Customization Options:
Adjustable line color, width, and style (solid, dashed, dotted).
Optional label display with customizable color and sizing.
Line extension settings to keep CISD zones visible for future reference.
✅ Recommended for:
Traders studying ICT Smart Money Concepts.
Intraday scalpers and higher timeframe swing traders.
Traders who want to improve entries around liquidity sweeps and institutional displacement moves.
🚀 Bonus Tip:
For maximum confluence, pair this with the HTF POI, ICT Liquidity Levels, and HTF Market Structure indicators available at TakingProphets.com! 🔥

Scalp Strategy by Trade Journey📘 Trading Strategy: "Delta Flow Scalper"
Author: @Trad_journey
Type: Scalping / Intraday
Timeframes:
- Context: 1H
- Entry Points: 15m
---
🎯 Core Idea
We use a powerful tool — the Delta-RSI Oscillator (D-RSI), which calculates the derivative of RSI using polynomial regression. This oscillator doesn't just show the strength of price movement but reveals how that strength changes over time.
By combining this with order flow analysis on the 1H timeframe, we can spot reversals and momentum bursts within a prevailing trend, where the D-RSI is most accurate.
---
🔍 Strategy Logic
1. Context (1H)
Before entering a trade on the 15m chart, we determine:
- The trend on 1H using candle structure, levels, EMAs, volume, VSA, and other methods.
- Example: If 1H shows a series of higher highs/lows and rising volume — it indicates an uptrend.
2. Entry Signals (15m)
Entry is based on the D-RSI, configured with manually optimized settings:
- RSI Length: 14
- Polynomial Order: 2
- Window Length: 14
- Signal EMA: 7
- RMSE Filtering: Enabled, e.g., with a 10% threshold
Entry Conditions (any of the following):
- Zero-Crossing: Oscillator crosses above zero (long) or below zero (short)
- Signal Line Cross: D-RSI crosses the signal EMA
- Direction Change: Oscillator was below zero and starts rising (long), or vice versa
3. Trade Filter
To improve accuracy:
- Polynomial Approximation Error Filter (RMSE) is used — this eliminates noisy signals.
- Ideally, confirm entries with a candlestick pattern or key level as well.
---
📈 Example of Entry Logic
1. On 1H: Clear uptrend, candles with long lower wicks, volume increasing
2. On 15m: D-RSI was below zero, sharply started rising and crossed the signal line from below
3. RMSE < 10% → signal confirmed
4. Enter long, place stop below local low + spread
5. Exit:
- On opposite D-RSI signal
- Or at a take profit (e.g., 1.5R or a key level)
---
⚙️ Settings
()
---
📊 Why It Works
- D-RSI captures momentum shifts and trend acceleration — these often occur before price changes.
- RMSE filtering removes false signals during chop or weak movement.
- Using a higher timeframe gives directional context — entries are made in the trend's direction, drastically increasing win probability.
---
🔔 Recommendations
- Don’t use without higher timeframe context — countertrend signals can be unprofitable.
- Best entries are after small pullbacks within a trend.
- You can add an ATR/volatility filter — to avoid signals in tight ranges.
---
✅ Conclusion
Delta Flow Scalper is a plug-and-play strategy for traders looking for precise intraday entries within larger moves. It's great for those wanting to reduce noise and trade smartly with momentum.
Try it on demo, tweak it to fit your style — and go for it!

Daily Levels & Stats Pro - [Aspect] v4.0# Description of the "Daily Levels & Stats Pro - v4.0" Indicator
This indicator is a powerful tool for market analysis through the lens of key daily levels and statistical price movement indicators. It allows you to display important trading session opening levels, daily statistical movements, and high volatility zones on the price chart.
## Main Indicator Functions:
### Key Time Levels:
- **Daily Open (DO)** - daily trading session opening level at 02:00
- **NY Midnight (NYM)** - New York session opening level at 06:00
- **Trade Open (TO)** - active trading opening level at 10:00
### Analysis Zones:
- **Previous Close Zone (PCZ)** - previous day's closing zone (displayed on M5 timeframe)
- **Open Day Zone (ODZ)** - current day's opening zone (displayed on M5 timeframe)
### Statistical Price Movement Levels:
- **Min** - minimum statistical movement from DO
- **Max** - maximum statistical movement from DO
- **Aver** - average statistical movement from DO
- **Dev-** - lower deviation of movement from DO
- **Dev+** - upper deviation of movement from DO
### TO Impulse Movement Statistical Levels:
- **Aver TO** - average statistical movement from TO
- **Dev+ TO** - upper deviation of movement from TO
- **Max TO** - maximum statistical movement from TO
## Indicator Features:
- Complete customization of colors, styles, and line widths for all levels
- Ability to select time for each main level
- Adjustment of the number of bars for level display
- Automatic calculation of level values relative to DO and TO
- Visual display of TO-levels starts 3 bars before the actual TO point, providing better visual perception
- Ability to enable/disable individual levels and zones
- Automatic updates and resets when the day changes
- Adaptive text labels to mark levels
This indicator is excellent for traders who use statistical data and daily support/resistance levels in their trading strategy. It is particularly useful for DAX40 and other highly liquid instruments where daily trading statistics are important for making trading decisions.

[itradesize] ICT Opening range
This indicator automatically annotates the opening ranges of the AM and PM sessions. It should be used on the 1-minute timeframe , although you can check and build a further models when using a 2-3-4 or even 5-minute timeframe. You can customize this under the settings tab.
Additionally, it includes features such as standard deviations and the initial fair value gap presented. Everything is based on what ICT said in his algorithmic timing video.
The algorithm will continue to adjust prices higher or lower until it reaches a predetermined target price. This process will occur within specific time frames: the last 10 minutes before the hour and the first 10 minutes after a new hour begins.
For the AM session opening range, this is from 9:30 to 10:00 , and for the PM session, it's from 13:30 to 14:00 . Defining these ranges allows us to identify the first presented fair value gaps there, as the algorithm is designed to leave these signatures for smart money. This process of time-based delivery precision repeats every day. You can build a whole New York model on this.
It's important to journal and backtest your results results. If the market breaks the opening range on either side and there is evident liquidity, it is highly likely that it will pursue that liquidity.
However, before doing so, the market should retrace back to the first fair value gap if it hasn’t already occurred or back to the 0.75 or 0.5 level of the range at maximum.
When does this happen? Typically, when a macro event occurs— for example, during the lunch macro from 11:30 to 12:00 . In most cases, you can expect a retracement during lunch macro. If the market retraces beyond these levels, there is a higher probability that the expected scenario will not play out.
The algorithm primarily refers to the 30-minute opening range each time. The standard deviation levels can be used to establish algorithmic delivery targets and anticipate another run after the PM session opening range has occurred. The AM session often helps determine the likely direction of movement after the PM session range concludes.
The PM macro runs from 15:15 to 15:45 . At this time, the market will typically operate within the narrative that is currently underway.
