Concept
Elliott Wave Oscillator + PSAR + VolumeStrategy Logic
1. Indicators
Elliott Wave Oscillator (EWO): This oscillator measures the difference between a 5-period and a 35-period exponential moving average (EMA). It's used to identify momentum shifts and potential wave structures. A buy signal is triggered when the EWO crosses above its signal line (a 5-period simple moving average). A sell signal is triggered when it crosses below.
Parabolic SAR (PSAR): This indicator shows potential reversals in price direction. A buy signal requires the PSAR to be below the current price, indicating an uptrend. A sell signal requires the PSAR to be above the current price, indicating a downtrend.
Volume: The strategy checks for significant changes in volume compared to its 20-period simple moving average (SMA). A buy signal requires a volume increase of at least 20% above the SMA. A sell signal requires a volume decrease of at least 20% below the SMA.
EMA 200: This long-term moving average is used to determine the overall market trend. A buy signal is only considered when the EMA 200 is rising (uptrend). A sell signal is only considered when the EMA 200 is falling (downtrend).
2. Entry and Exit Conditions
Long (Buy) Entry: A long position is entered if all of the following conditions are met:
EWO crosses its signal line upwards.
PSAR is below the price.
Volume has increased significantly.
The EMA 200 is rising.
The current candle is a bullish candle (close > open).
Short (Sell) Entry: A short position is entered if all of the following conditions are met:
EWO crosses its signal line downwards.
PSAR is above the price.
Volume has decreased significantly.
The EMA 200 is falling.
The current candle is a bearish candle (close < open).
Exit Conditions: Both long and short positions have a fixed 1% take profit and a 1% stop loss to manage risk.
In summary, the strategy only enters trades when a combination of momentum (EWO), trend (PSAR, EMA 200), and volume indicators align in the same direction, with strict risk management in place.

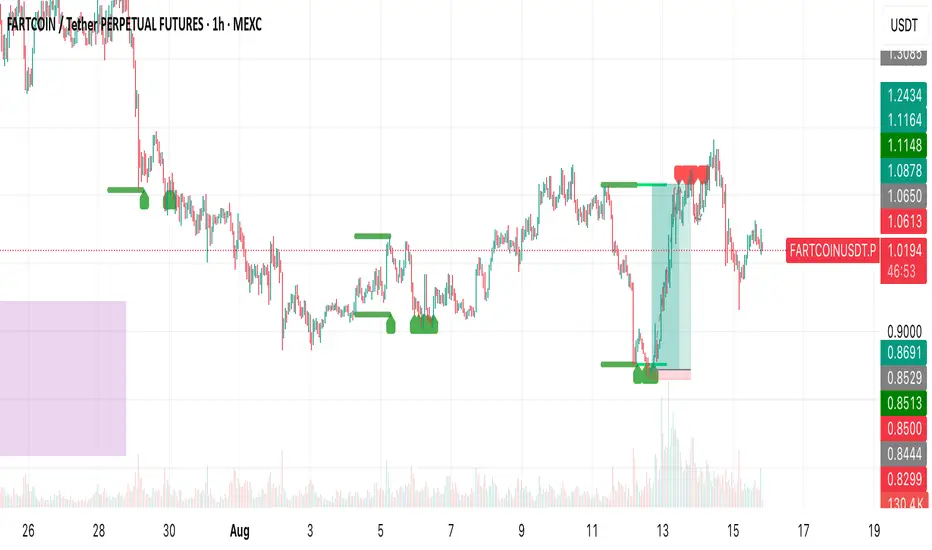
Wickless Tap Signals Wickless Tap Signals — TradingView Indicator (v6)
A precision signal-only tool that marks BUY/SELL events when price “retests” the base of a very strong impulse candle (no wick on the retest side) in the direction of trend.
What it does (in plain English)
Finds powerful impulse candles:
Bull case: a green candle with no lower wick (its open ≈ low).
Bear case: a red candle with no upper wick (its open ≈ high).
Confirms trend with an EMA filter:
Only looks for bullish bases while price is above the EMA.
Only looks for bearish bases while price is below the EMA.
Waits for the retest (“tap”):
Later, if price revisits the base of that wickless candle
Bullish: taps the candle’s low/open → BUY signal
Bearish: taps the candle’s high/open → SELL signal
Optional level “consumption” so each base can trigger one signal, not many.
The idea: a wickless impulse often marks strong initiative order flow. The first retest of that base frequently acts as a springboard (bull) or ceiling (bear).
Exact rules (formal)
Let tick = syminfo.mintick, tol = tapTicks * tick.
Trend filter
inUp = close > EMA(lenEMA)
inDn = close < EMA(lenEMA)
Wickless impulse candles (confirmed on bar close)
Bullish wickless: close > open and abs(low - open) ≤ tol
Bearish wickless: close < open and abs(high - open) ≤ tol
When such a candle closes with trend alignment:
Store bullTapLevel = low (for bull case) and its bar index.
Store bearTapLevel = high (for bear case) and its bar index.
Signals (must happen on a later bar than the origin)
BUY: low ≤ bullTapLevel + tol and inUp and bar_index > bullBarIdx
SELL: high ≥ bearTapLevel - tol and inDn and bar_index > bearBarIdx
One-shot option
If enabled, once a signal fires, the stored level is cleared so it won’t trigger again.
Inputs (Settings)
Trend EMA Length (lenEMA): Default 200.
Use 50–100 for intraday, 200 for swing/position.
Tap Tolerance (ticks) (tapTicks): Default 1.
Helps account for tiny feed discrepancies. Set 0 for strict equality.
One Signal per Level (oneShot): Default ON.
If OFF, multiple taps can create multiple signals.
Plot Tap Levels (plotLevels): Draws horizontal lines at active bases.
Show Pattern Labels (showLabels): Marks the origin wickless candles.
Plots & Visuals
EMA trend line for context.
Tap Levels:
Green line at bullish base (origin candle’s low/open).
Red line at bearish base (origin candle’s high/open).
Signals:
BUY: triangle-up below the bar on the tap.
SELL: triangle-down above the bar on the tap.
Labels (optional):
Marks the original wickless impulse candle that created each level.
Alerts
Two alert conditions are built in:
“BUY Signal” — fires when a bullish tap occurs.
“SELL Signal” — fires when a bearish tap occurs.
How to set:
Add the indicator to your chart.
Click Alerts (⏰) → Condition = this indicator.
Choose BUY Signal or SELL Signal.
Set your alert frequency and delivery method.
Recommended usage
Timeframes: Works on any; start with 5–15m intraday, or 1H–1D for swing.
Markets: Equities, futures, FX, crypto. For thin/illiquid assets, consider a slightly larger Tap Tolerance.
Confluence ideas (optional, but helpful):
Higher-timeframe trend agreeing with your chart timeframe.
Volume surge on the origin wickless candle.
S/R, order blocks, or SMC structures near the tap level.
Avoid major news moments when slippage is high.
No-repaint behavior
Origin patterns are detected only on bar close (barstate.isconfirmed), so bases are created with confirmed data.
Signals come after the origin bar, on subsequent taps.
There is no lookahead; lines and shapes reflect information known at the time.
(As with all real-time indicators, an intrabar tap can trigger an alert during the live bar; the signal then remains if that condition held at bar close.)
Known limitations & design choices
Single active level per side: The script tracks only the most recent bullish base and most recent bearish base.
Want a queue of multiple simultaneous bases? That’s possible with arrays; ask and we’ll extend it.
Heikin Ashi / non-standard candles: Wick definitions change; for consistent behavior use regular OHLC candles.
Gaps: On large gaps, taps can occur instantly at the open. Consider one-shot ON to avoid rapid repeats.
This is an indicator, not a strategy: It does not place trades or compute PnL. For backtesting, we can convert it into a strategy with SL/TP logic (ATR or structure-based).
Practical tips
Tap Tolerance:
If you miss obvious taps by a hair, increase to 1–2 ticks.
For FX/crypto with tiny ticks, even 0 or 1 is often enough.
EMA length:
Shorten for faster signals; lengthen for cleaner trend selection.
Risk management (manual suggestion):
For BUY signals, consider a stop slightly below the tap level (or ATR-based).
For SELL signals, consider a stop slightly above the tap level.
Scale out or trail using structure or ATR.
Quick checklist
✅ Price above EMA → watch for a green no-lower-wick candle → store its low → BUY on tap.
✅ Price below EMA → watch for a red no-upper-wick candle → store its high → SELL on tap.
✅ Use Tap Tolerance to avoid missing precise touches by one tick.
✅ Consider One Signal per Level to keep trades uncluttered.
FAQ
Q: Why did I not get a signal even though price touched the level?
A: Check Tap Tolerance (maybe too strict), trend alignment at the tap bar, and that the tap happened after the origin candle. Also confirm you’re on regular candles.
Q: Can I see multiple bases at once?
A: This version tracks the latest bull and bear bases. We can extend to arrays to keep N recent bases per side.
Q: Will it repaint?
A: No. Bases form on confirmed closes, and signals only on later bars.
Q: Can I backtest it?
A: This is a study. Ask for the strategy variant and we’ll add entries, exits, SL/TP, and stats.

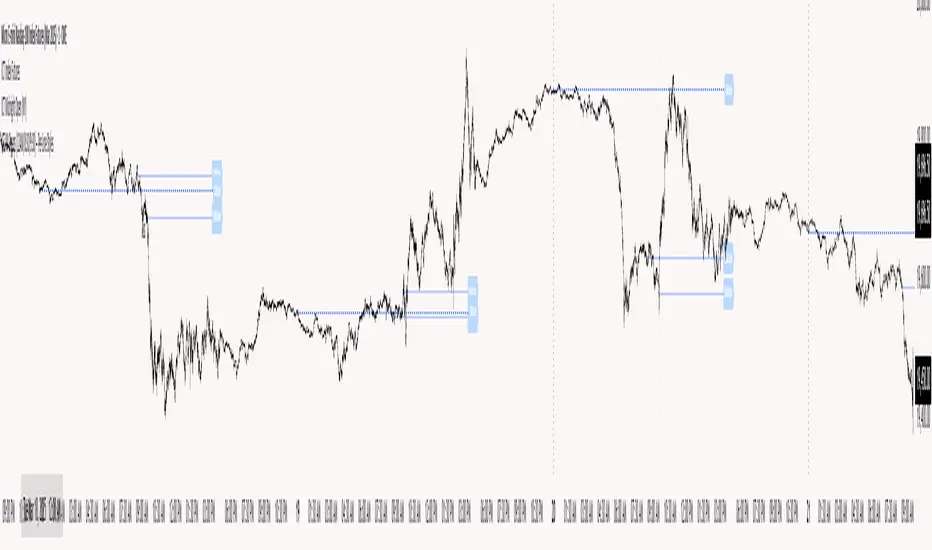
ICT NY Opens (12AM/8:30/9:30)This indicator plots three key New York session reference levels used by ICT traders and intraday scalpers: the Midnight Open (12:00 AM EST), the 8:30 AM EST level (common macro print window), and the 9:30 AM EST RTH open. Each line is drawn at that day’s opening price for the specified time and extends horizontally to 4:15 PM TDC so you always have clean, fixed anchors for the entire trading day.
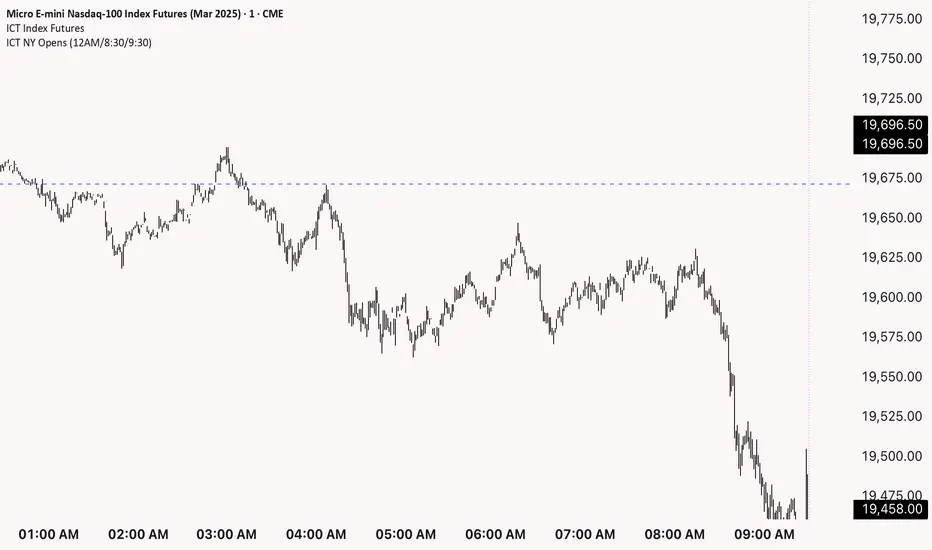
ICT NY Opening Price Lines (12AM/8:30AM/9:30AM) ICT NY Opens (12AM / 8:30AM / 9:30AM)
This indicator plots three key New York session reference levels used by ICT traders and intraday scalpers: the Midnight Open (12:00 AM EST), the 8:30 AM EST level , and the 9:30 AM EST RTH open. Each line is drawn at that day’s opening price for the specified time and extends horizontally to 4:15 PM true daily close so you always have clean, fixed anchors for the entire trading day.
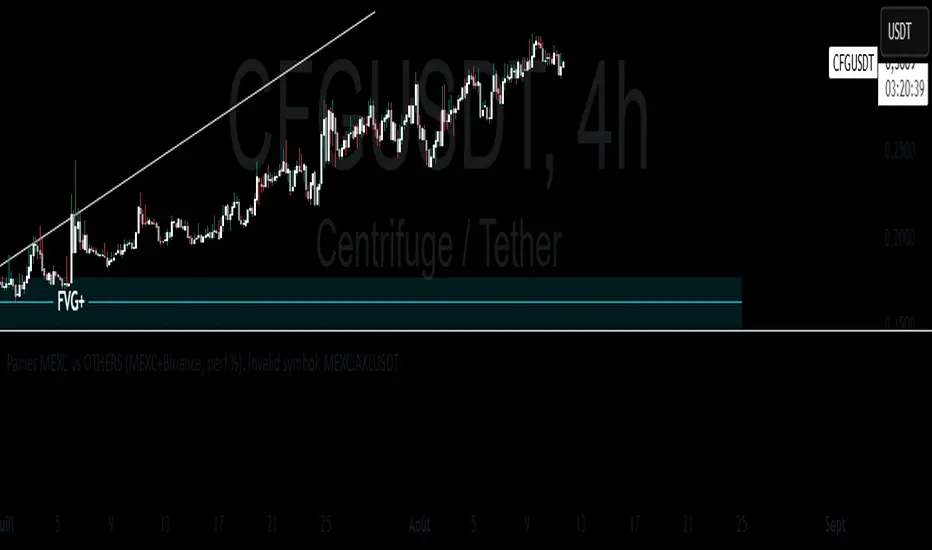
Panier MEXC vs OTHERS (MEXC+Binance, perf %)test de la performance d'un panier pondéré face à OTHERS V1
Fractal Suite: MTF Fractals + BOS/CHOCH + OB + FVG + Targets Kese Way
Fractals (Multi-Timeframe): Automatically detects both current-timeframe and higher-timeframe Bill Williams fractals, with customizable left/right bar settings.
Break of Structure (BOS) & CHoCH: Marks structural breaks and changes of character in real time.
Liquidity Sweeps: Identifies sweep patterns where price takes out a previous swing high/low but closes back within range.
Order Blocks (OB): Highlights the last opposite candle before a BOS, with customizable extension bars.
Fair Value Gaps (FVG): Finds 3-bar inefficiencies with a minimum size filter.
Confluence Zones: Optionally require OB–FVG overlap for high-probability setups.
Entry, Stop, and Targets: Automatically calculates entry price, stop loss, and up to three take-profit targets based on risk-reward ratios.
Visual Dashboard: Mini on-chart table summarizing structure, last swing points, and settings.
Alerts: Set alerts for new fractals, BOS events, and confluence-based trade setups.

Chiefs sessions 4.1This indicator marks out the most recent asian session and London sessions highs and lows. It also marks off the previous days candles highs and lows in white. Asian session is blue and London is red. This indicator resets every day.
Chiefs sessions 4This is just an indicator marking the most recent asian session and london session highs and lows, and also marks off previous days high and lows in white. Blue is asian session and red is london. This indicator resets every day.

Quantum Range Filter by MRKcoin### Quantum Range Filter by MRKcoin
**Overview**
This indicator is a sophisticated range detection tool designed based on the principles of quantitative multi-factor models. Instead of relying on a single condition, it assesses the market from three different dimensions to provide a more robust and reliable identification of range-bound (sideways) markets.
When the background is highlighted in red, it indicates that the market is likely in a range phase, suggesting that trend-following strategies may be less effective, and mean-reversion (range trading) strategies could be more suitable.
---
**Core Logic: A Multi-Factor Approach**
The filter evaluates the market state using the following three independent factors:
1. **Momentum Volatility (RSI Bollinger Bandwidth):**
* **Question:** Is the momentum of the market contracting?
* **Method:** It measures the width of the Bollinger Bands applied to the RSI. A narrow bandwidth suggests that momentum is consolidating, which is a common characteristic of a range market.
2. **Price Volatility (ATR Ratio):**
* **Question:** Is the actual price movement shrinking?
* **Method:** It calculates the Average True Range (ATR) as a percentage of the closing price. A low ratio indicates that the price volatility itself is low, reinforcing the case for a range environment.
3. **Absence of Trend (ADX):**
* **Question:** Is there a lack of a clear directional trend?
* **Method:** It uses the Average Directional Index (ADX), a standard tool for measuring trend strength. A low ADX value provides active confirmation that the market is not in a trending phase.
---
**How to Use**
1. **Range Detection:** The primary use is to identify ranging markets. The red highlighted background serves as a visual cue.
2. **Strategy Selection:**
* **Inside the Red Zone:** Consider using range-trading strategies (e.g., buying at support, selling at resistance, using oscillators like RSI or Stochastics for overbought/oversold signals). Avoid using trend-following indicators like moving average crossovers, as they are prone to generating false signals in these conditions.
* **Outside the Red Zone:** The market is likely trending. Trend-following strategies are more appropriate.
3. **Parameter Tuning (In Settings):**
* **This is the key to adapting the filter to any market or timeframe.** Different assets (like BTC vs. ETH) and different timeframes have unique volatility characteristics. Don't hesitate to adjust the parameters to fit the specific chart you are analyzing.
* **Range Detection Score:** This is the most important setting. It determines how many of the three factors must agree to classify the market as a range. The default is `2`, which provides a good balance.
* If the filter seems **too sensitive** (highlighting too often), increase the score to `3`.
* If the filter seems **not sensitive enough** (missing obvious ranges), decrease the score to `1`.
* **Factor Thresholds:** For fine-tuning, adjust the thresholds for each factor.
* **`RSI BB Width Threshold`:** If you want to detect even tighter momentum consolidations, *decrease* this value.
* **`ATR Ratio Threshold`:** If you want to be stricter about price volatility, *decrease* this value.
* **`ADX Threshold`:** To be more lenient on what constitutes a "trendless" market, *increase* this value (e.g., to 30). To be stricter, *decrease* it (e.g., to 20).
* **Pro Tip:** Use the Debug Table (uncomment it in the script's code) to see the live values of each factor. This will give you a clear idea of how to set the thresholds for the specific asset you are trading.
**Disclaimer**
This indicator is a tool to assist in market analysis and should not be used as a standalone signal for making financial decisions. Always use it in conjunction with your own trading strategy, risk management, and analysis. Past performance is not indicative of future results.
**Credits**
* **Concept & Vision:** MRKcoin

52SIGNAL RECIPE Whale Smart Money Detector52SIGNAL RECIPE Whale Smart Money Detector
◆ Overview
52SIGNAL RECIPE Whale Smart Money Detector is an innovative indicator that detects the movements of whales (large investors) in the cryptocurrency market in real-time. This powerful tool tracks large-scale trading activities that significantly impact the market, providing valuable signals before important market direction changes occur. It can be applied to any cryptocurrency chart, allowing traders to follow the movements of big money anytime, anywhere.
The unique strength of this indicator lies in its comprehensive analysis of volume surges, price volatility, and trend strength to accurately capture whale market entries and exits. By providing clear visual representation of large fund flow data that is difficult for ordinary traders to detect, you gain the opportunity to move alongside the big players in the market.
─────────────────────────────────────
◆ Key Features
• Whale Activity Detection System: Analyzes volume surges and price impacts to capture large investor movements in real-time
• Precise Volume Analysis: Distinguishes between regular volume and whale volume to track only meaningful market movements
• Market Impact Measurement: Quantifies and analyzes the real impact of whale buying/selling on the market
• Continuity Tracking: Follows market direction continuity after whale activity to confirm signal validity
• Intuitive Visualization: Easily identifies whale activity points through color bar charts and clear labels
• Trend Strength Display: Calculates and displays current market buy/sell strength in real-time in a table
• Whale Signal Filtering: Applies multiple filtering systems to detect only genuine whale activity
• Customizable Sensitivity Settings: Offers flexible parameters to adjust whale detection sensitivity according to market conditions
─────────────────────────────────────
◆ Understanding Signal Types
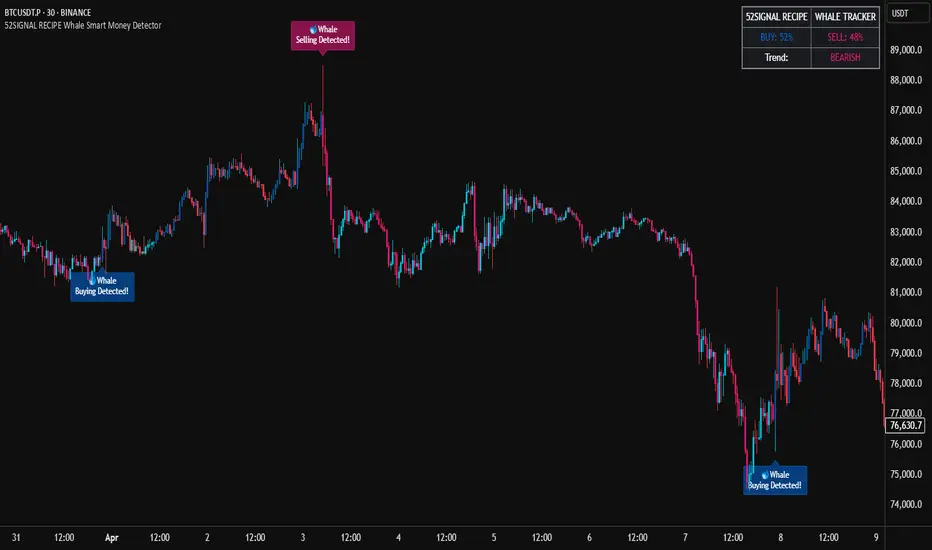
■ Whale Buy Signal
• Definition: Occurs when volume increases significantly above average, immediate volume impact is large, and price rises beyond normal volatility
• Visual Representation: Translucent blue bar coloring with "🐋Whale Buying Detected!" label on the candle where the buy signal occurs
• Market Interpretation: Indicates that large funds are actively buying the coin, which is likely to lead to price increases
■ Whale Sell Signal
• Definition: Occurs when volume increases significantly above average, immediate volume impact is large, and price falls beyond normal volatility
• Visual Representation: Translucent pink bar coloring with "🐋Whale Selling Detected!" label on the candle where the sell signal occurs
• Market Interpretation: Indicates that large funds are actively selling the coin, which is likely to lead to price decreases
─────────────────────────────────────
◆ Understanding Trend Analysis
■ Trend Analysis Method
• Definition: Measures current trend and strength by analyzing the ratio of up/down candles over a set period
• Visual Representation: Displayed in the table as "BUY" and "SELL" percentages, with the current trend clearly marked as "BULLISH", "BEARISH", or "NEUTRAL"
• Calculation Method:
▶ Buy ratio = (Number of up candles) / (Total analysis period)
▶ Sell ratio = (Number of down candles) / (Total analysis period)
▶ Current trend determined by the dominant ratio as "BULLISH" or "BEARISH"
■ Trend Utilization Methods
• Whale Signal Confirmation: Signal reliability increases when whale signals align with the current trend
• Reversal Point Identification: Opposing whale signals during strong trends may indicate important reversal points
• Market Strength Assessment: Understand the balance of power in the current market through buy/sell ratios
• Signal Context Understanding: Consider trend information alongside whale signals for interpretation in a broader market context
─────────────────────────────────────
◆ Indicator Settings Guide
■ Key Setting Parameters
• Volume Impact Factor:
▶ Purpose: Sets the minimum multiplier for immediate volume impact to be considered whale activity
▶ Lower values: Generate more signals, detect smaller whales
▶ Higher values: Fewer signals, detect only very large whales
▶ Recommended range: 2.0-4.0 (adjust according to market conditions)
• Sensitivity Factor:
▶ Purpose: Adjusts sensitivity of price movement relative to normal volatility
▶ Lower values: Increased sensitivity, more signals generated
▶ Higher values: Decreased sensitivity, only stronger price impacts detected
▶ Recommended range: 0.2-0.5 (set higher in highly volatile markets)
• Trend Analysis Period:
▶ Purpose: Sets the number of candles to calculate buy/sell ratios
▶ Lower values: More responsive to recent trends
▶ Higher values: More stable analysis considering longer-term trends
▶ Recommended range: 30-70 (adjust according to trading style)
─────────────────────────────────────
◆ Synergy with Other Indicators
• Key Support/Resistance Levels:
▶ Whale signals occurring near important technical levels have higher reliability
▶ Coincidence of weekly/monthly pivot points and whale signals confirms important price points
• Moving Averages:
▶ Pay attention to whale signals near key moving averages (50MA, 200MA)
▶ Simultaneous occurrence of moving average breakouts and whale signals indicates important technical events
• Volume Profile:
▶ Whale activity near high volume nodes confirms important price levels
▶ Whale signals at low volume nodes may indicate possibility of rapid price movements
• Volatility Indicators:
▶ Whale signals after periods of low volatility may mark the beginning of new market movements
▶ Whale signals after Bollinger Band contraction may be precursors to large movements
• Market Structure:
▶ Whale signals near key market structures (higher highs/lows, lower highs/lows) suggest structural changes
▶ Coincidence of market structure changes and whale activity may signal important trend changes
─────────────────────────────────────
◆ Conclusion
52SIGNAL RECIPE Whale Smart Money Detector tracks the trading activities of large investors in the cryptocurrency market in real-time, providing traders with valuable insights. Because it can be applied to any cryptocurrency chart, you can utilize it immediately on your preferred trading platform.
The core value of this indicator is providing intuitive visualization of large fund flows that are easily missed by ordinary traders. By comprehensively analyzing volume surges, immediate price impacts, and trend continuity to accurately capture whale activity, you gain the opportunity to move alongside the big players in the market.
Clear buy/sell signals and real-time trend strength measurements help traders quickly grasp market conditions and understand market direction. By integrating this powerful tool into your trading system, gain insights into where the market's smart money is flowing for better market understanding.
─────────────────────────────────────
※ Disclaimer: Like all trading tools, the 52SIGNAL RECIPE Whale Smart Money Detector should be used as a supplementary indicator and not relied upon exclusively for trading decisions. Past patterns of whale behavior may not guarantee future market movements. Always employ appropriate risk management strategies in your trading.
52SIGNAL RECIPE Whale Smart Money Detector
◆ 개요
52SIGNAL RECIPE Whale Smart Money Detector는 암호화폐 시장에서 고래(대형 투자자)의 움직임을 실시간으로 감지하는 혁신적인 지표입니다. 이 강력한 도구는 시장에 큰 영향을 미치는 대규모 트레이딩 활동을 추적하여 중요한 시장 방향 전환이 일어나기 전에 귀중한 신호를 제공합니다. 모든 암호화폐 차트에 적용 가능하여 트레이더들이 언제 어디서든 대형 자금의 움직임을 따라갈 수 있게 해줍니다.
이 지표의 독보적인 강점은 거래량 급증, 가격 변동성, 그리고 추세 강도를 종합적으로 분석하여 고래의 시장 진입과 퇴출을 정확히 포착한다는 점입니다. 일반 트레이더들이 놓치기 쉬운 대형 자금의 흐름 데이터를 시각적으로 명확하게 제공함으로써, 여러분은 시장의 큰 손들과 함께 움직일 수 있는 기회를 얻게 됩니다.
─────────────────────────────────────
◆ 주요 특징
• 고래 활동 감지 시스템: 거래량 급증과 가격 임팩트를 분석하여 대형 투자자의 움직임을 실시간으로 포착
• 정밀한 거래량 분석: 일반 거래량과 고래 거래량을 구분하여 의미 있는 시장 움직임만 추적
• 시장 영향력 측정: 고래의 매수/매도가 시장에 미치는 실질적 영향력을 수치화하여 분석
• 연속성 추적: 고래 활동 이후 시장 방향의 지속성을 추적하여 신호의 유효성 확인
• 직관적 시각화: 컬러 바 차트와 명확한 라벨을 통해 고래 활동 지점을 쉽게 식별
• 추세 강도 표시: 현재 시장의 매수/매도 강도를 실시간으로 계산하여 테이블에 표시
• 고래 신호 필터링: 진정한 고래 활동만 감지하도록 다중 필터링 시스템 적용
• 맞춤형 감도 설정: 시장 상황에 따라 고래 감지 감도를 조절할 수 있는 유연한 파라미터 제공
─────────────────────────────────────
◆ 신호 유형 이해하기
■ 고래 매수 신호
• 정의: 거래량이 평균보다 크게 증가하고, 즉각적인 거래량 충격이 크며, 가격이 정상 변동성을 초과하여 상승할 때 발생
• 시각적 표현: 매수 신호가 발생한 캔들에 반투명 파란색 바 컬러링과 함께 "🐋Whale Buying Detected!" 라벨 표시
• 시장 해석: 대형 자금이 적극적으로 코인을 매수하고 있으며, 이는 곧 가격 상승으로 이어질 가능성이 높음을 의미
■ 고래 매도 신호
• 정의: 거래량이 평균보다 크게 증가하고, 즉각적인 거래량 충격이 크며, 가격이 정상 변동성을 초과하여 하락할 때 발생
• 시각적 표현: 매도 신호가 발생한 캔들에 반투명 분홍색 바 컬러링과 함께 "🐋Whale Selling Detected!" 라벨 표시
• 시장 해석: 대형 자금이 적극적으로 코인을 매도하고 있으며, 이는 곧 가격 하락으로 이어질 가능성이 높음을 의미
─────────────────────────────────────
◆ 추세 분석 이해하기
■ 추세 분석 방식
• 정의: 설정된 기간 동안의 상승/하락 캔들 비율을 분석하여 시장의 현재 추세와 강도를 측정
• 시각적 표현: 테이블에 "BUY"와 "SELL" 비율이 백분율로 표시되며, 현재 추세가 "BULLISH", "BEARISH" 또는 "NEUTRAL"로 명확하게 표시됨
• 계산 방식:
▶ 매수 비율 = (상승 캔들 수) / (전체 분석 기간)
▶ 매도 비율 = (하락 캔들 수) / (전체 분석 기간)
▶ 우세한 비율에 따라 "BULLISH" 또는 "BEARISH" 추세 결정
■ 추세 활용 방법
• 고래 신호 확인: 고래 신호가 현재 추세와 일치할 때 신호의 신뢰도가 높아짐
• 반전 포인트 식별: 강한 추세 속에서 발생하는 반대 방향의 고래 신호는 중요한 반전 포인트일 수 있음
• 시장 강도 평가: 매수/매도 비율을 통해 현재 시장의 세력 균형 파악
• 신호 발생 맥락 이해: 추세 정보와 고래 신호를 함께 고려하여 더 넓은 시장 컨텍스트에서 해석
─────────────────────────────────────
◆ 지표 설정 가이드
■ 주요 설정 매개변수
• Volume Impact Factor (거래량 임팩트 요소):
▶ 목적: 고래 활동으로 간주할 즉각적인 거래량 충격의 최소 배수 설정
▶ 낮은 값: 더 많은 신호 생성, 작은 고래도 감지
▶ 높은 값: 더 적은 신호, 매우 큰 고래만 감지
▶ 권장 범위: 2.0-4.0 (시장 상황에 따라 조정)
• Sensitivity Factor (민감도 요소):
▶ 목적: 정상 변동성 대비 가격 변동의 민감도 조절
▶ 낮은 값: 민감도 증가, 더 많은 신호 생성
▶ 높은 값: 민감도 감소, 더 강한 가격 충격만 감지
▶ 권장 범위: 0.2-0.5 (변동성이 높은 시장에서는 높게 설정)
• Trend Analysis Period (추세 분석 기간):
▶ 목적: 매수/매도 비율을 계산할 캔들 수 설정
▶ 낮은 값: 최근 추세에 더 민감하게 반응
▶ 높은 값: 더 긴 기간의 추세를 고려하여 안정적인 분석
▶ 권장 범위: 30-70 (트레이딩 스타일에 따라 조정)
─────────────────────────────────────
◆ 다른 지표와의 시너지
• 주요 지지/저항 레벨:
▶ 중요한 기술적 레벨 근처에서 발생하는 고래 신호는 더 높은 신뢰도를 가짐
▶ 주간/월간 피봇 포인트와 고래 신호의 일치는 중요한 가격 지점을 확인해줌
• 이동평균선:
▶ 주요 이동평균선(50MA, 200MA) 근처에서 발생하는 고래 신호에 주목
▶ 이동평균선 돌파와 고래 신호가 동시 발생 시 중요한 기술적 이벤트 확인
• 볼륨 프로필:
▶ 높은 볼륨 노드 근처에서의 고래 활동은 중요한 가격 레벨 확인
▶ 낮은 볼륨 노드에서 발생하는 고래 신호는 급격한 가격 이동 가능성 암시
• 변동성 지표:
▶ 낮은 변동성 구간 이후 발생하는 고래 신호는 새로운 시장 움직임의 시작일 수 있음
▶ 볼린저 밴드 수축 후 발생하는 고래 신호는 큰 움직임의 전조일 수 있음
• 시장 구조:
▶ 주요 시장 구조(높은 고점/저점, 낮은 고점/저점) 근처에서 발생하는 고래 신호는 구조 변화 암시
▶ 시장 구조 변화와 고래 활동의 일치는 중요한 트렌드 변화 신호일 수 있음
─────────────────────────────────────
◆ 결론
52SIGNAL RECIPE Whale Smart Money Detector는 암호화폐 시장에서 대형 투자자들의 거래 활동을 실시간으로 추적하여 트레이더들에게 귀중한 통찰력을 제공합니다. 모든 암호화폐 차트에 적용 가능하기 때문에, 여러분이 선호하는 트레이딩 플랫폼에서 바로 활용할 수 있습니다.
이 지표의 핵심 가치는 일반 트레이더들이 놓치기 쉬운 대형 자금의 흐름을 직관적으로 시각화하여 제공한다는 점입니다. 거래량 급증, 즉각적인 가격 충격, 그리고 추세 지속성을 종합적으로 분석하여 고래의 활동을 정확히 포착함으로써, 여러분은 시장을 움직이는 큰 손들과 함께할 수 있는 기회를 얻게 됩니다.
명확한 매수/매도 신호와 실시간 추세 강도 측정은 트레이더들이 시장 상황을 한눈에 파악하고 시장의 방향성을 이해하는 데 도움을 줍니다. 이 강력한 도구를 여러분의 트레이딩 시스템에 통합함으로써, 시장의 스마트 머니가 어디로 흘러가는지 파악하고 더 나은 통찰력을 얻으세요.
─────────────────────────────────────
※ 면책 조항: 모든 트레이딩 도구와 마찬가지로, 52SIGNAL RECIPE Whale Smart Money Detector는 보조 지표로 사용해야 하며 트레이딩 결정을 전적으로 의존해서는 안 됩니다. 과거의 고래 행동 패턴이 미래 시장 움직임을 보장하지는 않습니다. 항상 적절한 리스크 관리 전략을 트레이딩에 활용하세요.
Smart Money Scalper v1 [Structure | VIDYA | Oscillator | Delta]🧠 What’s Included in the Core Module:
Component Description-
🔹 Trend Structure + Bias- Detect BoS/ChoCH from Lux-style logic to define bullish/bearish intent.
🟩 Key Level Mapping Structure- based support/resistance and smart money reaction zones.
🔺 VIDYA Slope Filter- Detects smart money accumulation via adaptive volume/trend shifts.
🔸 Two Pole Oscillator- Fast trend strength + direction change confirmation.
🧃 Delta Volume Pressure- Measures real buy/sell aggression (accumulation vs distribution).
🚫 No Trade Zone Logic- Triggers in low volatility, mixed signals, or structure uncertainty.
📊 Bias Labels & Arrows- Display directional bias, trade zones, and visual entries only when clear.
📈 What You’ll See on Chart-
- Key structure swing highs/lows.
- Bull/Bear bias labels (top left).
- Buy/Sell arrows only when all smart money confirmations align.
- Gray zones showing no-trade periods (chop, conflict, low delta).

VP + Game Theory Integrated Strategy9s için DüşünceVP + Game Theory Integrated Strategy Indicator: Explanation and Working Logic
Hello! You can upload the provided Pine Script code to TradingView. This is compatible with Pine Script Editor (v6 version) – simply copy-paste it directly. The indicator's name is "VP + Game Theory Integrated Strategy," and since overlay=true, it will display on top of the price chart (over the candlesticks). Maximum boxes, lines, and labels are set to 500, so it handles dense charts without performance issues.
Below, I'll provide a detailed explanation of the indicator, its working logic, main components, and usage tips step by step. This indicator integrates Volume Profile (VP), Game Theory, and Wick (Candle Wick) Patterns to generate buy/sell signals. It aims to detect high-probability reversal points by analyzing market liquidity, herd behavior, and institutional movements. It's suitable for crypto, forex, or stock markets, but always backtest before using in live trading.
1. General Description
Purpose: This indicator combines volume-based analysis (Volume Profile), game theory elements (herd behavior, Nash equilibrium, contrarian strategies), and candle wick patterns. It identifies strong resistance/support levels (POC, VAH/VAL, liquidity zones) and generates "Power" signals based on them. Signals are shown with labels, lines, and alerts for buy (green) or sell (red).
Key Features:
Volume Profile (VP): Calculates high-volume areas (POC: Point of Control, the highest volume level; VAH/VAL: Value Area High/Low) and displays them on the chart.
Game Theory (GT): Models the market as "players" (retail herd, institutions). Detects herd buying/selling panics and generates contrarian signals.
Wick-Based Signals: Captures reversals with large wicks. Applies strict criteria for "Power" and "Ultra Power" levels.
Market Maker (MM) Elements: Monitors liquidity traps and institutional volume spikes.
Visualization: Nash bands, liquidity boxes, info table (top-right), background colors, and alerts.
Signal Types: Normal, Power, Ultra Power, GT-confirmed. Signals are limited (max 1-5 per zone) with a minimum wait time (40 bars).
Input Parameters: Grouped into 3 sections (GT, Wick, VP, MM). Default values are balanced, but customizable (e.g., strictMode=true makes it more selective).
Warning: This is an indicator, not a full strategy. It includes alerts, but add stop-loss/take-profit for risk management. Use TradingView's Strategy Tester for backtesting.
2. Working Logic (Step by Step)
The indicator processes each bar (candle) as follows:
a. Basic Calculations
ATR (Average True Range): Measures volatility (20 periods). Candle size (high-low) must be at least ATR x 2.5 for signals to be valid.
Candle Components: Calculates candle body (close-open), upper/lower wick.
Volume Analysis: Average volume (SMA 20), detects spikes (based on threshold).
Trend Filter: EMAs (20/50/200) determine up/downtrend. In strict mode, it's stricter (strong uptrend: EMA20 > EMA50 > EMA200 and close > EMA20).
b. Game Theory (GT) Component
Herd Behavior: RSI (14) overbought/oversold (70/30) + volume spike + momentum detects it. Herd buying: Overbuying frenzy (red background). Herd selling: Selling panic (green background).
Institutional Flow: Volume > average x 2.5 + Accumulation/Distribution (AD) indicator. Accumulation: Institutions buying (strengthens buy signals). Distribution: Selling (strengthens sell).
Liquidity Traps: In the last 50 bars, if a new high/low is broken but close pulls back + volume spike = Trap (up/down).
Smart Money: Intra-candle movement (close-open)/(high-low) x volume. Positive = Smart money inflow.
Nash Equilibrium: Price mean (SMA 100) ± deviation (stdev x 0.02). In equilibrium: Normal. Above: Sell potential. Below: Buy. Bands are optionally shown.
GT Signals:
Contrarian: Herd selling + accumulation = Buy.
Momentum: Below Nash + positive smart money = Buy (opposite for sell).
Nash Reversion: Below Nash + rising close + volume = Buy.
Power Signal: At least 3 GT signals (min_signals_for_power=3) + volume confirmation = Power GT buy/sell. Can show only GT-confirmed signals (show_gt_only_signals=true).
c. Volume Profile (VP) Component
Calculation: For the last 100 bars (vpPeriod), divides the price range (high-low) into vpRows (24) rows. Distributes volume across rows.
POC (Point of Control): Highest volume level (orange line). Threshold 80% (pocThreshold).
Value Area (VA): 70% of total volume (valueAreaPercent). VAH (upper bound, blue dotted), VAL (lower bound).
High-Volume Area: Price near POC or volume > POC x 80% = Strong zone.
Visualization: Histogram boxes on the right (blue/orange). POC/VAH/VAL lines and labels.
d. Wick (Candle Wick) and Power Signals
Main Wick Criteria: Large candle (ATR x 2.5), small body (<8%), wick 8x body length (anaFitilCarpan) and 80% of candle (anaFitilYuzde). High volume + trend filter (downtrend for upper wick).
Signal Wick: More flexible for triggers (5x length, 70%).
Power/Ultra Power:
Power Sell: Main upper wick + near POC/VAH + MM volume (2.5x) + GT contrarian/momentum.
Power Buy: Similar for lower wick.
Super Wick: Power + institutional volume + strong momentum.
Ultra Power: Super + GT power (3/3) + distribution/accumulation + Nash deviation + liquidity trap. Rarest and strongest (fuchsia/lime color).
Signal Management: Detected wick level (high/low) is saved. Wait min 40 bars, max 1-5 signals per zone. When trigger candle arrives (price reaches level + long wick + close in opposite direction) = BUY/SELL plotshape.
e. Market Maker (MM) and Liquidity
MM Volume: Average x 2.5 + wick bonus (1.3x).
Liquidity Zones: Saves last 20 high-volume highs/lows. Shown as boxes on chart (red/green, lasting 200 bars).
Traps: Integrated with GT, strengthens power signals.
f. Visualization and Alerts
Background: Ultra Power (fuchsia/lime), Power GT (red/green), Herd (red/green).
Lines: Active resistance/support (dashed, colored).
Table (Top-Right): Resistance/support levels, remaining signals, POC/VAH/VAL, GT status (herd, institutional, Nash, signal strength), volume/liquidity.
Alerts: For Ultra Power, GT Power, Super Wick, normal signals. Messages include level/price.
g. Filters and Options
Strict Mode: Stricter (higher volume 1.5x, strong trend, RSI filter).
Require Volume Confirmation: Mandatory volume check.
Only Show Power Signals: Display only power/ultra.
Require Ultra Power: Strictest, only ultra.
3. Usage Tips
Chart Timeframe: H1-D1 for medium-long term. Shorter frames (M1-M5) may produce too many signals.
Settings:
StrictMode=true: Fewer but higher-quality signals.
Use_game_theory=false: Use only VP + Wicks.
ShowVP=false: Hide histogram to reduce clutter.
Strategy Integration: Filter BUY/SELL with EMAs. Stop-loss: ATR x 1-2, Take-profit: POC/VAH levels.
Backtesting: Convert to strategy in TradingView (use alertconditions). Test on historical data.
Risk: Designed for market manipulation (MM traps), but no indicator is 100% accurate. Apply capital management.
Troubleshooting: If errors (e.g., vpInitialized=false), increase period or refresh chart.
This indicator is complex but powerful – blending VP for volume zones with GT for psychology. If you have questions or need setting changes, let me know!

Composite Sentiment Extremes OscillatorComposite Sentiment Extremes Oscillator (CSEO)
Created by MonkeyPhone
The Composite Sentiment Extremes Oscillator (CSEO) is a sophisticated market sentiment indicator designed to identify optimal entry and exit points by leveraging a composite of six key market data points. I developed this indicator to pinpoint moments where the risk-to-reward ratio for entering or exiting trades reaches its peak, helping traders capitalize on potential reversals. The oscillator aggregates data from the CBOE Volatility Index (VIX), CBOE Equity Put/Call Ratio (PCCE), NYSE TRIN, Net New 52-Week Highs/Lows, ICE BofA US High Yield Bond Spread (BAMLH0A0HYM2), and the percentage of S&P 500 stocks above their 200-day moving average (S5TH). Each component is normalized using a 252-bar percentrank to reflect greed (high values) or fear (low values), creating a unified 0-100 sentiment score.
The oscillator's line color reflects market conditions: red when above 60 (indicating a trending up market), gray between 40 and 60 (suggesting chop or consolidation), and green below 40 (indicating a trending down market). Notably, the higher or lower the line moves toward the extremes (88 for greed, 12 for fear), the more likely a pullback or retracement becomes, offering strategic opportunities for reversals. Given the long-term upward trend in legacy markets over decades, long signals (buy at extreme fear) tend to carry more weight than short signals (sell at extreme greed), though this dynamic may shift if markets experience a significant rollover.
This indicator performs best on the weekly timeframe, where its accuracy in identifying sentiment extremes shines, making it ideal for swing or position trading. It supports any timeframe daily or above, but lower timeframes (e.g., daily) may produce increased false signals due to data resolution limitations. Alerts can be configured for both long and short entries, allowing traders to receive notifications when the oscillator crosses the 12 (buy) or 88 (sell) thresholds—accessible via the TradingView alert interface for customized monitoring.
Use this tool to enhance your market timing, but always combine it with other analysis for confirmation. Feedback and suggestions are welcome as I continue to refine this indicator!

52SIGNAL RECIPE Hidden Volume52SIGNAL RECIPE Hidden Volume
◆ Overview
52SIGNAL RECIPE Hidden Volume is an innovative indicator that visualizes the hidden buying and selling strength behind the conventional volume candles. By analyzing the relative proportion of buying and selling within each candle’s price range, it splits the total volume into buy volume and sell volume. Displayed as color-coded bars (blue for buying, pink for selling) in a separate panel below the chart, it provides clear insight into the market’s buying and selling pressure.
Unlike standard volume indicators that only show total volume, this indicator reveals the underlying balance and shifts in buying and selling power, offering traders a deeper understanding of market dynamics.
Furthermore, when viewed alongside the traditional volume candles that everyone commonly uses, it helps traders interpret price movements and volume flows more comprehensively, enabling a more insightful analysis of overall market trends.
─────────────────────────────────────
◆ Key Features
- Buy/Sell Volume Ratio Analysis: Calculates the relative buy and sell ratios based on the candle’s price movement range
- Hidden Buying and Selling Strength Visualization: Separately displays buy volume (blue) and sell volume (pink) as stacked bars in a dedicated bottom panel
- Real-time Data Reflection: Captures immediate changes in market buying and selling pressure based on live volume data
- Clear Visual Distinction: Uses background shading to easily highlight periods of buying dominance (blue) or selling dominance (pink)
- Quantified Buy/Sell Balance: Displays the current buying vs selling ratio numerically on chart labels for quick reference
- Recommended Use with Traditional Volume Candles: Designed to be used together with commonly used volume candles for more comprehensive market flow interpretation
─────────────────────────────────────
◆ Trading Application Points
- Provides deeper insight into market sentiment compared to conventional volume bars
- Helps identify shifts in buying and selling power indicative of trend continuations or reversals
- Useful as a complementary tool alongside price action to better time entries and exits
─────────────────────────────────────
◆ Synergy With Other Indicators
- Combine with trend indicators (RSI, MACD, Moving Averages) to validate trend strength and momentum
- Use together with volume and order flow tools to enhance understanding of market participant behavior
─────────────────────────────────────
◆ Conclusion
52SIGNAL RECIPE Hidden Volume is a powerful and intuitive tool that unveils the balance of buying and selling forces concealed within the total volume. By visualizing buy and sell volumes separately and updating in real-time, it allows traders to grasp the subtle shifts in market pressure and make more informed trading decisions.
Especially when used together with the traditional volume candles commonly referenced by most traders, it enhances traders’ ability to interpret price movement combined with volume flow in a more multi-dimensional and precise way, ultimately supporting more effective trading strategies.
─────────────────────────────────────
※ Disclaimer: This indicator is provided as a supplementary analysis tool and should not be used as the sole basis for trading decisions. Past data does not guarantee future results. Always apply proper risk management.
52SIGNAL RECIPE Hidden Volume
◆ 개요
52SIGNAL RECIPE Hidden Volume은 일반적인 볼륨 캔들 뒤에 숨겨진 매수와 매도의 힘의 크기를 가시화하는 지표입니다. 각 캔들의 가격 움직임 범위 내에서 매수와 매도의 상대적인 비율을 계산해, 총 거래량을 매수 볼륨과 매도 볼륨으로 나누어 보여줍니다. 별도의 차트 하단 패널에 파란색 매수 볼륨과 분홍색 매도 볼륨을 컬러 막대 그래프로 시각적으로 구분하여 시장 내 거래 심리와 매수·매도 압력을 명확하게 파악할 수 있도록 지원합니다.
일반 거래량 지표가 단순한 거래량 수치만 제공하는 반면, 이 지표는 매수세와 매도세의 숨겨진 균형과 변화를 직관적으로 보여줘, 시장 내부의 매매 강도와 방향성을 깊이 있게 이해하는 데 유용합니다.
또한, 일반적으로 모두가 사용하는 볼륨 캔들과 함께 병행해 보면, 가격 변동과 거래량의 흐름을 더 입체적으로 분석할 수 있어서 시장 전체의 흐름을 해석하는 데 훨씬 용이합니다.
─────────────────────────────────────
◆ 주요 특징
- 매수·매도 거래 비율 분석: 캔들의 가격 변동 범위를 기준으로 매수와 매도 비율 산출
- 숨겨진 매수·매도 힘 시각화: 별도 차트 하단 패널에서 매수 볼륨(파란색)과 매도 볼륨(분홍색)으로 구분하여 가시화
- 실시간 반영: 실시간으로 변하는 거래량 데이터에 기반해 시장 내부 매수·매도 압력 변화 즉시 포착
- 심플한 시각적 구분: 색상과 배경으로 매수 우세 또는 매도 우세 구간을 직관적으로 표시
- 매수·매도 힘의 균형 이해 지원: 차트 상단 텍스트 라벨로 현재 매수/매도 비율을 숫자로 제공
- 볼륨 캔들과 병행 사용 권장: 모두가 사용하는 기본 볼륨 캔들과 함께 보면서 시장 흐름 해석에 활용 가능
─────────────────────────────────────
◆ 트레이딩 활용 포인트
- 기존 거래량 지표 대비 더 깊은 시장 심리 분석 가능
- 매수세와 매도세 간 힘의 균형 변화를 주목하여 추세 전환이나 지속 신호로 활용
- 가격 흐름과 결합해 진입 및 청산 타이밍 설정에 도움
─────────────────────────────────────
◆ 다른 지표와 조합 가능성
- 가격 추세 지표(RSI, MACD, 이동평균선 등)와 함께 사용해 추세 강도와 매수·매도 압력 동시 분석
- 거래량 및 주문장 지표와 결합하여 시장 참여자 심리 및 매매 동향 파악 강화
─────────────────────────────────────
◆ 결론
52SIGNAL RECIPE Hidden Volume은 일반 볼륨 캔들만으로는 알기 어려운 매수와 매도 간의 힘의 균형을 명확히 보여주는 강력하고 직관적인 지표입니다. 실시간 거래량 내 매수·매도 비율을 분리해 시각화함으로써, 트레이더들이 시장 내부의 숨겨진 힘의 흐름을 이해하고 이를 바탕으로 한 전략적 의사결정을 내릴 수 있도록 돕습니다.
특히 일반적으로 많이 사용하는 볼륨 캔들과 함께 병행하여 볼 때, 가격 변동과 함께 시장의 거래 심리를 더욱 입체적이고 정확하게 해석할 수 있어 훨씬 효과적인 매매 전략 수립이 가능합니다.
─────────────────────────────────────
※ 면책 조항: 본 지표는 투자 판단을 위한 보조 도구로 제공되며, 단독 의존해서는 안 됩니다. 과거 데이터에 기반한 분석이므로 미래 결과를 보장하지 않으며, 적절한 리스크 관리와 함께 사용하시기 바랍니다.

AshishBediSPLAshishBediSPL: Dynamic Premium Analysis with Integrated Signals
This indicator provides a comprehensive view of combined options premiums by aggregating data from Call and Put contracts for a selected index and expiry. It integrates multiple popular technical indicators like EMA Crossover, Supertrend, VWAP, RSI, and SMA, allowing users to select their preferred tools for generating dynamic buy and sell signals directly on the premium chart.
AshishBediSPL" is a powerful TradingView indicator designed to analyze options premiums. It calculates a real-time combined premium for a chosen index (NIFTY, BANKNIFTY, FINNIFTY, etc.) and specific expiry date. You have the flexibility to visualize the premium of Call options, Put options, or a combined premium of both.
The indicator then overlays several popular technical analysis tools, which you can selectively enable:
EMA Crossover: Identify trend changes with configurable fast and slow Exponential Moving Averages.
Supertrend: Detect trend direction and potential reversal points.
VWAP (Volume Weighted Average Price): Understand the average price of the premium considering trading volume.
RSI (Relative Strength Index): Gauge momentum and identify overbought/oversold conditions.
SMA (Simple Moving Average): Analyze price smoothing and trend identification.
Based on your selected indicators, the tool generates clear "Buy" and "Sell" signals directly on the chart, helping you identify potential entry and exit points. Customizable alerts are also available to keep you informed.
Unlock a new perspective on options trading with "AshishBediSPL." This indicator focuses on the combined value of options premiums, giving you a consolidated view of market sentiment for a chosen index and expiry.
Instead of just looking at individual option prices, "AshishBediSPL" blends the Call and Put premiums (or focuses on one, based on your preference) and empowers you with a suite of built-in technical indicators: EMA, Supertrend, VWAP, RSI, and SMA. Pick the indicators that resonate with your strategy, and let the tool generate actionable buy and sell signals right on your chart. With customizable alerts, you'll never miss a crucial market move. Gain deeper insights and make more informed trading decisions with "AshishBediSPL.
Combined options premium: This accurately describes what your indicator calculates.
Selected index and expiry: Essential inputs for the indicator.
Call/Put options or combined: Explains the flexibility in data display.
Multiple technical indicators (EMA Crossover, Supertrend, VWAP, RSI, SMA): Lists the analysis tools included.
Buy/Sell signals: The primary output of the indicator.
Customizable alerts: A valuable feature for users.

Leola Lens Standard📌 Leola Lens Standard — Structural Reaction Map (Invite-Only)
Leola Lens Standard is a closed-source overlay designed to map structural levels, reaction zones, and liquidity shifts — across all major market types and timeframes.
This version focuses on clean, adaptive visuals that help traders identify reaction-prone areas without relying on conventional indicators.
________________________________________
🔍 What It Displays
• Dynamic zones that shift based on evolving price behavior
• Support and resistance clusters around consolidation or expansion phases
• Upper and lower range boundaries to track accumulation/distribution conditions
• Transition zones where false breakouts or traps are likely to occur
________________________________________
🧠 Technical Approach & Originality
This tool uses custom-coded structural logic, not derived from Pine Script libraries or public indicator templates.
• No use of RSI, MACD, MAs, Bollinger Bands, or volume-based profiles
• Reactions are mapped based on confirmed price behavior, not forecasts
• All zones are generated visually — no manual inputs required
• Compatible with trend, range, or chop market conditions
Its focus on structure-based clarity helps traders cut through noise, particularly in high-volatility environments.
________________________________________
🧩 Best Use Cases
• Intraday traders seeking traps and fakeouts at key levels
• Swing traders mapping range-to-trend transitions or retests
• Market-neutral setups where visual structure is more actionable than signal indicators
• Works across crypto, equities, forex, and commodities
________________________________________
⚠️ Disclaimer
This script is provided for educational and analytical purposes only. It is not financial advice and should not be used to make trading decisions without proper risk assessment.
________________________________________


AK-GOLD - Regime Detection V6AK-GOLD - Regime Detection V6
AK-GOLD - Regime Detection V6
AK-GOLD - Regime Detection V6
AK-GOLD - Regime Detection V6
AK-GOLD - Regime Detection V6
Advanced ICT Theory - A-ICT📊 Advanced ICT Theory (A-ICT): The Institutional Manipulation Detector
Are you tired of being the liquidity? Stop chasing shadows and start tracking the architects of price movement.
This is not another lagging indicator. This is a complete framework for viewing the market through the lens of institutional traders. Advanced ICT Theory (A-ICT) is an all-in-one, military-grade analysis engine designed to decode the complex language of "Smart Money." It automates the core tenets of Inner Circle Trader (ICT) methodology, moving beyond simple patterns to build a dynamic, real-time narrative of market manipulation, liquidity engineering, and institutional order flow.
AIT provides a living blueprint of the market, identifying high-probability zones, tracking structural shifts, and scoring the quality of setups with a sophisticated, multi-factor algorithm. This is your X-ray into the market's true intentions.
🔬 THE CORE ENGINE: DECODING THE THEORY & FORMULAS
A-ICT is built upon a sophisticated, multi-layered logic system that interprets price action as a story of cause and effect. It does not guess; it confirms. Here is the foundational theory that drives the engine:
1. Market Structure: The Blueprint of Trend
The script first establishes a deep understanding of the market's skeleton through multi-level pivot analysis. It uses ta.pivothigh and ta.pivotlow to identify significant swing points.
Internal Structure (iBOS): Minor swings that show the short-term order flow. A break of internal structure is the first whisper of a potential shift.
External Structure (eBOS): Major swing points that define the primary trend. A confirmed break of external structure is a powerful statement of trend continuation. AIT validates this with optional Volume Confirmation (volume > volumeSMA * 1.2) and Candle Confirmation to ensure the break is driven by institutional force, not just a random spike.
Change of Character (CHoCH): This is the earthquake. A CHoCH occurs when a confirmed eBOS happens against the prevailing trend (e.g., a bearish eBOS in a clear uptrend). A-ICT flags this immediately, as it is the strongest signal that the primary trend is under threat of reversal.
2. Liquidity Engineering: The Fuel of the Market
Institutions don't buy into strength; they buy into weakness. They need liquidity. A-ICT maps these liquidity pools with forensic precision:
Buyside & Sellside Liquidity (BSL/SSL): Using ta.highest and ta.lowest, AIT identifies recent highs and lows where clusters of stop-loss orders (liquidity) are resting. These are institutional targets.
Liquidity Sweeps: This is the "manipulation" part of the detector. AIT has a specific formula to detect a sweep: high > bsl and close < bsl . This signifies that institutions pushed price just high enough to trigger buy-stops before aggressively selling—a classic "stop hunt." This event dramatically increases the quality score of subsequent patterns.
3. The Element Lifecycle: From Potential to Power
This is the revolutionary heart of A-ICT. Zones are not static; they have a lifecycle. AIT tracks this with its dynamic classification engine.
Phase 1: PENDING (Yellow): The script identifies a potential zone of interest based on a specific candle formation (a "displacement"). It is marked as "Pending" because its true nature is unknown. It is a question.
Phase 2: CLASSIFICATION: After the zone is created, AIT watches what happens next. The zone's identity is defined by its actions:
ORDER BLOCK (Blue): The highest-grade element. A zone is classified as an Order Block if it directly causes a Break of Structure (BOS) . This is the footprint of institutions entering the market with enough force to validate the new trend direction.
TRAP ZONE (Orange): A zone is classified as a Trap Zone if it is directly involved in a Liquidity Sweep . This indicates the zone was used to engineer liquidity, setting a "trap" for retail traders before a reversal.
REVERSAL / S&R ZONE (Green): If a zone is not powerful enough to cause a BOS or a major sweep, but still serves as a pivot point, it's classified as a general support/resistance or reversal zone.
4. Market Inefficiencies: Gaps in the Matrix
Fair Value Gaps (FVG): AIT detects FVGs—a 3-bar pattern indicating an imbalance—with a strict formula: low > high (for a bullish FVG) and gapSize > atr14 * 0.5. This ensures only significant, volatile gaps are shown. An FVG co-located with an Order Block is a high-confluence setup.
5. Premium & Discount: The Law of Value
Institutions buy at wholesale (Discount) and sell at retail (Premium). AIT uses a pdLookback to define the current dealing range and divides it into three zones: Premium (sell zone), Discount (buy zone), and Equilibrium. An element's quality score is massively boosted if it aligns with this principle (e.g., a bullish Order Block in a Discount zone).
⚙️ THE CONTROL PANEL: A COMPLETE GUIDE TO THE INPUTS MENU
Every setting is a lever, allowing you to tune the AIT engine to your exact specifications. Master these to unlock the script's full potential.
🎯 A-ICT Detection Engine
Min Displacement Candles: Controls the sensitivity of element detection. How it works: It defines the number of subsequent candles that must be "inside" a large parent candle. Best practice: Use 2-3 for a balanced view on most timeframes. A higher number (4-5) will find only major, more significant zones, ideal for swing trading. A lower number (1) is highly sensitive, suitable for scalping.
Mitigation Method: Defines when a zone is considered "used up" or mitigated. How it works: Cross triggers as soon as price touches the zone's boundary. Close requires a candle to fully close beyond it. Best practice: Cross is more responsive for fast-moving markets. Close is more conservative and helps filter out fake-outs caused by wicks, making it safer for confirmations.
Min Element Size (ATR): A crucial noise filter. How it works: It requires a detected zone to be at least this multiple of the Average True Range (ATR). Best practice: Keep this around 0.5. If you see too many tiny, irrelevant zones, increase this value to 0.8 or 1.0. If you feel the script is missing smaller but valid zones, decrease it to 0.3.
Age Threshold & Pending Timeout: These manage visual clutter. How they work: Age Threshold removes old, mitigated elements after a set number of bars. Pending Timeout removes a "Pending" element if it isn't classified within a certain window. Best practice: The default settings are optimized. If your chart feels cluttered, reduce the Age Threshold. If pending zones disappear too quickly, increase the Pending Timeout.
Min Quality Threshold: Your primary visual filter. How it works: It hides all elements (boxes, lines, labels) that do not meet this minimum quality score (0-100). Best practice: Start with the default 30. To see only A- or B-grade setups, increase this to 60 or 70 for an exceptionally clean, high-probability view.
🏗️ Market Structure
Lookbacks (Internal, External, Major): These define the sensitivity of the trend analysis. How they work: They set the number of bars to the left and right for pivot detection. Best practice: Use smaller values for Internal (e.g., 3) to see minor structure and larger values for External (e.g., 10-15) to map the main trend. For a macro, long-term view, increase the Major Swing Lookback.
Require Volume/Candle Confirmation: Toggles for quality control on BOS/CHoCH signals. Best practice: It is highly recommended to keep these enabled. Disabling them will result in more structure signals, but many will be false alarms. They are your filter against market noise.
... (Continue this detailed breakdown for every single input group: Display Configuration, Zones Style, Levels Appearance, Colors, Dashboards, MTF, Liquidity, Premium/Discount, Sessions, and IPDA).
📊 THE INTELLIGENCE DASHBOARDS: YOUR COMMAND CENTER
The dashboards synthesize all the complex analysis into a simple, actionable intelligence briefing.
Main Dashboard (Bottom Right)
ICT Metrics & Breakdown: This is your statistical overview. Total Elements shows how much structure the script is tracking. High Quality instantly tells you if there are any A/B grade setups nearby. Unmitigated vs. Mitigated shows the balance of fresh opportunities versus resolved price action. The breakdown by Order Blocks, Trap Zones, etc., gives you a quick read on the market's recent character.
Structure & Market Context: This is your core bias. Order Flow tells you the current script-determined trend. Last BOS shows you the most recent structural event. CHoCH Active is a critical warning. HTF Bias shows if you are aligned with the higher timeframe—the checkmark (✓) for alignment is one of the most important confluence factors.
Smart Money Flow: A volume-based sentiment gauge. Net Flow shows the raw buying vs. selling pressure, while the Bias provides an interpretation (e.g., "STRONG BULLISH FLOW").
Key Guide (Large Dashboard only): A built-in legend so you never have to guess. It defines every pattern, structure type, and special level visually.
📖 Narrative Dashboard (Bottom Left)
This is the "story" of the market, updated in real-time. It's designed to build your trading thesis.
Recent Elements Table: A live list of the most recent, high-quality setups. It displays the Type , its Narrative Role (e.g., "Bullish OB caused BOS"), its raw Quality percentage, and its final Trade Score grade. This is your at-a-glance opportunity scanner.
Market Narrative Section: This is the soul of A-ICT. It combines all data points into a human-readable story:
📍 Current Phase: Tells you if you are in a high-volatility Killzone or a consolidation phase like the Asian Range.
🎯 Bias & Alignment: Your primary direction, with a clear indicator of HTF alignment or conflict.
🔗 Events: A causal sequence of recent events, like "💧 Sell-side liquidity swept →
📊 Bullish BOS → 🎯 Active Order Block".
🎯 Next Expectation: The script's logical conclusion. It provides a specific, forward-looking hypothesis, such as "📉 Pullback expected to bullish OB at 1.2345 before continuation up."
🎨 READING THE BATTLEFIELD: A VISUAL INTERPRETATION GUIDE
Every color and line is a piece of information. Learn to read them together to see the full picture.
The Core Zones (Boxes):
Blue Box (Order Block): Highest probability zone for trend continuation. Look for entries here.
Orange Box (Trap Zone): A manipulation footprint. Expect a potential reversal after price interacts with this zone.
Green Box (Reversal/S&R): A standard pivot area. A good reference point but requires more confluence.
Purple Box (FVG): A market imbalance. Acts as a magnet for price. An FVG inside an Order Block is an A+ confluence.
The Structural Lines:
Green/Red Line (eBOS): Confirms the trend direction. A break above the green line is bullish; a break below the red line is bearish.
Thick Orange Line (CHoCH): WARNING. The previous trend is now in question. The market character has changed.
Blue/Red Lines (BSL/SSL): Liquidity targets. Expect price to gravitate towards these lines. A dotted line with a checkmark (✓) means the liquidity has been "swept" or "purged."
How to Synthesize: The magic is in the confluence. A perfect setup might look like this: Price sweeps below a red SSL line , enters a green Discount Zone during the NY Killzone , and forms a blue Order Block which then causes a green eBOS . This sequence, visible at a glance, is the story of a high-probability long setup.
🔧 THE ARCHITECT'S VISION: THE DEVELOPMENT JOURNEY
A-ICT was forged from the frustration of using lagging indicators in a market that is forward-looking. Traditional tools are reactive; they tell you what happened. The vision for A-ICT was to create a proactive engine that could anticipate institutional behavior by understanding their objectives: liquidity and efficiency. The development process was centered on creating a "lifecycle" for price patterns—the idea that a zone's true meaning is only revealed by its consequence. This led to the post-breakout classification system and the narrative-building engine. It's designed not just to show you patterns, but to tell you their story.
⚠️ RISK DISCLAIMER & BEST PRACTICES
Advanced ICT Theory (A-ICT) is a professional-grade analytical tool and does not provide financial advice or direct buy/sell signals. Its analysis is based on historical price action and probabilities. All forms of trading involve substantial risk. Past performance is not indicative of future results. Always use this tool as part of a comprehensive trading plan that includes your own analysis and a robust risk management strategy. Do not trade based on this indicator alone.
観の目つよく、見の目よわく
"Kan no me tsuyoku, ken no me yowaku"
— Miyamoto Musashi, The Book of Five Rings
English: "Perceive that which cannot be seen with the eye."
— Dskyz, Trade with insight. Trade with anticipation.

Vibration IMP LevelsIts IMP levels to trade on the bases of Vibration date of each stock and it will plot levels on the bases of stocks.
It will work on F&O stocks only.

Marketmap by Logicat📊 Marketmap is truly a "Capital Flow Sensor Indicator" – Uncover the Truth Behind Price Movements
Have you ever been frustrated by sudden market reversals?
Have you been stopped out during fake breakouts or deceptive rallies?
This indicator was born to solve exactly those pain points.
📌 Core Features of the Indicator:
1. Capital Flow Detection
By calculating the interaction between volume and price, this tool identifies the flow of smart money — spotting abnormal volume spikes, accumulation signs, and distribution signals.
2. Automatic Marking of Hidden Order Zones (Smart Money Zones)
It detects footprints of institutional activity and highlights meaningful support/resistance zones, rather than drawing random lines — helping you focus on price levels that truly matter to the market.
3. Volume Analysis of Support/Resistance Zones
Each marked zone includes real-time volume strength analysis, helping to determine whether a zone is likely to hold or break.
4. Interest Zone Detection
The indicator can preemptively identify price zones likely to be revisited, allowing you to distinguish between support retests and continuation setups.
5. Automatic Trendline Drawing
Draws real-time trendlines to help determine directional bias and test points.
6. Live Trend Calculation
Displays a simple real-time strength comparison table between gold and USD.
🧠 More Than Just an Indicator — A Market Structure and Liquidity Engine
It integrates:
Price + Volume Structure
Smart Money Traces
Dynamic Strength of S/R Zones
High Timeframe (HTF) Liquidity Perspective
💡 Recommended For:
Ideal for swing traders, intraday scalpers, and even order flow-focused traders.
Can be paired with trend-following strategies or naked chart trading systems to strengthen entry logic.
🔔 Disclaimer:
This indicator is not a crystal ball. It is a visual tool for highlighting high-probability zones and real transaction footprints.
You remain responsible for risk management and final trading decisions.

Time Range Marker By BCB ElevateThe Time Range Marker is a simple yet powerful visual tool for traders who want to focus on specific time intervals within the trading day. This indicator highlights a custom time range on your chart using a background color, helping you visually isolate key trading sessions or event windows such as:
Market open/close hours
News release periods
High-volatility trading zones
Personal strategy testing windows
⚙️ Key Features:
Customizable start and end time (hour & minute)
Works across all intraday timeframes
Adjustable highlight color to match your chart theme
Built using Pine Script v5 for speed and flexibility
🔧 Settings:
Start Hour / Minute – Set the beginning of the time range (in 24-hour format)
End Hour / Minute – Define when the range ends
Highlight Color – Choose the background color for better visibility
🕒 Timezone Note:
The indicator uses UTC time by default to ensure accuracy across markets. If your broker uses a different timezone (like EST, IST, etc.), the script can be adjusted to reflect your local market hours.
✅ How to Use the Time Range Marker Indicator
This indicator is used to visually highlight a specific time window each trading day, such as:
Market open or close sessions (e.g., NYSE, London, Tokyo)
High-impact news release periods
Custom time slots for strategy testing or scalping
🛠️ Installation Steps
Open TradingView and go to any chart.
Click on Pine Editor at the bottom of the screen.
Copy and paste the full Pine Script (shared above) into the editor.
Click the “Add to Chart” ▶️ button.
The indicator will appear on the chart with a highlighted background during the time range you set.
⚙️ How to Customize the Time Range
After adding the indicator:
Click the gear icon ⚙️ next to the indicator’s name on the chart.
Adjust the following settings:
Start Hour / Start Minute: The beginning of your time range (in 24-hour format).
End Hour / End Minute: When the highlight should stop.
Highlight Color: Pick a color and transparency for visual clarity.
Click OK to apply changes.
🕒 Timezone Consideration
By default, the indicator uses UTC (Coordinated Universal Time).
To match your broker’s timezone (e.g., EST, IST, etc.), you'll need to adjust the script by changing:
sessStart = timestamp("Etc/UTC", ...)
sessEnd = timestamp("Etc/UTC", ...)
to your correct timezone, like "Asia/Kolkata" for IST or "America/New_York" for EST.
Let me know your broker or local timezone, and I’ll update it for you.
📈 Tips for Traders
Combine this with volume, price action, or breakout indicators to focus your strategy on high-probability time windows.
Use multiple versions of this script if you want to highlight more than one time range in a day.
