Custom TF MoneyFlow Crypto -- TradingSargentcompletely adjustable Money flow indicator - adjust to look at other time frames to save time flicking through the charts.
Using as a standard oscilator, when the MFI plot reaches the bottom, giving a buy signal, and visa versa, at the top..
adjustable length, but i find "14" is best, on the 15minute and 2 hour time frames
加密數字貨幣

Tether Market Cap - {Cross-Exchange} Tether Market Cap Indicator
Keep track of tether movements cross exchange & total market cap in real-time.
Never miss a movement in the Tether market.
How it works
Starts by selecting the security "CRYPTOCAP:USDT" with, period, close,
The script will then call on each exchange listed to get the usdt_supply from each exchange.
It will then print the data to the indicator as such:
Yellow = Total Tether Market Cap
Orange = Kraken Supply USDT
Red = Poloniex Supply USDT
Green = Bitfinex Supply USDT

Crypto Margin Trading ConsensusThis is an indicator of the consensus of traders in the crypto market. It examines the number of short and long positions on several currencies (BTC, ETH, XRP, LTC, XMR, EOS and others) on each bar.
Sometimes traders are in consensus and they are right (enter long and the currencies rise, or enter the short and the currencies decrease) other times, although they are in consensus, it can happen that the market behaves exactly the opposite. Some signals are good, some are not (as with any other indicator, unfortunately).
Because it uses data about multiple currencies, it is a market breadth indicator - it does not refer to One currency, but to several important currencies in the crypto market, simultaneously (calculates based on information about several currencies). That's why it loads SLOWLY - it can take up to 60 seconds to appear.
If a multi-currency trader bar goes LONG (meaning they agree that it should be long), it displays a green upward-facing arrow, otherwise, if there is a consensus that it should be short, it displays a downward arrow.
I hope it will be of some use to you

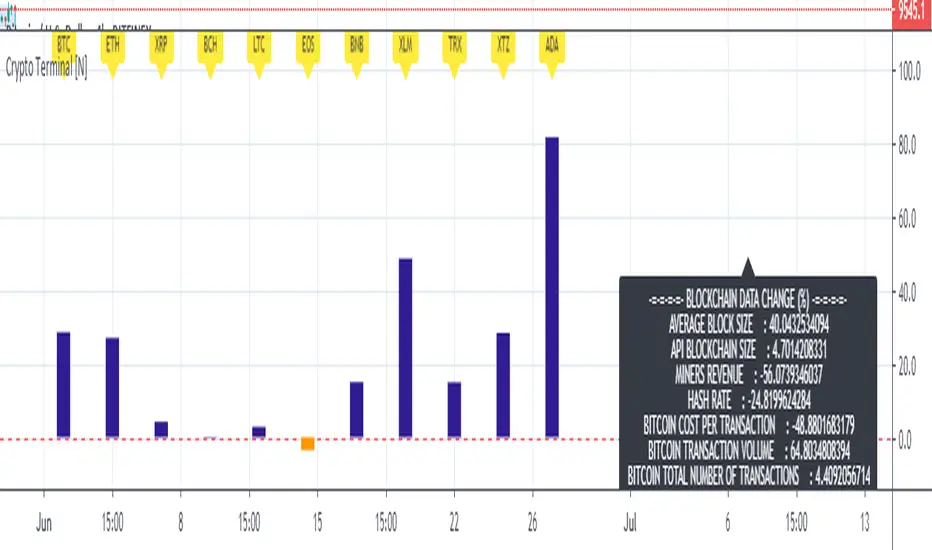
Basic Cryptocurrency TerminalHello,
This script is a simple Cryptocurrency Terminal.
It serves the same purpose as Heatmaps.
You can also set the period to look back manually in the menu.
Major Cryptocurrencies are taken into account.
And various Blockchain data are shown in the information panel.
In this way, an idea can be obtained about Cryptocurrency Market.
It is visually more convenient and clear to use in an indicator window under the chart, not on the chart, as follows:
Regards.
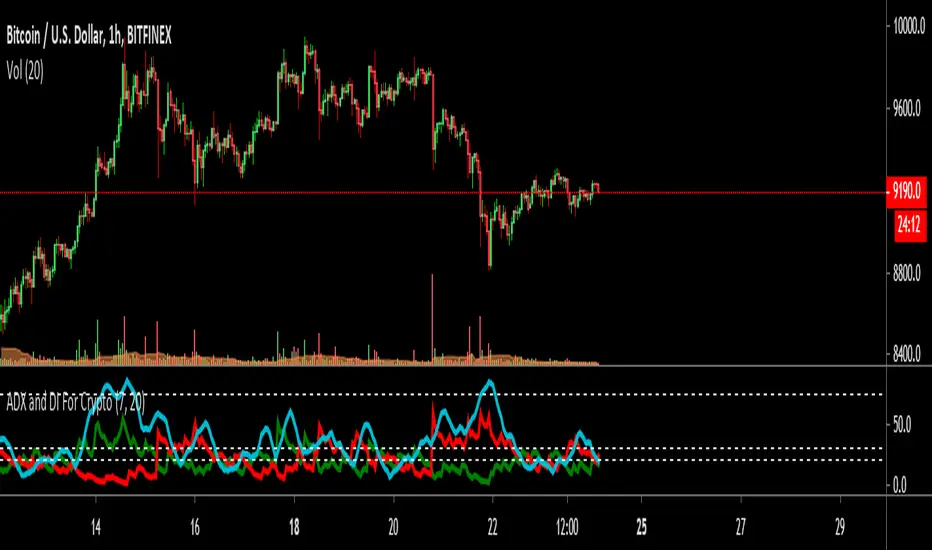
ADX and DI For Cryptocustomized version to add my favourite settings for crypto
Best time frame is daily followed by 4H
ADX Near 20 or less means trend is choppy and weak
ADX Cross over 30 means trend is starting to gain momentum
ADX Near 75 means momentum is near maximum, trend needs to rest for a while ( The area between 70~90 )
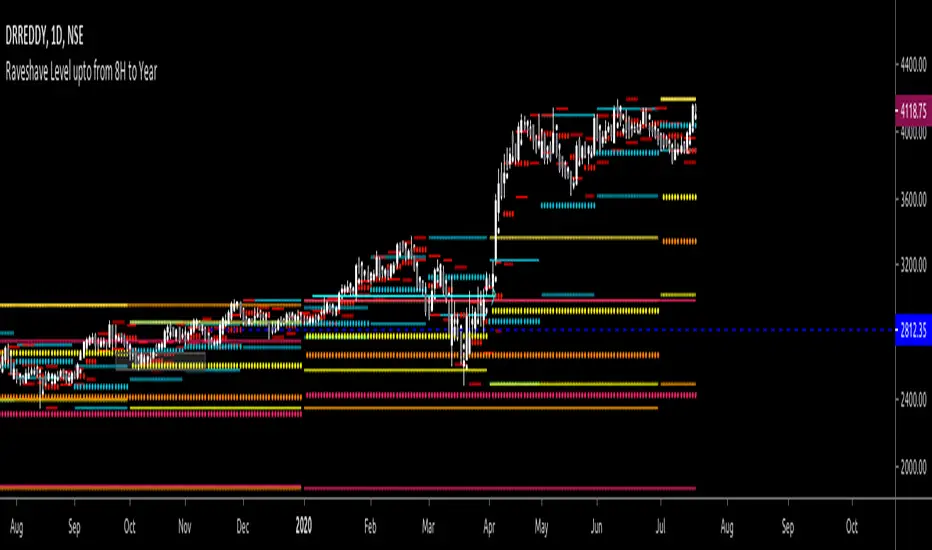
All past LevelsContains all past levels that we need
1. Previous Monthly High
2. Previous Monthly Low
3. Previous Weekly High
4. Previous Weekly Low
5. Previous Daily High
6. Previous Daily Low
7. Previous Monthly Range Average (PMH+PML)/2
8. Previous WeeklyRange Average (PWH+PWL)/2
9. Previous Daily Range Average (PDH+PDL)/2
10. Monthly Open
11. Weekly Open
12. Daily Open
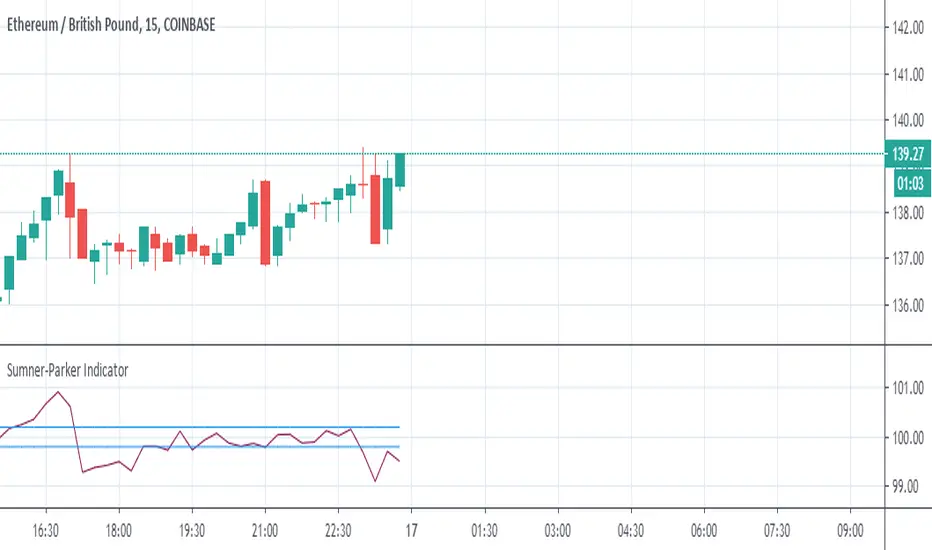
Sumner-Parker Indicator (Over/Under Priced BTC or ETH)This is to be used when trading between ETH/GBP, BTC/GBP and ETH/BTC .
It compares ETH/GBP and BTC/GBP with each other to determine if the ETH/BTC price matches.
From it you can predetermine whether the value of the asset you are watching is overpriced or underpriced and therefore predict the candle to follow.
When watching ETH:
If the value is high, the value of BTC is too high and ETH should raise to match in the next bar and vice versa.
When watching BTC:
If the value is high, the value of BTC is too high and should drop on the next bar and vice versa.
The Upper and Lowers are set at double the percentage fees on the exchange you use. This just helps in recognising beneficial trades.
Price CorrelationsThis indicator shows price correlations of your current chart to various well-known indices.
Values above 0 mean a positive correlation, below 0 a negative correlation (not correlated).
It works well with daily candle charts and above, but you may also try it on 1h candles.
The default indices:
- Gold
- S&p 500
- Mini Dow Jones
- Dow Jones
- Russel 2000
- Nasdaq 100
- Crude Oil
- Nikkei 225 (Japan)
- FTSE 100 (UK)
- Silver
- DAX Futures (DE)
You can change the defaults to compare prices with other indices or stocks.

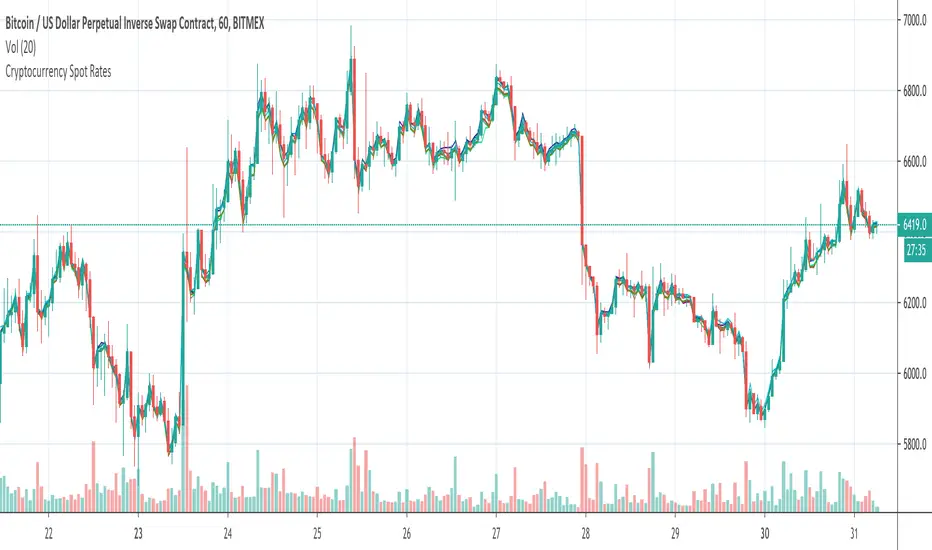
Cryptocurrency Spot RatesThis is an overlay indicator on the chart that will plot cryptocurrency spot prices of the following exchanges:
- Coinbase
- Poloniex
- OKCOIN
- Binance
- Huobi
- Bittrex
- HitBTC
- Kraken
- Bitfinex
Additionally it plots the price average of all those exchanges.
This overlay is intended to be used on charts with derivatives/futures such as BitMEX/Deribit/...
It works with all USD and Tether pairs on the main chart (for example BTCUSD, ETHUSD, BCHUSD,...)
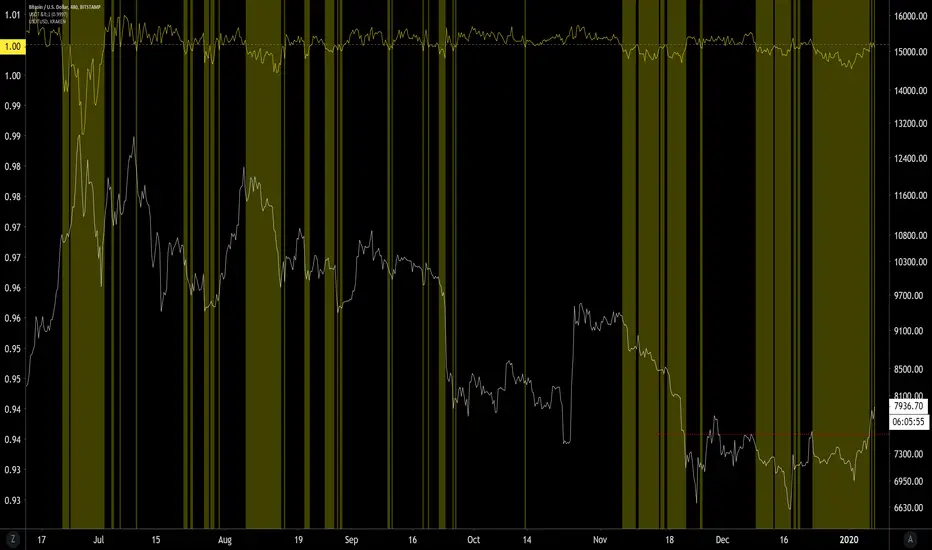
USDT SupplyThis script shows the USDT (Tether) supply, total USDT market capitalization and USDT supply on various Cryptocurrency exchanges.
It is based on this script:
Changes:
- added HiTBTC and Huobi exchange
- updated to Pine Script v4
- improved default style and line width to highlight global USDT plots against exchange-specific plot lines

Price Streak Is Another Way to Spot TrendsPrice is never wrong, but sometimes reading it can be tricky.
Movements in the broader market or a sector can distract from a symbol that's been steadily trending in one direction or another. Sometimes the beginning of a move can also be so subtle that it flies under most people's radar.
Price Streak can help overcome these limitations by tracking consecutive up/down periods. It plots an easy-to-read color-coded histogram.
Because it simply counts the candles in a trend, Price Streak can give a clearer picture than magnitude-biased indicators like relative strength or MACD.
Applying Price Streak to the daily chart of Bitcoin Dominance , we find something very interesting right now: the longest drop since March 2017.
That moment in history, almost three years ago, marked the beginning of the last Altcoin bull market. Ethereum , for example, went from roughly $60 to over $1,300 in the following nine months.
While past performance isn't a guarantee of future results, this illustrates how sustained price moves can reveal changes in character.
Based on Price Streak's current reading, it may support the idea of another Altcoin cycle beginning now.

Trade System Crypto InvestidorTrade System created to facilitate the visualization of crossing and extensions of the movements with Bollinger bands.
Composed by:
Moving Averages of 21, 50, 100 and 200.
Exponential Moving Averages: 17,34,72,144, 200 and 610.
Bollinger bands with standard deviation 2 and 3.
How it works?
The indicators work together, however there are some important cross-averages that need to be identified.
- Crossing the MA21 with 50, 100 and 200 up or down will dictate an up or down trend.
- MA200 and EMA200 are excellent indicators of resistance and support zone, if the price is above these averages it will be a great support, if the price is below these averages it will indicate strong resistance.
- Another important crossover refers to exponential moving averages of 17 to 72 indicates a possible start of a trend
- The crossing of the exponential moving average of 34 with 144 will confirm the crossing mentioned above.
- In addition, the exponential moving average of 610 used by Bo Williams is an excellent reference for dictating an upward or downward trend, if the price is above it it will possibly confirm an upward trend and the downside.
- To conclude we have bollinger bands with standard deviation 2 and 3, they help to identify the maximum movements.

Bitcoin Halving CountdownHello traders,
I offer you today the BTC halving countdown updated in real-time on your charts
I inspired myself greatly from the gentleman @everget's script LTC halving countdown below
(
The countdown date is coming from that source www.bitcoinblockhalf.com.
The halving date is estimated to be around May 13th, 2020 .
That date is hardcoded in the script and is used for the countdown calculation.
The Bitcoin block mining reward halves every 210,000 blocks, the coin reward will decrease from 12.5 to 6.25 coins.
Enjoy the weekend
Dave

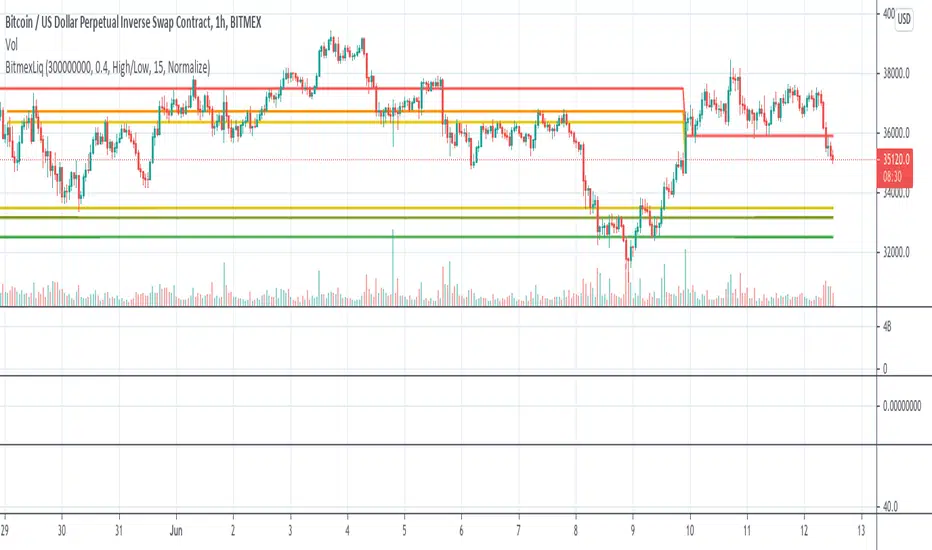
BitMEX Liquidation LevelsThis indicator plots BitMEX liquidation levels:
- 25x
- 50x
- 100x
The indicator works as following:
The underlying assumption (as with all liquidation calculations) obviously is that traders used fixed margin or go "all in" on their cross-margin account.
You then can configure a minimum trade volume and a minimum price change in percent for a candle to start computing liquidation levels from that candle
Additionally: configure the price base for the liqudation level: Candle high or low (default) works well, but you can also set "candle close" or "median high/low"
The indicator will then plot horizontal lines on the main chart showing price levels where many positions opened at the configured "start candle" will likely get liquidated.
It works for all BitMEX contracts and while it has been optimized for BitMEX, it will work on other exchanges with the same leverage levels (25x, 50x, 100x) and maintenance margin requirements too.
This indicator uses the Smart Volume indicator to compute the volume at the "start volume candle" setting where the liquidation level starts. This indicator can be found here: Smart Volume:
Market BuySell RatioA script using 1m small candle size (configurable) to compute the volume of buy (up) vs sell (down) candles (instead of actual market buy vs sell orders which are not available in pine script).
It then plots the buy vs sell ratio as an oscillator below the cart.
This gives traders an idea of current order flow in the market.
To compute the small candles this script uses the "Smart Volume" script which can be found here:

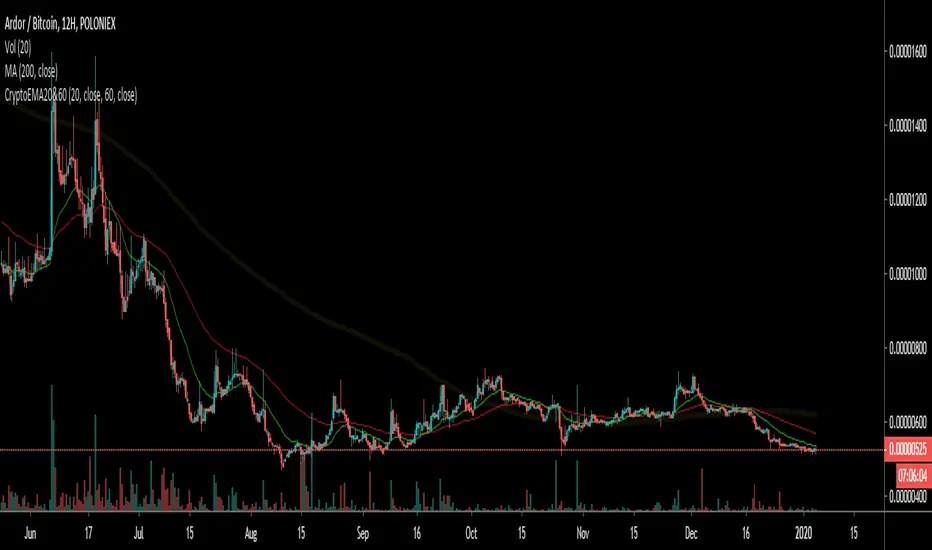
Crypto EMA 60/20Intended for use with Cryptocurrency Markets on the 12 hour time frame, the 60/20 exponential moving average frequency has proven successful for identifying trend bottom formations and for verifying head and shoulders top formations.
Combine the Crypto EMA 60/20 with classical RSI and MACD divergences to help verify impending reversals.
Useful for identifying trend changes in the frequency of four to six month price trends followed by a four to six week reversal, as historically found in cryptocurrency bull and bear markets.
This signal gets noisy if prices trend sideways for more than 30 days - consult daily views.
Trendy Bar Trend ColorTrendy Bar Trend Color
Inspired by trend candlestick charts on other trading platforms. Changes bar colors to stay in trend much like Heikin Ashi candles without the ATR price distortion. This is done by comparing the HL2 and/or Open-Close values of current candlestick to the prior candlestick.

Bitcoin Production Cost OscillatorFor Trav,
Oscillator version of "Bitcoin Production Cost".
Based on raw data from CBECI.
Follow me to read more about the calculation logic.

Bitcoin Production CostBitcoin's Production Cost
Based on raw data from CBECI.
Follow me to read more about the calculation logic.

BEST Mayer MultipleHello traders
I'm not a HODLer by any means. I know when to sell (or I think I know....) when an asset starts going against me too much.
Even if it's a "long-term" investment.
My mentor used to telling me this: "If a short-term trade becomes a long-term investment, then you're in for a hell of a ride".
I have no clue if Bitcoin/BTC will go back up or not - I don't even care because I'm an intraday trader.
What if BTC was actually a way to accumulate more fiat? Satoshi fooled us
I coded this Mayer Multiple according to the specifications below. By the way, I'm a big fan of Willy Woo. I've been monitoring all his work since I learned about crypto (10 minutes ago.... it's a joke come on)
charts.woobull.com
Scaling
To respect the Mayer's multiple model, I recommend to select the Logarithmic scaling as shown below
imgur.com
What Mayer's model says
Using the reference below, the model says we're in the oversold zone. But, we can be in that zone for months/years...
When a model says an asset could bounce in a 1000-7000 USD range... well... I don't know how I would be able to perform optimally with that insight. This is very subjective and not a recommendation.
Mayer's Multiple model reference
All the BEST
Dave

Heiken Ashi Triangles at the Top and Bottom of ScreenHeiken Ashi Triangles at the Top and Bottom of Screen
The image below shows the comparison to actual Heiken Ashi candles
(Though changing from candles to Heiken Ashi tends to smooth the triangles a little)

Directional Movement Index + Average Directional IndexPersonal DMI and ADX script
ADX color change from positive vs negative momentum
DMI Color fill based on DMI+/- positive momentum
No fill color during lack of momentum
