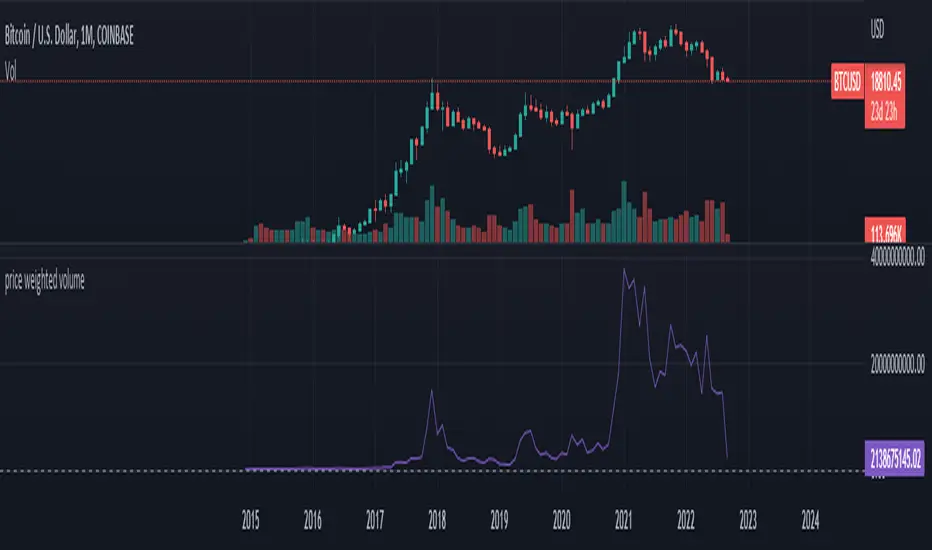
PWV - Price Weighted VolumeThis indicator charts
PWV = volume * close
in order to better visualize exchange volume.
加密數字貨幣
TARVIS Labs - Alts Macro Bottom/Top SignalsSCRIPT DESCRIPTION
PLEASE READ THROUGH THIS CAREFULLY.
This is a script specifically written to help provide indicators from a macro view for ALTS. This script needs to be run on the 1 day. It helps indicate when to accumulate alts, and when its in a bull run when this a bull run top beginning to form with warnings, and a indicator that a top is in. This is described further below.
NOTE - in order to accomodate most alts the script had to be broad enough in its indicators to cover many different scenarios. If you are trading a smaller altcoin I suggest taking a more conservative approach to accumulation.
FAQs:
1. Why is there no accumulation zone showing up before an uptrend?
This could be because the trend has been so strong for this coin that there hasn't been a strong enough signal to accumulate or this could be that the chart doesnt have enough historical data (needs over 2 years) for the indicators to flash green.
2. Why is there no tops shown for a chart Im looking at?
This is either because there isn't enough historical data (needs over 2 years) for the indicators to build or because the altcoin didnt perform as well as the rest of the market. The altcoin has to perform as well as the market over the length of the bull run in order for the signals to show. Typically an altcoin that shows sharp increases and sharp drops shortly after will not have signals show up.
3. The "Potential End of Bull Run Top Indicator" showed up but we weren't near the top yet, why is that?
The alts indicator has to work across many altcoins, and their trends are not all the same. This can lead to the indicator showing but not necessarily being the exact top. The data from the alts macro bottom/top signals should be paired with the "TARVIS Labs bitcoin macro bottom/top signals" indicator for BTC. The reasoning is because if the top is not showing that its in for Bitcoin its likely that the altcoin's top is also not in. You should use the two in tandem to know if the bull run top is very likely in.
ACCUMULATION ZONE INDICATOR - LIGHT GREEN
Description
When we look at the general crypto landscape, the 200d & 300d EMAs are extremely useful. We can use their cross and momentum in order to determine a bottom forming. If the price has fallen over 40% below the 200 day EMA and the 200 day EMA has crossed below the 300d EMA, its a downtrend with a steep fall, which could indicate a good time to accumulate. When we see the 200 day EMA's slope drop drastically (over 5% w/w) it is also a good signal to accumulate.
Strategy for Usage
For alts, the strategy can vary drastically. You need to take into account:
1. the market cap of the altcoin, is it a smaller market cap altcoin or a larger one?
2. historical trend, does it typically trend strongly with a smaller accumulation zone?
Once you've taken these into account you can form a strategy. For example, if the altcoin has had smaller accumulation zones historically you'll want to take advantage of the accumulation zones when they pop up and be more aggressive (say a 30 day accumulation). If the altcoin has historically had longer accumulation zones then you'll want to be more conservative with your strategy and potentially have a 100 day (or even longer) accumulation period. If the altcoin is a smaller market cap alt, you will want to also take that into account. You'll want to likely be more conservative,
STRONG BUY IN ACCUMULATION ZONE INDICATOR - DARK GREEN
Description
We can add to the bottoming signal by looking for strong downtrends inside the bottoming signal. We do this by seeing when the 36 day EMA has a slope decreasing by 2% day/day.
Strategy for Usage
These strong downtrend days can be used to add more to our accumulation strategy. We can add more on these days (ex. double what you were planning to on a typical accumulation day).
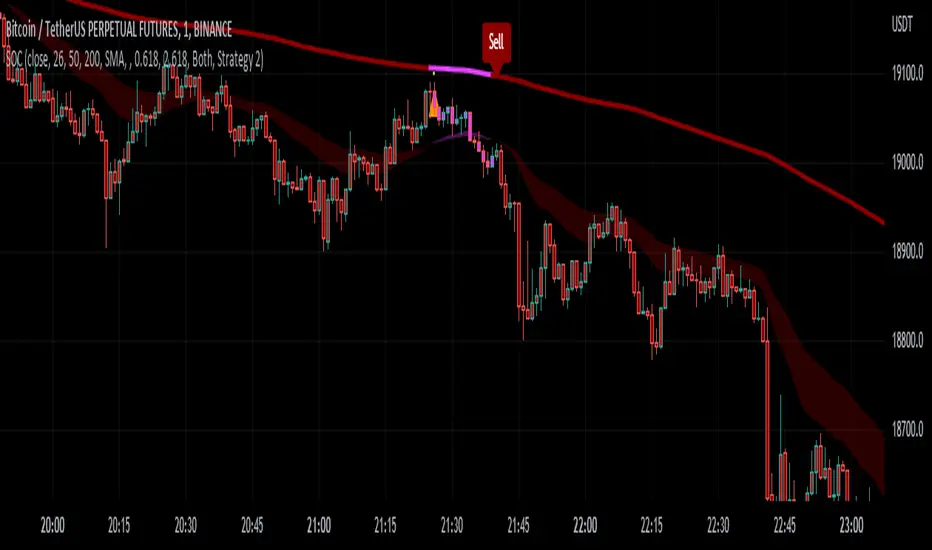
LOCAL TOP NEAR BULL RUN TOP INDICATOR - RED
Description
When the 100 week EMA is in a strong uptrend (4% increase w/w) we can look for significant loss of momentum in order to determine if a local top is in near a bull run top. This strategy uses a MACD with 9/36/9 config for the daily chart. We look for the signals momentum loss, when the slope becomes negative.
Strategy for Usage
Ideally the right strategy to use here is to exit the market when this indicator starts. When the indicator ends if the "Potential End of Bull Run Top Indicator" is not showing on the chart you can buy back into the market.
POTENTIAL END OF BULL RUN TOP INDICATOR - DARK RED
Description
When the 100 week EMA is in a strong uptrend (3% increase w/w), and a MACD config of 108/234/9 has a negative signal slope signifying a very large momentum loss, but the 1d 18 EMA is still above the 1d 63 EMA we show this signal.
Strategy for Usage
This is a strong indicator that the top is in, and it potentially being the bull run top. Because alts can vary strongly in their charts, this should be a strong warning but not necessarily a certainty that the bull run is over.

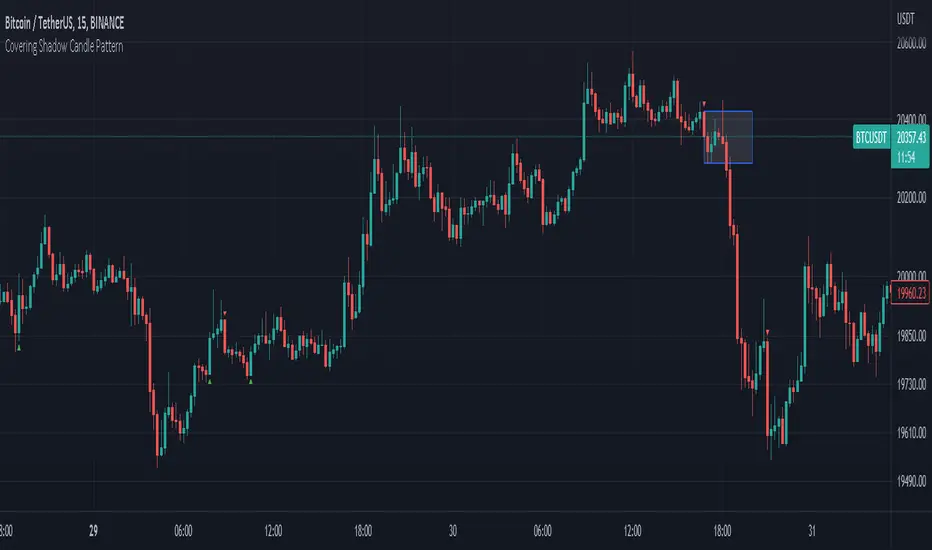
Covering Shadow Candle PatternThis indicator shows 3 types of objects on chart:
1. downward red triangle above a candle: 3 green candles followed by a fourth red candle of which the low price is lower than the low of the 3 previous green candles, this is usually the sign of reversal from upward movement to a downward one.
2. 1. upward green triangle below a candle: 3 red candles followed by a fourth green candle of which the high price is higher than the high of the 3 previous red candles, this is usually the sign of reversal from downward movement to a upward one.
3. boxes: these boxes are drawn when the patterns of cases 1 and 2 fails to perform as expected which means we have some important areas at that level so it can be a resistance or support zone .
TARVIS Labs - Bitcoin Macro Bottom/Top SignalsSCRIPT DESCRIPTION
This is a script specifically written to help provide indicators from a macro view. This script is best run on the 1 day interval on Bitstamp's $BTCUSD chart. It helps indicate when to accumulate bitcoin, and when its in a bull run when there are local tops, strong top warnings, and a signal to exit a bull run. This is described further below.
If you don't have interest in trading on the way to the top I suggest turning off the following indicators in the settings of the indicator:
- Opportunity To Buy Back In Indicator
- Local Top Near Bull Run Top Indicator
ACCUMULATION ZONE INDICATOR - LIGHT GREEN
Description
When we look at the history of Bitcoin every bottom has crossed below the 100 week EMA. Once it does its accompanied by hash ribbon cross with miner capitulation. After that is the prime time to accumulate as theres a clearer signal the bottom is in. Specifically, a signal to look for is the 14 day MACD/signal cross and the 14 day MACD continuing to stay above the signal until the price returns above the 100 week EMA. This is prime accumulation territory.
Strategy for Usage
A good strategy to use when accumulating the bottom is dollar-cost averaging over a 30 day period. The accumulation zone can last longer than 30 days but 30 days is a good range of time to DCA.
STRONG BUY IN ACCUMULATION ZONE INDICATOR - DARK GREEN
Description
We can add to the bottoming signal by looking for post-downtrend reversals inside the bottoming signal. We do this by using a 9/19 daily cross.
Strategy for Usage
These post-downtrend reversals can potentially provide better targeted days for accumulation than the broader bottoming signal and can be used to add more on that day than on an average day for the dollar cost average strategy. Say for example, use 1/3 of funds on these days rather than 1/30th.
OPPORTUNITY TO BUY BACK IN INDICATOR - BLUE
Description
When the 1d 18 EMA > 1d 63 EMA and the 12/52 1d crosses. These together provide good buy opportunities to buy bitcoin.
Strategy for Usage
If you happen to find yourself out of the market from your own TA or a trade, this signal can provide a buy opportunity to reenter the market if you're out of it.
BULL RUN LOCAL TOP INDICATOR - ORANGE
Description
We will similarly use the 100 week EMA to determine trend reversal into a bull run. When we see the 100 week EMA uptrending, we can begin to look for local tops using the 9/19 daily MACD/signal bearish cross along with the 12 EMA having a negative slope, which could be the beginning signal for a local top.
Strategy for Usage
This is a rather light indicator, but can be used in tandem with your own technical analysis to determine if you want to reenter after you exit from its signal.
LOCAL TOP NEAR BULL RUN TOP INDICATOR - RED
Description
When the 100 week EMA is in an uptrend we can look for significant loss of momentum in order to determine if a local top is in near a bull run top. Similar to the Bull Run Local Top Indicator, this strategy uses a MACD/signal cross but instead uses the 30/65 day EMAs.
Strategy for Usage
Ideally the right strategy to use here is to exit the market when this indicator starts. When the indicator ends if the "End of Bull Run Indicator" is not showing on the chart you can buy back into the market.
TOP IS LIKELY IN INDICATOR
Description
When the 100 week EMA is in a very strong uptrend and the 9/19 weekly MACD/signal bearish cross occurs, and the 63 EMA begins to downtrend.
Strategy for Usage
This signal typically accompanies the "Local Top Near Bull Run Top Indicator" therefore if you're following the strategy you would likely already be out of the market, but if you're not and this signal fires its a strong signal the top is in and we're likely going to start seeing a strong retrace. This is typically right before we see the "End of Bull Run Indicator". There is only one occurrence where it wasn't followed by a large drop & the "End of Bull Run Indicator" and that was in the 2017 bull run where there were many strong retracements post local top. The likelihood we see that again is low, but if it were to happen you can buy back into the market when the "Top is Likely In Indicator" and the "Local Top Near Bull Run Top Indicator" are not firing.
TOP IS LIKELY IN INDICATOR
Description
When the 100 week EMA is in a strong uptrend and the 9/19 weekly MACD/signal bearish cross occurs, and the 63 EMA begins to downtrend.
Strategy for Usage
This signal typically accompanies the "Local Top Near Bull Run Top Indicator" therefore if you're following the strategy you would likely already be out of the market, but if you're not and this signal fires its a strong signal the top is in and we're likely going to start seeing a strong retrace. This is typically right before we see the "End of Bull Run Indicator". There is only one occurrence where it wasn't followed by a large drop & the "End of Bull Run Indicator" and that was in the 2017 bull run where there were many strong retracements post local top. The likelihood we see that again is low, but if it were to happen you can buy back into the market when the "Top is Likely In Indicator" and the "Local Top Near Bull Run Top Indicator" are not firing.
END OF BULL RUN INDICATOR
Description
When the 100 week EMA is in an uptrend and the 1d 18 EMA crosses the 1d 63 EMA.
Strategy for Usage
When the 100 week EMA is a strong uptrend and the 18/63 cross occurs the top is very likely in. It has occurred in every bull run top leading to the bear market.

Investing - Correlation Table This correlation tables idea is nothing new, many sites provides it.
However, I couldn't find any simple correlation indicator on TradingView despite how simple this indicator is.
This indicator works as its called. Calculating the correlation between 2 projects (can be used in stocks as well) using the 'ta.correlation' feature built into pinescript.
When it comes to investing, we do not want our stocks / crypto project to be heavily correlated to each other.
If they are heavily correlated to each other, then there isn't much point in diversifying.
That being said, it can be useful for traders who trade multiple pairs.
-----------------------------------------------------------------------------------------------------------------------------------------------------------
In this indicator, consist of 5 primary input and 15 secondary input (Symbol List).
Correlation Source:
This input options allow you to change how the correlation is calculated. By default, it uses 'close'.
Correlation Percentage(%):
This input options allows you configure how many (%) of correlation is considered as 'decoupled'.
This correlation will only move between -100% ~ 100%.
100% refers to it moving together.
-100% refers to it moving the opposite direction.
For example, Project A rises in Price, what is the possibility of Project B following:
A 100% correlation between Project A and Project B, refers to Project B will follow Project A movement.
A 50% correlation between Project A and Project B, refers to there is only 50% chance for Project B to follow Project A movement.
A -20% correlation between Project A and Project B, refers to there is a 20% chance of Project B moving the opposite direction of Project A
(Refers to the table on chart above to better understand what the numbers means. DOT/USD has a 100% correlation to DOT/USD. However. MXCUSDT has a -37.2% correlation to DOT/USD.)
Amounts Bars To Check:
This input options will check the amount of bars since the last bar in the chart.
If you want to know the correlation of the past 100 days in a daily chart, you will enter '100' into this options and it will check only the past 100 days.
Symbol List
This will allow you to input all the project symbol ticker ID to add into the correlation table.
-----------------------------------------------------------------------------------------------------------------------------------------------------------
Originally, I wish to use for loop to go through the symbol list to reduce the amount of code required. However, due to limitation of 'request.security' feature, I had to abandon that idea and use hard-coded for requesting security and use a while loop to identify the symbol correlation value in the array set then set the table value accordingly.
If there is any script writer could improve this or any unclear explanation, feel free to drop a comment below.

Crypto Terminal [Kioseff Trading]Hello!
Introducing Crypto Terminal (:
The indicator makes use of cryptocurrency data provided by vendor INTOTHEBLOCK.
NOTE: The cryptocurrency on your chart must be paired with USD or USDT. Data won't load otherwise - possibly transient. For instance, BTCUSD or BTCUSDT, ETHUSD or ETHUSDT.
Provided datasets:
Twitter Sentiment Data
Telegram Sentiment Data
Whale Data (i.e. % of Asset Belonging to Whales)
$100,000+ Transactions
Bulls/Bears (Bulls Buying | Bears Selling)
Current Position PnL (Currently Open Positions for the Coin are Retrieved and Plotted. Data is Split into Currently Profitable Positions, Losing Positions, and B/E Positions)
Average Balance
Holders/Traders Percentage (Addresses are Retrieved and Classified as Holding Accounts or Trader Accounts)
Correlation
Futures OI
Perpetual OI
Zero Balance Addresses
Flow (Money Inflow & Outflow)
Active Addresses
Average Transaction Time
Realized PnL (Addresses with Realized Profits, Realized Losses, and B/E)
Cruisers
A few more data points are provided.
Additionally, you can plot the values of any dataset in a pane below price.
Below are images of plottable data; different cryptocurrencies will be shown for each example (:
Twitter sentiment data.
Assess this data lightly; difficult to confirm accuracy.
Telegram sentiment data.
Assess this data lightly; difficult to confirm accuracy.
Percentage of asset belonging to whales.
$100,000+ transactions (volume oriented)
Bulls buying; bears selling.
Current positions at profit; current positions at loss; current positions at breakeven.
Average balance.
Percentage of asset belonging to traders; percentage of asset belonging to holders.
Asset's 30-interval correlation to BTC.
Perpetual open interest.
Zero-balance addresses.
Flows.
Active addresses.
Average transaction time.
Addresses at realized profit; addresses at realized loss; addresses at breakeven.
Cruiser data.
Futures open interest.
Naturally, this data isn't provided for every cryptocurrency; NaN values are returned in some instances.
Table 1
I provided three data tables, which load independently, so you don't have to change plotted data to access values.
Table 2
Lastly, you can create a 10-asset crypto index and run calculations against it.
The image shows an example.
I'll update this script with additional calculations/data in the near future. If you've any suggestions - please let me know!
Enjoy (:

MASIG#2this indicator founded from easy combined
1.EMA
2.ATR/Supertrend
3.ADX/DI+DI-
4.MACD
5.Dochian
6.OBV
and show by line label and background

Sherry on cryptoIf the price is above the 200 EMA, you are allowed to open only long positions and avoid shorts.
If the price is below the 200 EMA, you are allowed to open only short position and avoid longs. Don't use this indicator alone, use RSI, Stochastic RSI etc. Do not use this indicator like a bot, do TA and FA as well. This is just an indicator, do not always rely on it. It requires experience. This indicator has different winrate in different timeframes. Set its value accordingly.
CANDLE FILTER Todays scripts is based on my Pullback And Rally Candles with other meaningful candles such as Hammers and Dojis.
You can choose which Candles to show on the cart and if you want to candles to appear above or below a moving average.
If you follow my work, you may recognise some of these candles which I'm about to show you however these candles are 1) more refined and 2) has moving average filters.
Ive included a D,6H,1H Candle in this script as on different timeframes - each swing low on average has a different amount of bars within the swing low / swing high so the DPB and RD will only work on the Daily
//Pullback candle
This candle is very powerful when used with simple Price Action such as Market Structure//Demand zones and support zones. (((((WORKS BEST IN UPTRENDS AND BOTTOM OF RANGES)))))
Ive included a D,6H,1H Pullback Candle in this script as on different timeframes - each swing low on average has a different amount of bars within the swing low so the DPB will only work on the Daily
//DAILY PULLBACK (Swing Traders)
snapshot
//4H PULLBACK (Swing Traders)
snapshot
- this signal will produce more signals due to the swing low filter on the 4H
//1H PULLBACK
snapshot
- this signal has been refined due to too many candle displaying in weak areas
!!!IF YOU DONT WANT TO USE PULLBACKS DURING DOWNTRENDS THEN USE THE EMA FILTER TO TURN OFF THE PULLBACKS WHEN PRICE IS BELOW THE MOVING AVERAGE!!!
//Rally candle (My personal Favourite) (((((WORKS BEST IN DOWNTRENDS AND TOP OF RANGES)))))
This candle is very powerful when used with simple Price Action such as Market Structure//Supply zones and Resistance zones.
//DAILY RALLY(Swing Traders)
snapshot
//4H RALLY(Swing Traders)
snapshot
- this signal will produce more signals due to the swing high filter on the 4H
!!!IF YOU DONT WANT TO USE RALLIES DURING UPTRENDSTHEN USE THE EMA FILTER TO TURN OFF THE RALLIES WHEN PRICE IS ABOVE THE MOVING AVERAGE!!!
//POWERFUL DOJIS (INDECISION)
snapshot
We look for indecision in key areas to see if momentum is shifting. When combined with Pullbacks or Rallys - this will enhance the odds of a probably area.
//HAMMERS
snapshot
//MOVING AVERAGES
snapshot
Short EMA = 50
Long EMA = 200
This filter can be used when the market is trending - look out for rejections off the moving averages
Also you can chance the Short And Long EMA to choose which MA cross you want to use
snapshot
ALSO ALL THE CANDLES HAVE A ALERT CONDITIONS WHICH YOU CAN ACCESS - THIS WILL ALERT ANY CANDLE YOU CHOOSE
Please leave a like/comment on this post as this is much appreciated....

MACD Multiple AlertsThis script help traders to catch bullish and bearish momentum. It creates an alert for 40 altcoins based on the MACD cross over and cross under.
The MACD input are adjustable in the settings and you can choose your favorite assets.
Simply add this indicator to the chart wait that if finish to load and then create an alert on the time frame of your choice.
Enjoy your trading
F_rank_01

ScalpiusTrendCrypto trader and trading system developer Scott Phillips recently introduced a crypto trading system that specifies a set of rules for determining whether the crypto is in a trend. While the rules are not overly complex, they are complex enough that manual trend determination is somewhat laborious and prone to error. The ScalpiusTrend script is designed to automate this process. It operates is briefly summarized as follows:
1. It looks for a bar that breaks the Bollinger Band. That starts a pending trend.
2. When we find another bar with a higher high and higher close (uptrend) or lower low and lower close (downtrend), then the trend is confirmed.
3. The trend ends when the price touches the opposite Bollinger Band, or goes 20 bars without making a new low and new close.
The indicator is shown as a histogram plot below the main chart window. By default, the short black pending trend bars are off, but you can enable the Pending Bars checkbox in the indicator Settings menu to turn them on.

Level 1 - Learn to code simply - PineScriptThe goal of this script is honestly to help everyone learn about trading with bots and algos.
At least, to get started.
Level 1:
10 lines of code.
learn to plot 2 moving averages on your chart.
learn to create a signal from a crossover.
learn the very basics of Pine Script algo.

Candle Colored by Volume Z-score [Morty]This indicator colors the candles according to the z-score of the trading volume. You can easily see the imbalance on the chart. You can use it at any timeframe.
In statistics, the standard score (Z-score) is the number of standard deviations by which the value of a raw score (i.e., an observed value or data point) is above or below the mean value of what is being observed or measured. Raw scores above the mean have positive standard scores, while those below the mean have negative standard scores.
This script uses trading volume as source of z-score by default.
Due to the lack of volume data for some index tickers, you can also choose candle body size as source of z-score.
features:
- custom source of z-score
- volume
- candle body size
- any of above two
- all of above two
- custom threshold of z-score
- custom color chemes
- custom chart type
- alerts
default color schemes:
- green -> excheme bullish imbalance
- blue -> large bullish imbalance
- red -> excheme bearish imbalance
- purple -> large bearish imbalance
- yellow -> low volume bars, indicates "balance", after which volatility usually increases and tends to continue the previous trend
Examples:
* Personally, I use dark theme and changed the candle colors to black/white for down/up.
Volume as Z-score source
Any as Z-score source, more imbalances are showed

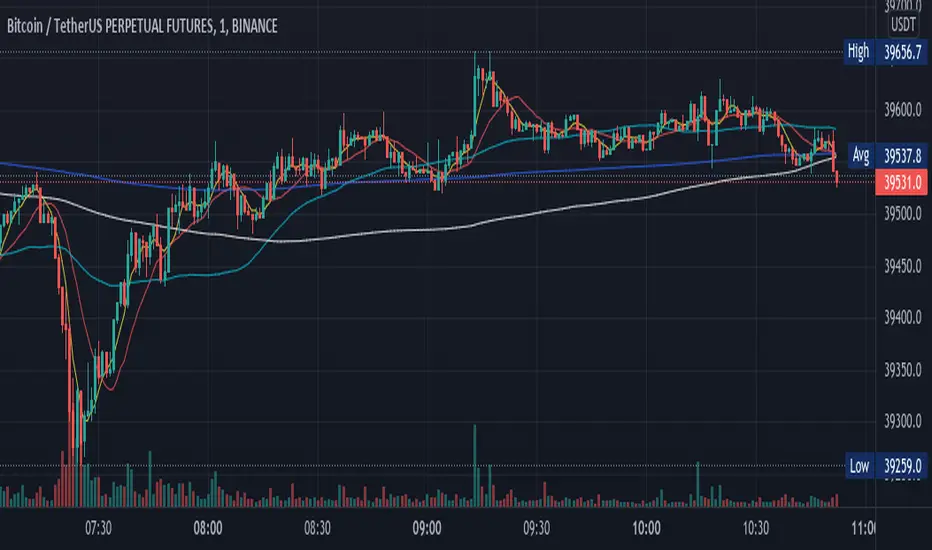
Moving Averages With Cross AlertsA simple way to add up to 5 moving averages with optional crossover/crossunder alerts.
Available options for Moving Average Type are:
SMA
EMA (default)
HMA
RMA
WMA
VWMA
VWAP
ALMA
By default, 5 moving averages are enabled and set to the following:
MA1 set to 5
MA2 set to 13
MA3 set to 50
MA4 set to 200
MA5 set to 800
Each moving average has the following options:
Enable/Disable
Source (default is close)
Length
Color
Buy/Sell Aggregated Delta Pressure - InFinitoModified & Updated script from MARKET VOLUME by Ricardo M Arjona @XeL_Arjona that Includes Aggregated Volume , Delta Buy/Sell Pressure
Aggregation code originally from Crypt0rus
***The indicator can be used for any coin/symbol to aggregate volume , but it has to be set up manually***
***The indicator can be used with specific symbol data only by disabling the aggregation option, which allows for it to be used on any symbol***
- Calculated based on Aggregated Volume instead of by symbol volume . Using aggregated data makes it more accurate and allows to compare volume flow between different kinds of markets (Spot, Futures , Perpetuals, Futures+Perpetuals and All Volume ).
- As well, in order to make the data as accurate as possible, the data from each exchange aggregated is normalized to report always in terms of 1 BTC . In case this indicator is used for another symbol, the calculations can be adjusted manually to make it always report data in terms of 1 contract/coin.
- Buy/Sell Pressure: Smoothens the buy and sell volume into a signal for each. Which makes it easier to identify Buy and Sell Volume Flow.
- Buy/Sell Delta Pressure: Calculates the difference between Buy & Sell Pressure and plots a Delta signal that shows who is in control currently.
- Buy/Sell + Delta Pressure: Displays both Buy & Sell Pressure and Delta pressure. This can help to visualize who is in control but also how much pressure there is on each side.
- A Moving Average can be plotted to the Delta pressure. This, with confluence, can give great entries/exits
Things to look for:
- Divergences: If price keeps moving in one direction but the pressure to that side decreases it can be inferred that the move might slow down soon or revert. As well if pressure to one side increases but price does not react to it, it signals that the other side is stronger.
- MA/Zero Crossovers: Delta Pressure Crossover of its moving average or the 0 Line can indicate direction changes prematurely

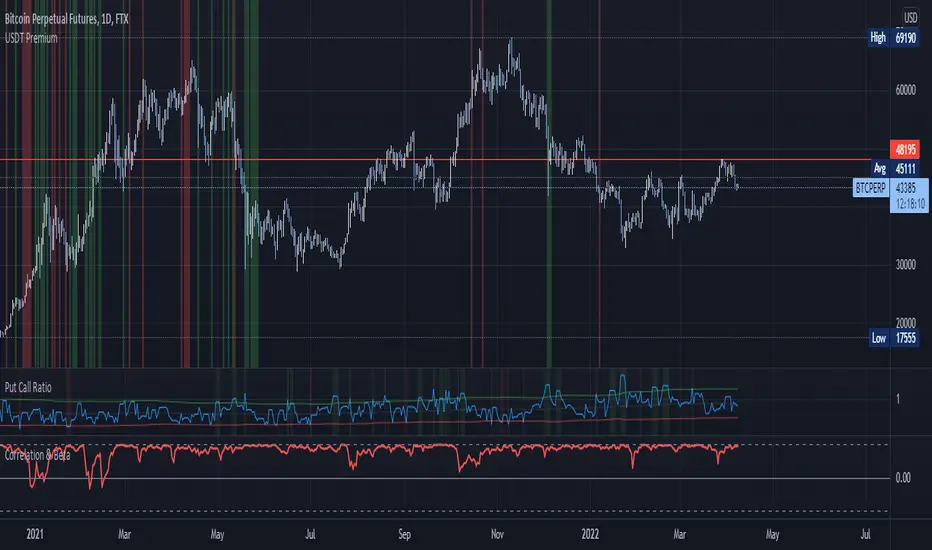
USDT/USD PremiumKraken + FTX USDT premium indicator.
Inspired by John J Brown, forked from IAmSatoshi (Migrated to V5 and few changes + more markets coming).
John J Brown: "
USDt premium/discount exist because of conversion fees.
It is a good market indicator:
If USDt>USD, then market is growing and in need of liquidity;
If USDt
Aggregated Money Flow Index - InFinitoModified Version of In-Built Money Flow Index Indicator. Aggregated Volume is used for it's calculation + a couple of other features.
Aggregation code originally from Crypt0rus
***The indicator can be used for any coin/symbol to aggregate volume , but it has to be set up manually***
***The indicator can be used with specific symbol data only by disabling the aggregation option, which allows for it to be used on any symbol***
- Calculated based on Aggregated Volume instead of by symbol volume . Using aggregated data makes it more accurate and allows to compare volume flow between different kinds of markets (Spot, Futures , Perpetuals, Futures+Perpetuals and All Volume ).
- As well, in order to make the data as accurate as possible, the data from each exchange aggregated is normalized to report always in terms of 1 BTC . In case this indicator is used for another symbol, the calculations can be adjusted manually to make it always report data in terms of 1 contract/coin.
- Added Moving Average ( SMA , EMA , WMA , RMA, VWMA ) that can be plotted to the MFI
- Added 10/90 level and 45/55 range level
Things to look for:
- Divergences: Can be a very good reversal signal
- MA crossovers & Oversold/Overbought levels crossover: With proper confluence, entering a position at MA crossover and exiting at oversold/overbought levels can give very good swing setups (Or scalps on LTF)
- Center range retests: Once in a trend, retesting the middle range can give very good entries and confirmations of the trend
- Confluence of the latter: In combination, if more than one of these occur at the same time it can give more clarity regarding the current state of the market.

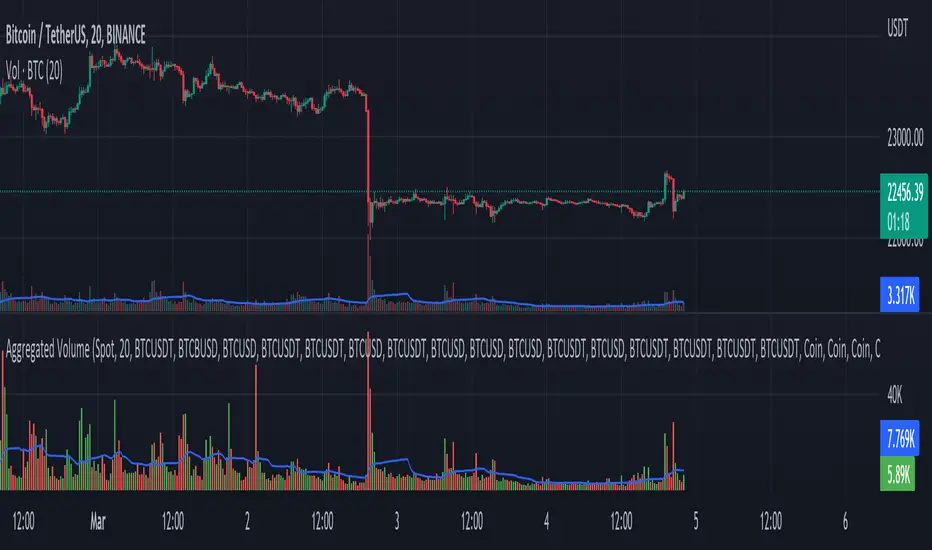
Aggregated Volume - By InFinitoVolume indicator that works like a normal Volume indicator with the following additional features:
- Aggregates Volume across different exchanges and Market Types - *Original Aggregation Code By Crypt0rus*
- Displays data by Market Type and combinations of Market Types (Spot, Futures , Perpetuals, Futures+Perpetuals & All Volume )
- Allows for the user to select the exchanges from which to aggregate Volume (This allows for the aggregation of any other pair i.e ETH, SOL, LUNA)
- Normalizes the Volume reported through TradingView by every exchange in order to homogenize the data (i.e Binance reports Bitcoin Volume in BTC terms BUT FTX reports Bitcoin Volume in USD)
- Allows for manual input of how Volume is reported in a particular Pair/Exchange (i.e If you want to aggregate data from the BTCEUR pair, you can select 'Other' and introduce the Value of EUR in USD terms)
COIN: Select this option if the volume is reported in terms of the asset traded ( BTC , ETH, SOL, etc....)
USD: Select this option if the Volume is reported in terms of the USD amount traded
OTHER: Select this option in case the Volume is reported in another currency (EUR, ETH, etc....)
NOTE: *ALL VOLUME IS AGGREGATED IN TERMS OF THE ASSET TRADED, FOR EXAMPLE IN THIS CASE: BTC . BUT IF YOU'RE AGGREGATING BNB PAIRS, VOLUME WILL BE CALCULATED TO BE DISPLAYED IN BNB TERMS*
Feel free to leave suggestions/questions in the comments or to message them directly to me
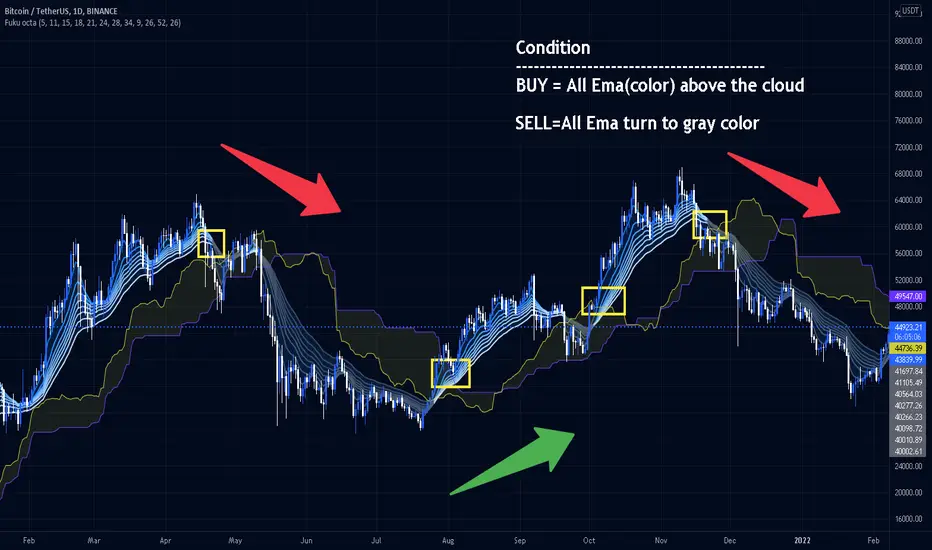
Fukuiz Octa-EMA + IchimokuThis indicator base on EMA of 8 different period and Ichimoku Cloud.
#A brief introduction to Ichimoku #
The Ichimoku Cloud is a collection of technical indicators that show support and resistance levels, as well as momentum and trend direction. It does this by taking multiple averages and plotting them on a chart. It also uses these figures to compute a “cloud” that attempts to forecast where the price may find support or resistance in the future.
#A brief introduction to EMA#
An exponential moving average (EMA) is a type of moving average (MA) that places a greater weight and significance on the most recent data points. The exponential moving average is also referred to as the exponentially weighted moving average. An exponentially weighted moving average reacts more significantly to recent price changes than a simple moving average (SMA), which applies an equal weight to all observations in the period.
I combine this together to help you reduce the false signals in Ichimoku.
#How to use#
EMA (Color) = Bullish trend
EMA (Gray) = Bearish trend
#Buy condition#
Buy = All Ema(color) above the cloud.
#Sell condition#
SELL= All Ema turn to gray color.
Concept Dual SuperTrendSimple SuperTrend indicator giving you the option to display two SuperTrends on a single script plus additional customization features. Dual setup inspired by Income Sharks 🦈

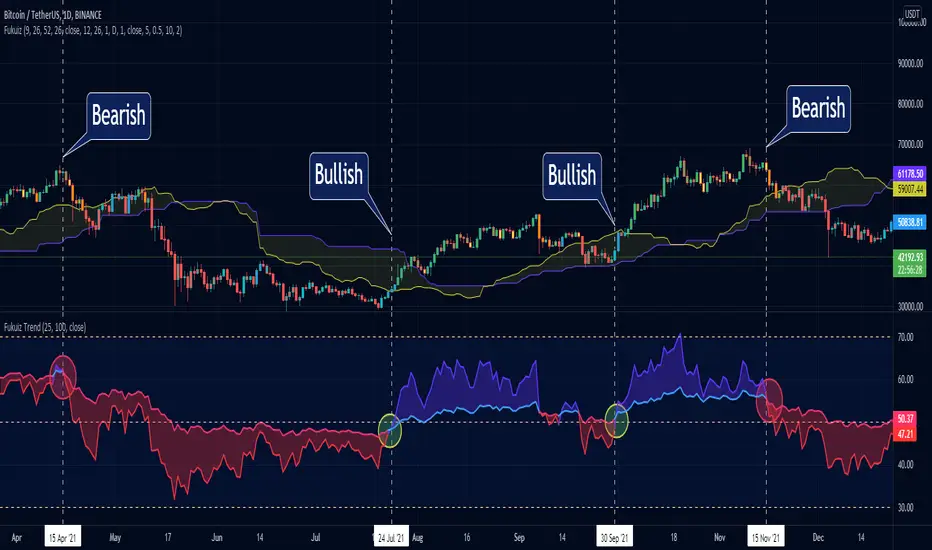
Fukuiz TrendThis indicator base on RSI of 2 different periond.
#A brief introduction to RSI #
The relative strength index (RSI) is a momentum indicator used in technical analysis that measures the magnitude of recent price changes to evaluate overbought or oversold conditions in the price of a stock or other asset. The RSI is displayed as an oscillator (a line graph that moves between two extremes) and can have a reading from 0 to 100. The indicator was originally developed by J. Welles Wilder Jr. and introduced in his seminal 1978 book, “New Concepts in Technical Trading Systems.”
Traditional interpretation and usage of the RSI are that values of 70 or above indicate that a security is becoming overbought or overvalued and may be primed for a trend reversal or corrective pullback in price. An RSI reading of 30 or below indicates an oversold or undervalued condition.
#In this indicator#
I see that you can use 2 RSI with different periond to suggest Bullish trend and Bearish trend.
#Conditions between short and long RSI crossing#
Crossover = Bullish trend (blue zone)
Crossunder = Bearish trend (red zone)
Lankou VS BTC all
/!\ To make it work well use -> pin at new right scale
This script displays the comparison with BTCUSDT
it permits to see if an asset is gaining value against BTC, and fastly scan USDT asset to determine if they are bullish
It works for ANY asset, as it's dividing it's price by the BTCUSDT one

Volatility indicator based on ATR Hello,
I'm sharing to you a volatility indicator I've done in the last few weeks based on ATR. There is multiple functionalities on this indicator, the first one is an overlay displaying when an asset is in an "overvolatily zone"
(displayed with red cross) and when we are in an "undervolatily zone" (displayed with green cross). You can change the sensibility of the signals in the parameters if you wish to have more or less greedy signals
(it will only modify the overvolatility signals). By the way those signals are not working for week-ends because volatility works differently on week-ends and it's not a good idea to count week-ends in the calculations, so do not worry if you see no signals on weekends.
Second part of the indicator is something I called "Atr bands" it's an equivalent to the famous Bollinger-Bands but based on ATR. I haven't backtested them yet but they seems really interesting in low ut
(15 mins seems to be the best ut for those) and they seems pretty bad in high ut so they can maybe be useful for low ut scalping.
Last thing, there is a parameter allowing you to display bands on the week-ends so you can easily see where the indicator won't give signals.
I would be really happy if I could have some feedsback if you try the indicator :)
Have a wonderful day
