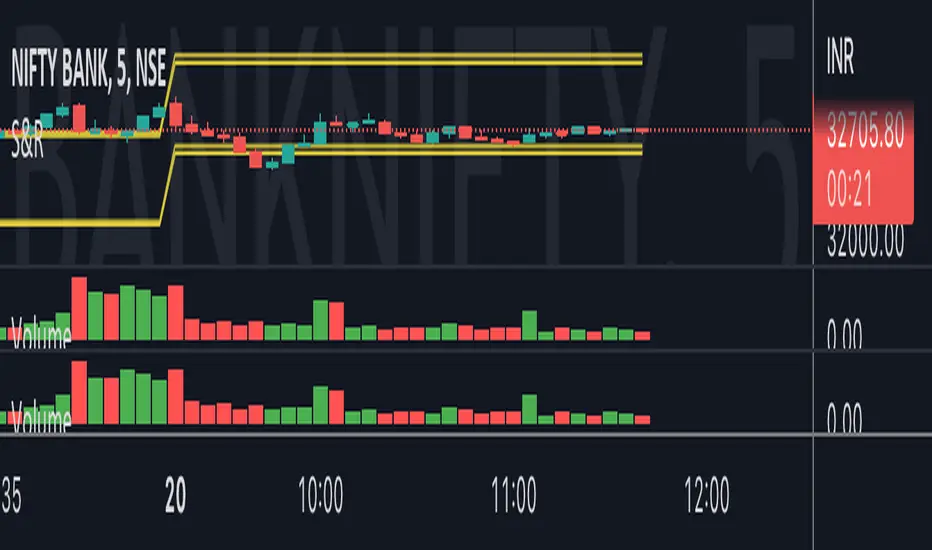
Nifty VolumeWhy this Script : Nifty 50 does not provide volume and some time it is really useful to understand the volume .
This is the pine script which calculate the nifty 50 volume .
Logic :
Take each stock contribute to nifty 50 and find it's volume .
Multiply the same with contribution percentage of the same on Nifty 50
Add up all of them and find the total volume .
There is a similar script by @daytraderph which is built for Bank Nifty (custom volume) . I took the same and built for Nfity.
Nifty has 50 stocks and you cant call security method more than 40 times from one Pine script, so this is the limitation of this script. It consider top 40 stocks and find the volume (which contribute pretty much around 95% of the volume) and convert the same to 100 %
Custom
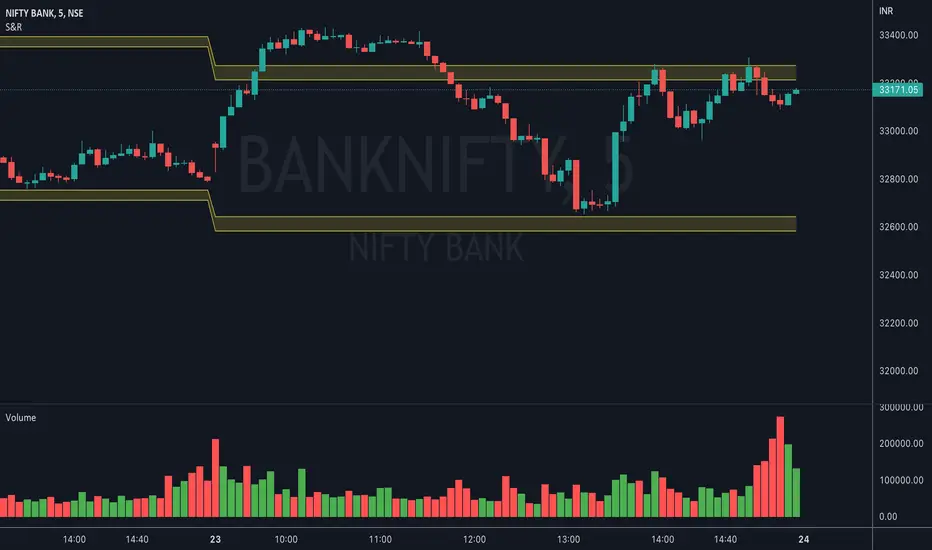
Bank Nifty VolumeWhy this Script : Nifty 50 does not provide volume and some time it is really useful to understand the volume .
This is the pine script which calculate the nifty 50 volume .
Logic :
Take each stock contribute to nifty 50 and find it's volume .
Multiply the same with contribution percentage of the same on Nifty 50
Add up all of them and find the total volume .
I took the open source code from @daytraderph script called, Custom Volume
I will make sure I will update the contribution percentage of all stocks my self instead o you update using input methods. This is the difference. Some people don't know where to look at this to update the value, so for them this script might be useful. And this is the only difference comparing to Custom Volume script.
LWMA: Linear Weighted Moving AverageCouldn't find searching for Linearly Weighted Moving Average (LWMA) in tradingview. Found one with the LWMA title, but it uses plain WMA calculation without the linearity which more heavily weights recent price data, which I need, so I try to made one.
LWMAs are also quicker to react to price changes than SMA and EMA. If you want a moving average with less lag than an SMA, try a LWMA.
It kind of also have a more clarity in defining the price trend and reversals. Trade signals usually based on crossovers, they can also indicate areas of potential support or resistance. But beware though, multiple false signals may also occur before a significant trend develops. Use a filter, some decent volatility oscillator might do the job.
--
The formula for this Linearly Weighted Moving Average is:
LWMA = (( P n∗ W 1)+( P n−1∗ W 2)+( P n−2∗ W 3)...) / ∑W
P = Price for the period
n = The most recent period, n-1 is the prior period, and n-2 is two periods prior
W = The assigned weight to each period, with the highest weight going first and then descending linearly based on the number of periods being used.
I hope I'm doing right translating it to Pine Script 4. Let me know if I miss something.

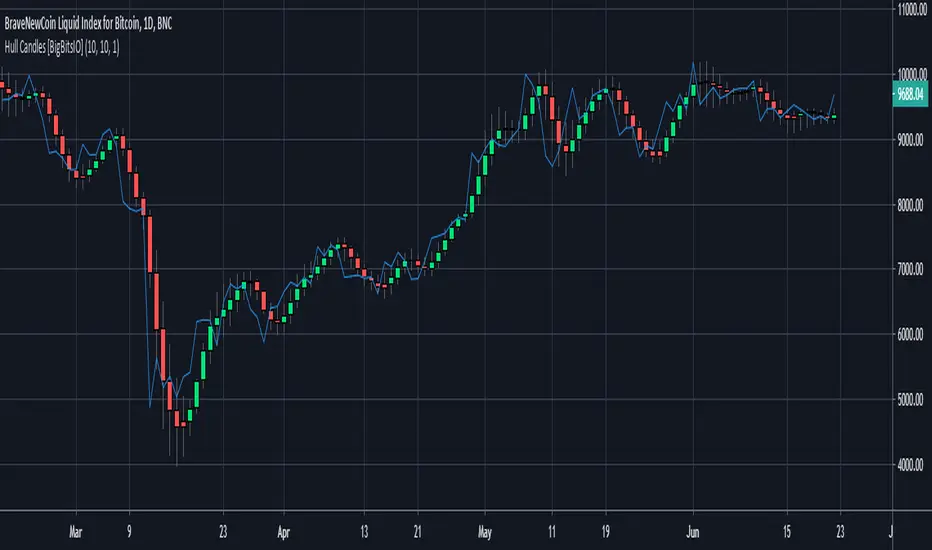
Hull Candles [BigBitsIO]This script is for custom candles based on an HMA calculation with a default period of 10 as well as an SMA of the close price, defaulted to 1 period to only show the current price. The purpose of the custom candles is to try and reduce noise from candles and help identify trends. These custom candles somewhat resemble Heikin-Ashi candles in their appearance.
Explained:
- Open, High, Low and Close (o, h, l, and c) are all calculated using an HMA calculation based on a user input length/period, defaulted at 10.
- Candle colors are determined by using the same HMA calculation on the ohcl4 and comparing it to the previous candle. Green candles have an ohlc4 greater than the previous candle, all other candles are red.
- The current price is plotted with the default blue line with an SMA calculation with 1 period to allow customization of smoothing if necessary to identify trends.
DISCLAIMER: For educational and entertainment purposes only. Nothing in this content should be interpreted as financial advice or a recommendation to buy or sell any sort of security or investment including all types of crypto. DYOR, TYOB.
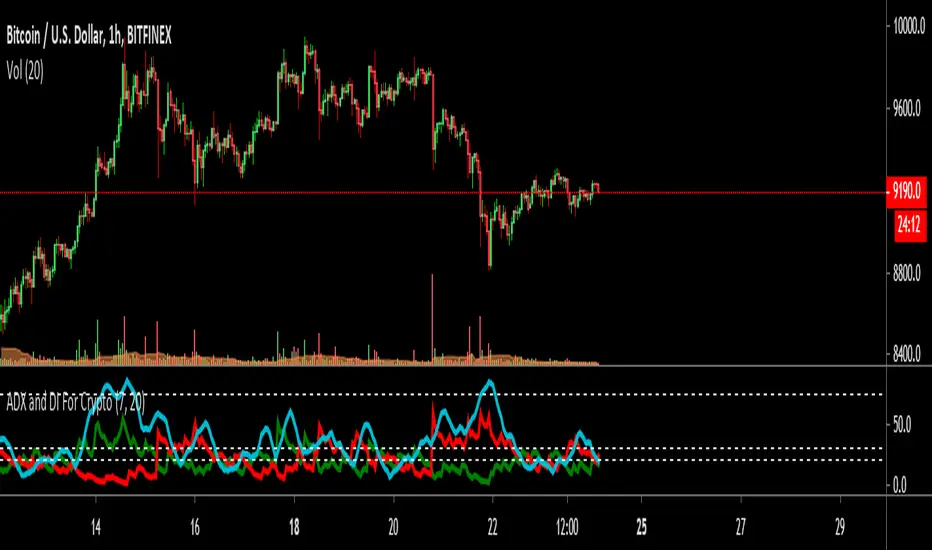
ADX and DI For Cryptocustomized version to add my favourite settings for crypto
Best time frame is daily followed by 4H
ADX Near 20 or less means trend is choppy and weak
ADX Cross over 30 means trend is starting to gain momentum
ADX Near 75 means momentum is near maximum, trend needs to rest for a while ( The area between 70~90 )
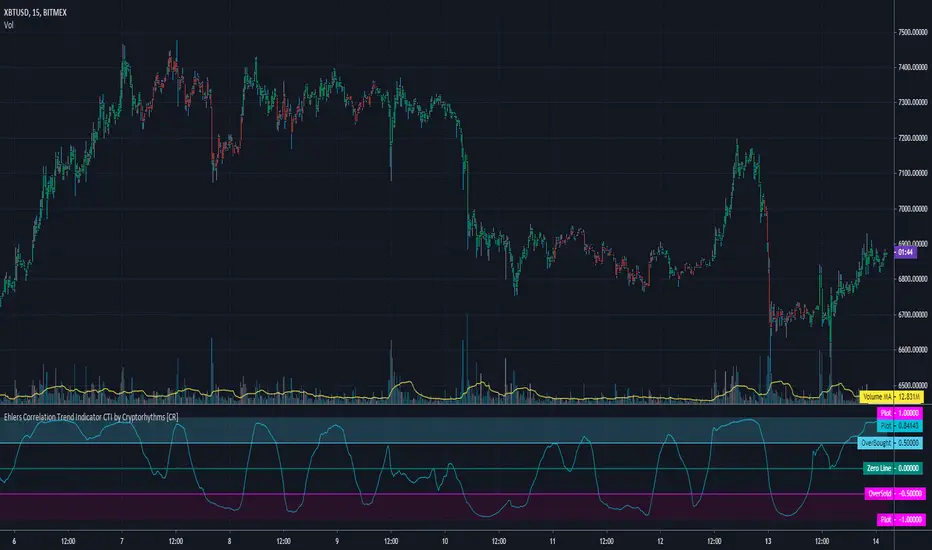
Ehlers Correlation Trend Indicator CTI by Cryptorhythms [CR]Ehlers Correlation Trend Indicator CTI by Cryptorhythms
📜Intro
In his article “Correlation As A Trend Indicator” in issue May 2020 of TASC, author John Ehlers introduces a new trend indicator that is based on the correlation between a security’s price history and the ideal trend: a straight line. He describes methods for using the indicator to not only identify the onset of new trends but to identify trend failures as well. He presents what looks like a simple and elegant idea for a trend-detection and mode-switching indicator.
📋Comments
Careful market selection may be the key to a correct application of the indicator. Even such barebone rules could shine with stocks like AAPL that tend to develop prolonged trends. But for others like CAT, which can keep oscillating in ranges for years, results will be much less impressive. They require a different approach. For example, you would want to buy when Correlation Trend falls significantly below zero and sell when it reaches positive values.
Therefore, it would be an interesting problem to research Correlation Trend’s ability to identify the switch to a cycle mode. That might help develop countertrend systems and
trade pullbacks. Another possible application might be to act as a system filter of change from trending mode to mean-reversion mode.
Extras
As usual when porting indicators to the library here on tradingview, I like to add some extra flare!
💠Customizable Overbought and Oversold Zones for Alert Creation
💠Bar coloration based on trade state for easy visual at a glance chart checking
💠Some basic example Entry and Exit conditions and a simple Trade State Engine to get you going creating your own strategy
Enjoy!
👍 We hope you enjoyed this indicator and find it useful! We post free crypto analysis, strategies and indicators regularly. This is our 81st script on Tradingview!
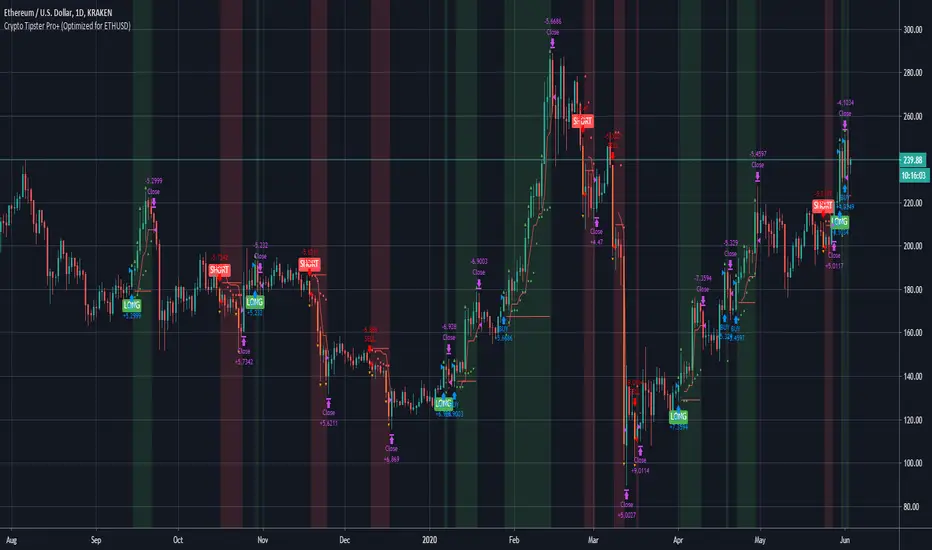
Crypto Tipster Pro+ (Optimized for ETHUSD)===========
Crypto Tipster Pro+ Optimized for ETHUSD
===========
This script is a carbon-copy of our Crypto Tipster Pro Strategy , but also includes our Custom & Fully Optimized Settings for turbo-charging your Ethereum (ETHUSD) trading.
-----------
We keep all our Crypto Tipster Pro+ (Optimized) strategies regularly updated and maintained. The purpose of these Add-On's to our Crypto Tipster Pro Strategy is to keep each trading plan relevant, up-to-date and most of all profitable within ever-changing markets.
We will always keep our main Crypto Tipster Strategy active, as we find the default settings are the best "all-rounder" set-up and work with many crypto pairs over many different time frames, try it for yourself! This Set-Up for Ethereum enables you to hone in on one certain trading pair on the 'D' chart and maximize your overall trading experience.
-----------
Visit the link below for Full & Immediate Access!
Good Luck and Happy Trading!
Nth-Occurrence Custom barssince() Function by Cryptorhythms [CR]Nth-Occurrence Custom barssince() Function by Cryptorhythms
Description
The vanilla barssince() function in pine only finds the number of bars since the most recent occurrence of the condition. This version allows you to specify an Nth occurrence back to check the bars since! Its also a nice little one liner.
I really hope you enjoy it and if you're looking for more, this is our 79th script on TV, so there is plenty to choose from!
Let me know in the comments if you create anything useful from this or think of anyway to improve it!

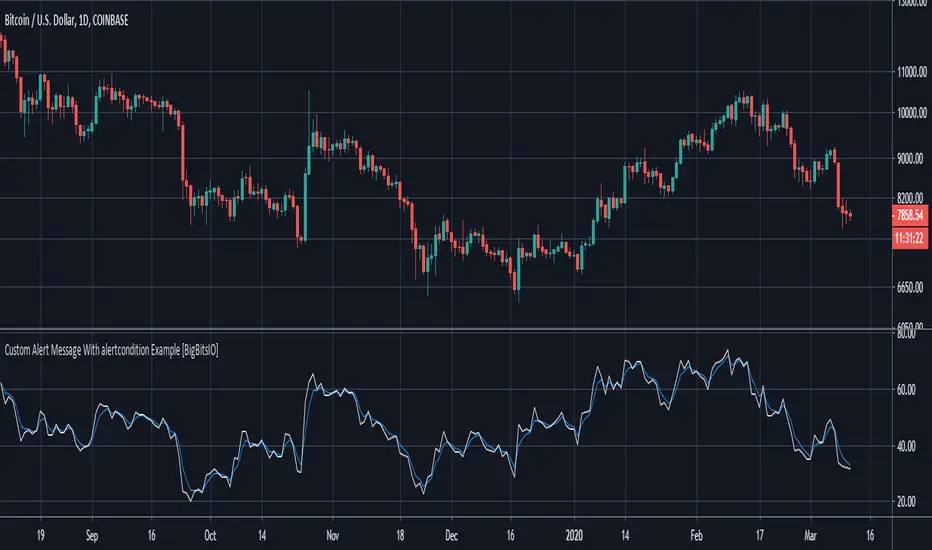
Custom Alert Message With alertcondition Example [BigBitsIO]This was a follower suggested script. This script shows an example of how to create a custom alert message using the alertcondition() function in pine.
Features:
- Well documented code with links to documentation for specific functions.
- Two alertconditions in a different order than the plots they reference to show the importance of plot IDs.
In order to actually get an alert with this script, you must create an alert through TradingView and reference this indicator and then reference the specific alert condition you want that alert to use.
For more information, contact me on social media or check YouTube for the associated video.
*** DISCLAIMER: For educational and entertainment purposes only. Nothing in this content should be interpreted as financial advice or a recommendation to buy or sell any sort of security or investment including all types of crypto. DYOR, TYOB. ***
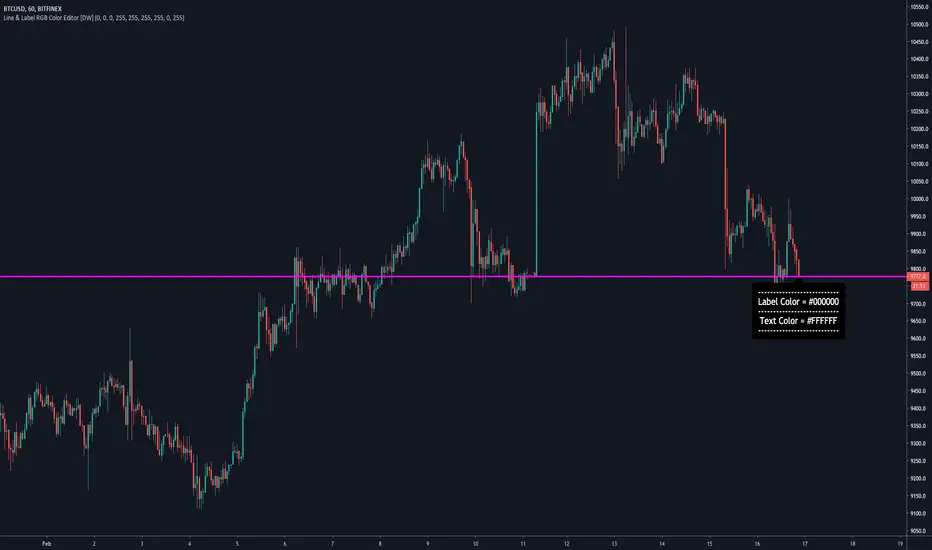
Line & Label RGB Color Editor [DW]This script is a template designed to provide developers with UI color customization for v4 lines and labels.
The color pallete used within this script is a full spectrum "web safe" format with 216 colors to choose from.
Colors are easily modified via the RGB inputs. The designated color selector function takes in the RGB values and returns the corresponding hex color.
Transparency can be modified as well. However, the color.new function only supports constant integers for transparency value, so it has to be manually adjusted within the code.
On line 42, you'll see a variable within the color selector function named trans. This is the transparency value, which can be set to any integer from 0 to 100. I have it set to 0 by default.
I included a sample label to demonstrate how the color editor works. It also displays the hex codes for the current label and text colors for some additional reference.
Implementing this in your own script is pretty straightforward.
All you need to do is copy the color selector function and inputs (feel free to name them whatever you want) into your desired script. Then, you can use them to declare your color variables.
[Birbicator] StochTKDBirbicator is a custom indicator prototype based on Stochastic oscillator, enriched with Stochastic of Tenkan and Kijun of Ichimoku with adjusted, prototyped settings. It includes the ribbon, which corresponds with the momentum per Stochastic oscillator crossovers. It involves histogram as well which displays the relation of distance between Tenkan and Kijun. It displays the coloured candles in the main chart also. The orange colour is bullish while dark candle is bearish. White candles are neutral.
The indicator displays the strength of the trend when Stochastic and TK are following the same direction. The stronger buy/sell signal appears on the Stoch crossover simoultaneous to Histogram crossover.

Multiple EMAs with marked zones and custom timeframe supportThis script plots 10 exponential moving averages and marks the areas between them.
The lengths are Fibonacci numbers starting from 5 and ending with 377.
The colors indicate the length of the moving average, green for the shortest and purple for the longest.
The zones between consecutive EMA's (e.g. 5 and 8 ema ) are market according to the color of the greater one in value.
By default the script plots values for the current time frame, but supports custom time frames.
I'm releasing this script with an open visibility. Feel free to suggest improvements!
Enjoy,
s0ullight

Compact Self-Adjusting SuperTrendA custom version of Self Adjusting SuperTrend that can be used as source for your trading frameworks and indicators.

Your CRYPTO Screener - MACD 0 LAG editionHello traders
What's good?
1 - Quick introduction
This script is to demonstrate a proof-of-concept - showing you again what you thought wasn't possible might become (with some tricks) in the realm of possibles !!!.
I get requests for people who want a custom screener because the native TradingView Stocks/Forex/Crypto screeners don't allow to plug external indicators. (example: www.tradingview.com
This is entirely true and I have also good news for you, we can hack the system one more time. As Hackerman would say, "IT"S HACKING TIME !!!" (ref : KUNG FURY . (#geek #reference #done #for #today)
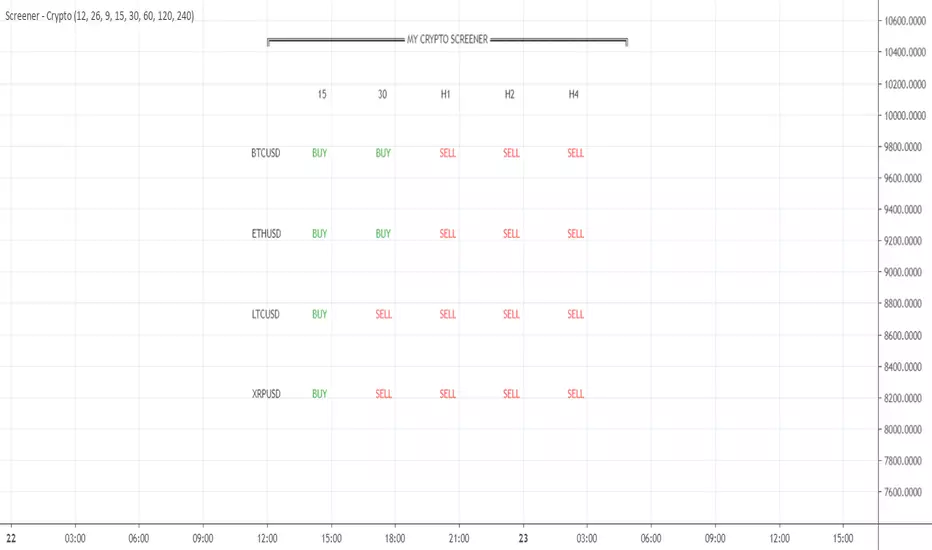
What if you could build your own personalized screener based on your custom indicator? "No Dave stop smoking, that's not possible, go back to eating your baguette". Say no more, let me present you my new script called YOUR CRYPTO Screener (MACD 0 LAG)
2 - What is a MACD ZERO LAG?
We'll all agree this indicator is NOT in the TradingView screeners so I'm not cheating here :)
A MACD ZERO LAG is a MACD that .... suspens.... wait for it.... DOES NOT lag.
The traditional MACD is based on exponential moving averages and as moving averages are lagging, then the MACD is lagging also. I'll spare you all the maths behind the MACD ZERO LAG but in short, this is a way more reactive indicator than the traditional MACD
I shared before the version that I personally use for my own trading : MACD 0 LAG nTREND coloring
3 - Crypto Screener specifications
If I could do a screener as complete as the native one, this would be wonderful but ... we cannot and this is due to technical reasons. To call indicators from different timeframes, I have to use the security function. And we're limited to 40 security calls per indicator.
That explains why I selected 4 crypto assets and 5 timeframes and the MACD zero lag output for each asset/timeframe - which gives a total of 4 * 5 * 2 = 40
You'll be able to select from the interface the 5 timeframes that you want for your screener
In this script, you'll get a :
- BUY whenever the MACD ZERO LAG for your asset/timeframe is green.
- SELL whenever the MACD ZERO LAG for your asset/timeframe is red.
4 - Can you hack it even more?
If you want to add other timeframes or assets, you can either, change the code or add the indicator on another chart.
I made the source code generic enough so that you can update it yourself easily
Example:
Chart 1 will list BTCUSD, ETHUSD, LTCUSD, and XRPUSD in m5/m15/m30/H1/H4 and Chart2 could list BTCUSD, ETHUSD, LTCUSD and XRPUSD in H6/H8/H12/Daily, etc...
Once again the sky (and your computer RAM capacity) is the limit
5 - Can you super hack it even more?
1/ This script is only a proof-of-concept that you can build your own custom screener. Imagine having the Algorithm Builder and being able to connect it in a single click to a custom screener using your own configuration :)
How coooooooooooooooool would that be!!!
This screener version will be available on my website in a few weeks along with all the tools I'm spamming you about since the beginning of July (#shameless #self-advertising)
2/ For a nicer scripter, let's keep in mind that TradingView just enabled Webhooks this week. This will allow my company to offer custom screeners design and hosted on your own website. Those screeners will be for sure nicer than the indicator version
That's it for today and for this week
I won't even touch the laptop this weekend and will enjoy life a bit
Love you all
Dave
____________________________________________________________
Be sure to hit the thumbs up. Building those indicators take a lot of time and likes are always rewarding for me :) (tips are accepted too)
- If you want to suggest some indicators that I can develop and share with the community, please use my personal TRELLO board
- I'm an officially approved PineEditor/LUA/MT4 approved mentor on codementor. You can request a coaching with me if you want and I'll teach you how to build kick-ass indicators and strategies
Jump on a 1 to 1 coaching with me
- You can also hire for a custom dev of your indicator/strategy/bot/chrome extension/python
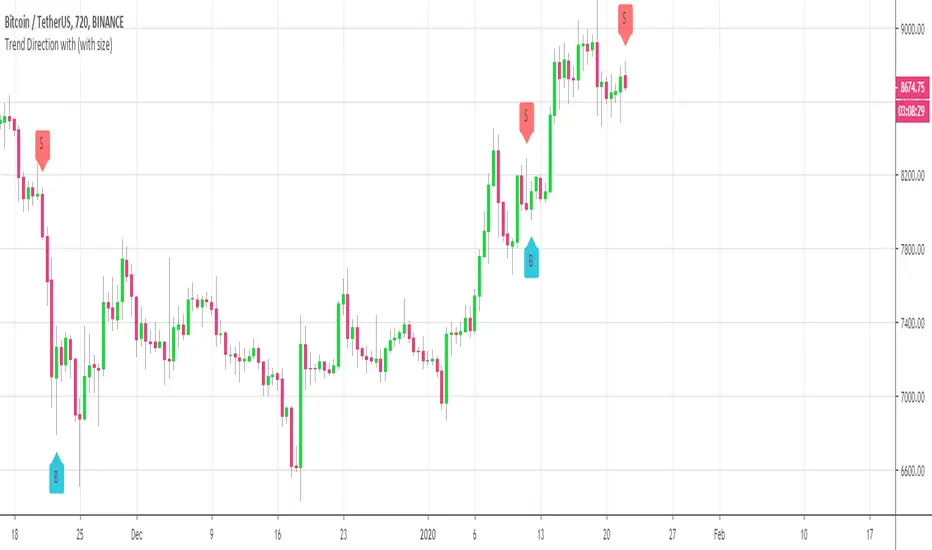
Customizable Trend Direction (Open-Source)Hello everyone
I received a ton of requests for this script so I decided to share it
I did it for a client who didn't want to pay (you can all blame... or even thank him for this script) in the end and I don't want to sell it on my website.
Not because it's not interesting but because my website will be a place to showcase and rent the Algorithm Builders mostly
What is it about?
Basically, it shows how you could convert a plotshape into a label.new object. Very interesting if you want someday to convert your V3 script into V4
With this script, it shows that you can in V4 ( but couldn't do in V3 ) do the followings :
- change dynamically the size (from tiny to huge) of any object
- change dynamically the text (from whatever to whatever) of any object
Screenshot of the user interface
imgur.com
Other use cases
I did it with the Trend Direction but could work with anything really.
- Any indicator with a visual signal. You can know personalized from a user interface the text, size and also the vertical shift. I didn't do it for that one but label.new takes a (x,y) coordinates so playing with y is fairly easy to achieve a dynamic vertical shift
- Even with this script Plotchar-How-to-draw-external-symbols-on-a-chart/ but would require to be updated with a label.new object and with a shape.none parameter so that we'll only see the icon/symbol displayed
- The colors also can be change dynamically using presets Presets-Selector-FRIDAY-NIGHT-CHALLENGE/ . If you have an indicator showing a BULLISH and a BEARISH signal, then you could, for instance, configure colors presets according to the timeframe of the chart or the indicator input, etc (sky is the limit ^^)
Be sure to hit the thumbs up at it motivates me to research what Pinescript can offer and share with the community
Dave
____________________________________________________________
- I'm an officially approved PineEditor/LUA/MT4 approved mentor on codementor. You can request a coaching with me if you want and I'll teach you how to build kick-ass indicators and strategies
Jump on a 1 to 1 coaching with me
- You can also hire for a custom dev of your indicator/strategy/bot/chrome extension/python
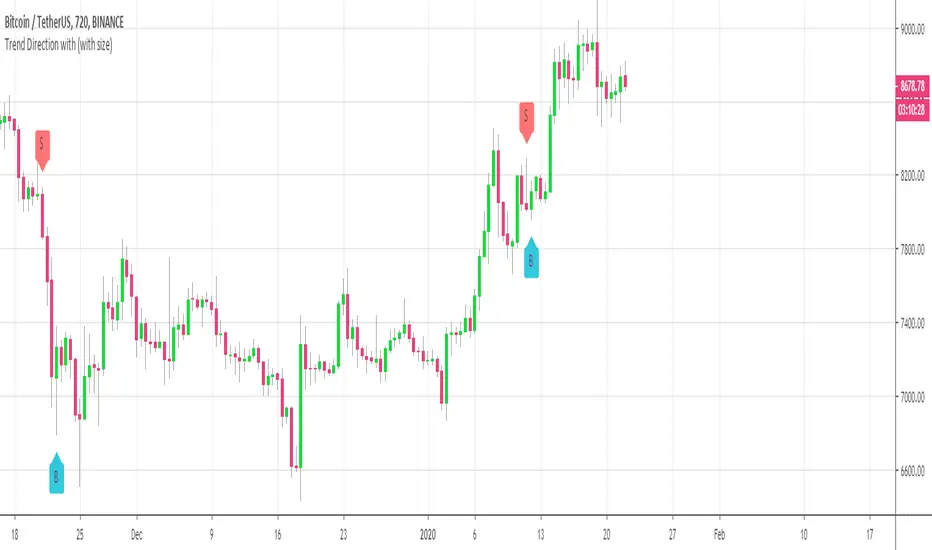
Customizable Trend DirectionHi everyone
Publishing this as a few clients want to try it out
It's basically a proof-of-concept to show that size and text can be manipulated :)
Size and text and label vertical position are udpatable
Will publish an open-source script today or tomorrow hopefully
Dave
420_MA_3 (3 moving average + custom ma + alerts) Three Moving Average System with Alerts
Saw a friend post a 3 ma script recently and I don't think it had this much functionality.
much love
gl hf
xoxo
snoop

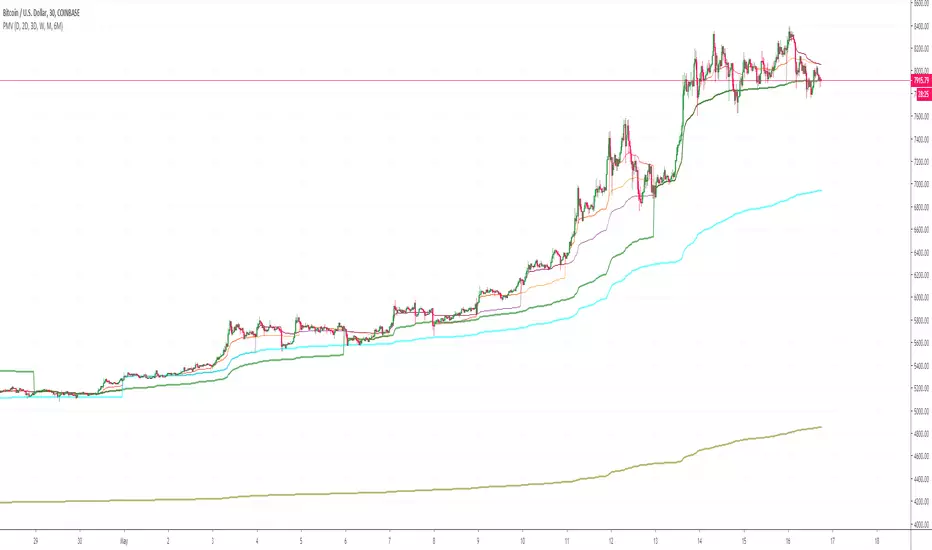
Perigraph's Customizable Multi VWAP LinesCustomizable Multi VWAP Lines
input examples:
30, 60, 120, 180, 240,360,480, 720 = minutes
D = Days
W = Weeks
M = months
12M = 12 Months
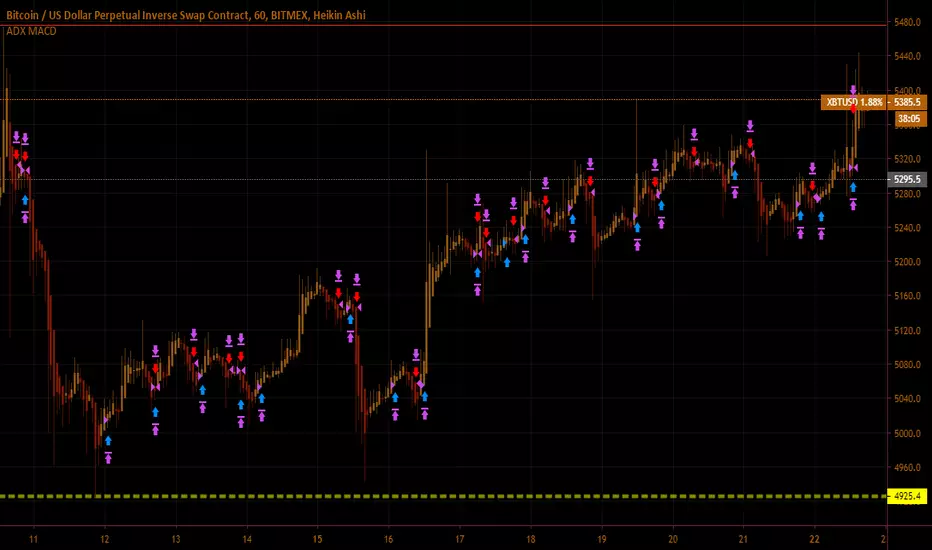
E-Z's Slither Maker Strategy v0.01This is a strategy I built based on custom MACD and ADX/DMI settings.
Works best for scalping the one hour.
If you run into any issues let me know.
If this script makes you money and feel thankful for all my hard work, you can donate to the addresses below <3
BTC: 3CS6VqDrCf7XRn46bqcXMUZQecbQJ7TKfs
BCC/BCH: bitcoincash:qqrca9z7w2gl2wevjvry6uv7quhcn7kaycx43r34tf
DOGE: AC9tZB6NMoWpvMZmmtop5yXsv7GhHYAxWd
LTC: 34HajDFE3aDWgs1etG3851CLvqNV9pg5Te
FREE TRADINGVIEW FOR TIMEFRAMESWhen doing i.e the 3 minute timeframe turn on the closest timeframe available for you or the candles and wicks will be fucked up.
So if you're doing the 5 hour timeframe candles turn on the 4hr chart on your main chart.
To View the candles in full screen double click the windows with the candlesticks
If you don't have TradingView premium and want to look at custom timeframes you can use this.
For the ticker/coin/pair you want to show enter it like this:
For stocks, only the ticker i.e: MSFT, APPL
For Crypto, "Exchange:ticker" i.e: BITFINEX:BTCUSD, BINANCE:AGIBTC, BITMEX:ADAM19
When setting up the timeframe write i.e:
For minutes/hourly: 5, 240 (4 hour), 360 (6 hour)
For daily/weekly/monthly: 1D, 2W, 3M
When doing i.e the 3 minute timeframe turn on the closest timeframe available for you or the candles and wicks will be fucked up.
So if you're doing the 5 hour timeframe candles turn on the 4hr chart on your main chart.

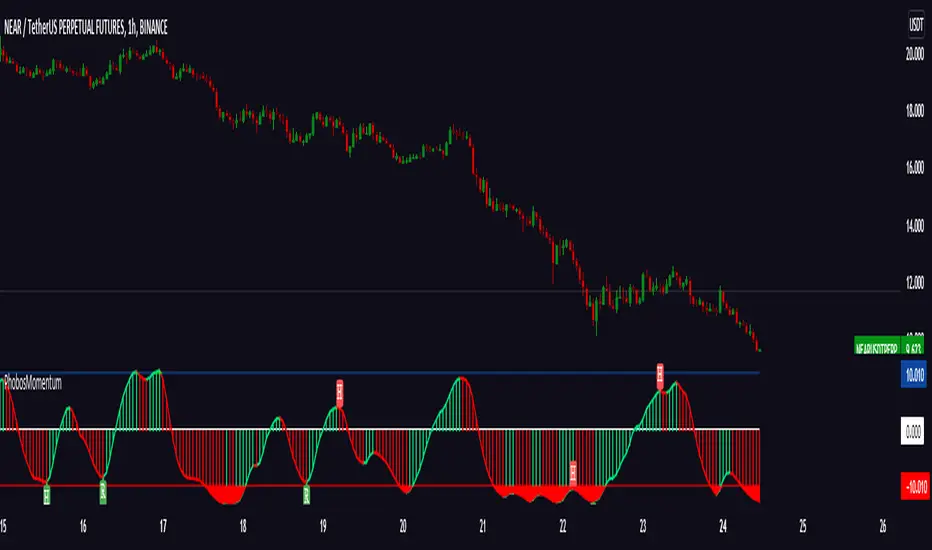
Momentum Oscillator Momentum Oscillator
Concept for this leading indicator presented in IFTA by By M.Fawzy.
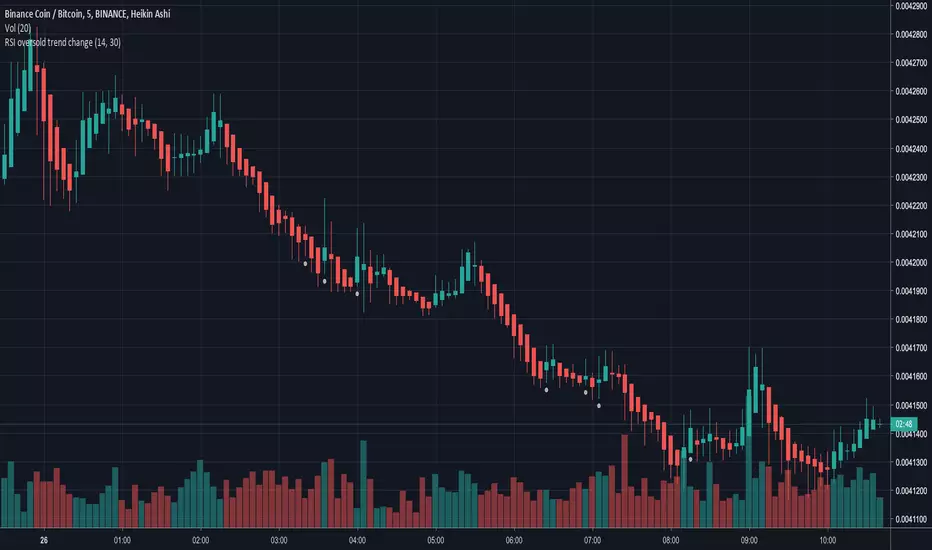
RSI oversold trend changeSimple script that will plot a circle indication on the chart when RSI returns above 30 from oversold position.
Also allows you to create a custom alert.
Custom Anchored VWAP Offset V2This is the anchored VWAP with offset option which can be used on any timeframe, including intraday.
