Opening Range & Prior Day High/Low [Gorb]Introduction:
Opening Range & Prior Day High/Low indicator is an easy to use day traders tool. This indicator automatically plots the previous days high and low, as well as drawing a box from the opening range that the user specifies in the settings. These two together can help provide an indication of market sentiment and price trends for the day. They are often used as a trading strategy for day traders.
Overview:
The Opening Range , draws a box from the high to the low of the user defined time period and is extended until the end of the trading session. Most common are the 5/15/30min opening ranges.
Prior Day High/Low , draws lines from the previous days high and low that extend across the current session. These are used as support/resistance and also a marker to see market sentiment by crossing one of these levels.
The indicator is designed for all kinds of traders, offering a simple approach to automatically plot levels for you.
Features:
All skill-level friendly presets, easy to enable with one-click
Opening Range: Allows user to choose what time the range starts and ends to measure the high & low.
Extend Range Lines: allows the user to choose when the box stops extending according to the trading session time.
Enable Opening Range Box: allows the user to choose to plot the opening range or not.
ORB Border Color: allows the user to change the box border color.
ORB Box Shade Color: allows the user to change the background of the opening range box.
ORB Line Width: allows users to chose the width of the opening range box lines.
Enable Previous Day High: allows users to enable the previous days high to be plotted.
Enable Previous Day Low: allows users to enable the previous days high to be plotted.
Previous Day High Color: allows users to choose the color for this line.
Previous Day Low Color: allows users to choose the color for this line.
All colors are changeable for the user to customize to their liking.
Usage Demonstration
In the image below, we can see a basic example of how these 3 features function.
As explained above, the opening range is customizable to meet the users needs and can be disabled with one click. Same goes for the prior day high(green) and low(red) lines. All 3 are plotted each day automatically for the user if enabled.
In the image below, we can see an example of using the opening range break and prior day high together for a trading strategy.
This is a great example of using the prior day high with the opening range to use as a day trading strategy. It provides the trader with levels to watch for price to break out from for possible trade setups.
In this next image, we can see a failed breakdown from the opening range that results in a bullish breakout.
The first move was a fake breakdown with the failed rejection on the retest of the opening range lows. This led to a breakout above the range and a confirmation bounce on the breakout retest. Price did break above the prior day high and confirmed with a retest bounce on that level as well.
In the image below, we can see how previous days levels can act as resistance to use with the opening range.
Price didn't reject the opening range low, but it did reject the prior day high for the second time. This could be used as an entry or once price breaks down out of the opening range again.
Conclusion:
We believe in providing user-friendly tools to help speed up traders technical analysis and implement easy trading strategies. The goal is to provide a user-friendly indicator to automatically draw opening ranges and previous days levels to suit the users needs and trading style.
RISK DISCLAIMER
All content, tools, scripts & education provided by Monstanzer or Gorb Algo LLC are for informational & educational purposes only. Trading is risk and most lose their money, past performance does not guarantee future results.
Daytrading

[AlbaTherium] OptiStruct™ Premium for Smart Money Concepts An Insight into Structure Mapping and Order Block Identification with Smart Money Concepts
Introduction:
Structure Mapping & Demands and Supplies Premium serves as a fundamental pillar in the realm of Smart Money Concepts . This indicator adeptly charts the market structure based on a refined version of SMC while identifying Order Blocks. All the concepts embedded in this method are meticulously defined, offering users the ability to chart the market structure with precision and heightened confidence. With this indicator, there is no need for excessive questioning of the accuracy of your markings; it diligently strives to perform this task effectively. There are no hidden 'magic' properties underlying this indicator, ensuring that our users can independently verify each and every feature. It is this commitment to transparency that sets us apart and makes us unique in the market.
In this discussion, we delve into the intricacies of Break of Structure, Change of Character , and SMART MONEY TRAP . We also introduce the concepts of Extreme Order Blocks, Decisional Order Blocks , and Smart Money Trap Order Blocks .
Chapter 1: Understanding Structure Mapping:
Let's begin with some definitions:
- Inside bars are candles that lie within the range of a preceding candle.
- Pullbacks occur in an uptrend when the low of a preceding candle's range (excluding inside bars ) is breached, and the price continues to rise.
- Inducements (IDM) are price levels defined as the low of the latest pullback before the most recent high. They often act as liquidity points that the market revisits before continuing its move.
Break of Structure (BoS):
In an uptrend, after surpassing an IDM , the most recent high becomes a Confirmed structure high, or a Major High . If the price then closes above this Major High, a Bullish Break of Structure (Bullish BoS) is confirmed. Similarly, the lowest point between these movements becomes a Confirmed structure low or Major Low in a downtrend.
Change of Character (ChoCh):
In an uptrend, if the price falls below a Major Low, it indicates a shift in market bias from Bullish to Bearish, or a Bearish Change of Character .
Example of a bullish ChoCh:
Chapter 2: The Significance of Order Blocks:
Order Blocks (OB) play a pivotal role in Smart Money Concepts during entry points. Understanding what they represent and how to identify them is essential. For a Bullish/Bearish Order Block to be confirmed, specific conditions, including price imbalance and breaching the previous candle's high or low, must be met. We will delve into the finer details of identifying and trading Order Blocks, with an emphasis on the fact that price often reacts from Decisional Order Blocks, Extreme Order Blocks , and Smart Money Trap Order Blocks .
An OB is the initial candle range of a pullback that creates a Fair value gap.
These are zones where proactive traders enter the market, resulting in significant price changes indicated by Fair value gaps. It is believed that when the price revisits these zones in the future, it tends to bounce back. This property makes Order Blocks excellent potential entry points.
Order Blocks are categorized as follows:
- Extreme OB : The first and lowest OB between the Major Low and Major High.
- Decisional OB : The most recent OB lower than the current IDM.
- Smart Money Traps : All OBs between Extreme and Decisional OB.
- Demand above IDM / Supply below IDM
Chapter 3: Understanding SMART MONEY TRAP (SMT):
SMART MONEY TRAP is a concept that brings clarity to the distinction between Structure and Order Blocks within Smart Money Concepts and is a unique feature of this indicator. While many Smart Money Traders base their trades on Structure and Order Blocks, it's crucial to recognize that Order Blocks serve as an additional confirmation for buy or sell decisions. Blindly trading based on Order Blocks is not advisable. Instead, traders should exercise patience and await other confirmations like inducement or Liquidity sweep before executing trades on Order Blocks. We will illustrate how this concept works in practice.
In the example above, the market made a high wick up, taking out the buy-side liquidity, then made a bearish ChoCh. We place our sell order on the order block above IDM. This presents a promising trading opportunity, with a stop loss placed above the OB and a take profit set at the low of previous structure.
Conclusion:
Structure Mapping & Demands and Supplies Premium as the epitome of Smart Money Concepts, presenting traders with a tool meticulously crafted for an exceptional user experience . This indicator integrates structural mapping and Order Blocks, providing not only a wealth of knowledge but a platform tailor-made for personalization to suit your unique style and preferences. By mastering the nuances of Impulsive Moves and Corrections, and expertly identifying and trading Order Blocks while considering the SMART MONEY TRAP, traders gain a distinct advantage in the ever-evolving financial markets.
This document serves as an enriching guide to Structure Mapping & Demands and Supplies Premium, accentuating its pivotal role within the Smart Money Concepts framework. We invite users to immerse themselves in an experience that transcends the ordinary, delving into the intricacies that define successful trading. As you navigate the complexities of the market, these detailed insights become your compass, providing a rich and customizable user experience that unlocks the full potential of Smart Money Concepts. Embrace these tools judiciously, and empower your daily analysis with a wealth of information that truly holds its weight in gold.

Swing based support and resistanceThis indicator provided here is for identifying swing-based support and resistance levels. It uses two swing lengths, which can be adjusted by the user, to identify swings in the price data. For each swing length, the script calculates the support level as the low of the swing if the trend is up, or the high of the swing if the trend is down. It then plots the support and resistance levels on the chart, along with buy and sell signals.
The buy and sell signals are generated by comparing the current closing price to the support and resistance levels. If the closing price is above the support level, the script plots a buy signal. If the closing price is below the level, the script plots a sell signal.
To use the script, you would first need to add it to your trading platform. Once it is added, you can configure the swing lengths and other parameters to suit your trading style. You can then apply the script to a chart and begin using the support and resistance levels and buy and sell signals to make trading decisions.
Points to be noted while using the indicator:
# The script is designed to be used on a daily chart. However, you can also use it on other timeframes, such as weekly or monthly charts.
# The swing lengths that you choose will depend on your trading style. If you are a swing trader, you may want to use longer swing lengths. If you are a day trader, you may want to use shorter swing lengths.
# Remember, the support and resistance levels generated by the script are not exact price points. They are rather zones where demand and supply can change. Therefore, you should always use other technical analysis tools and indicators to confirm your trading decisions.
# Overall, the script is a useful tool for identifying swing-based support and resistance levels. It can be used by traders of all experience levels to generate trading ideas and improve their trading performance.
To use the swing-based support and resistance indicator with respect to price, you can follow these steps:
=> Identify the support and resistance levels that have been generated by the indicator.
=> Look for price action that is taking place near these levels.
=> If the price is above the level, look for bullish reversals or continuations.
=> If the price is below the level, look for bearish reversals or continuations.
For Example,
=> Bullish reversal: The price is above the level and forms a bullish candlestick pattern, such as a bullish hammer or engulfing pattern.
=> Bullish continuation: The price is above the level and bounces off of the level.
=> Bearish reversal: The price is below the level and forms a bearish candlestick pattern, such as a bearish hammer or engulfing pattern.
=> Bearish continuation: The price is below the level and rejects the level.
$$ You can also use the indicator to identify potential trading entry and exit points. For example, you could enter a long trade when the price breaks above a resistance level and exit the trade when the price retraces to the resistance level. Or, you could enter a short trade when the price breaks below a support level and exit the trade when the price rallies to the support level.
This swing-based support and resistance indicator is just one tool that you can use to trade. You should always use other technical analysis tools and indicators, such as price action and trend analysis, to confirm your trading decisions.
Additionally:
=> Be aware of the overall trend direction. If the trend is up, you should be looking for bullish reversals or continuations. If the trend is down, you should be looking for bearish reversals or continuations.
=> Use a stop loss order to limit your risk on each trade.
=> Consider using a position sizing strategy to manage your risk.
=> Do your own research and backtest any trading strategy before using it in a live trading environment.
Follow us for timely updates regarding future indicators and give it a like if you appreciate the indicator.

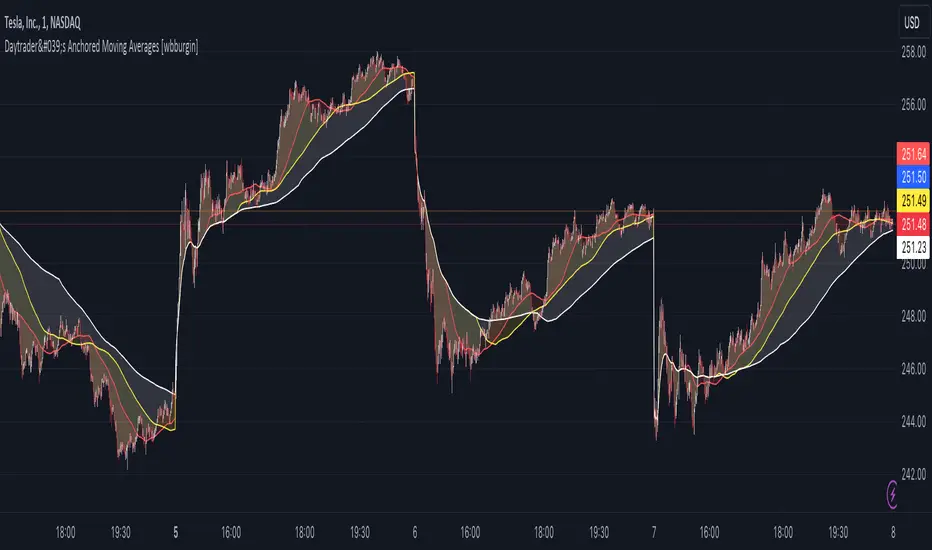
Day Trader's Anchored Moving Averages [wbburgin]For day traders, establishing a trend at the start of the day is critically important for setting targets and entering positions. This can be difficult when traditional moving averages lag from previous days, causing late entry and/or incorrect trend interpretation.
The Day Trader's Anchored MA indicator plots three dynamic moving averages which restart on each new period (session or monthly - more coming soon). This eliminates the lag in traditional moving averages while better identifying the trend, as the moving averages essentially 'build up' their lengths as the day progresses, until they reach your chosen maximum length.
This means that these anchored moving averages are
Quicker to identify the start-of-day trend, as markets tend to establish and then follow one trend throughout the day;
Dynamically increasing throughout the day (to your specifications)
Completely independent from previous days
Quick usage note: make sure that your moving average length is less than the number of bars in the period, or it won't reach the maximum length you specified.
TL;DR: Moving average that resets every day and does not lag. Inspired by the VWAP.
Intraday Volatility BarsThis script produce a volatility histrogram by bar with the current volatility overlayed.
The histogram shows cumulative average volatility over n days.
And the dots are todays cumulative volatility.
In other words, it calculates the True Range of each bar and adds it to todays value.
This script is build for intraday timeframes between one and 1440 minutes only.
I use this to show me when volatility is above/below/equal to the average volatility.
When the dots are above the histogram then it is a more volatile day, and vice versa.
Recognizing a more volatile day as early as possible can be an advantage for daytrader.
Days that start with higher volatility seems to continue to increase relative to the past few days. Or when midday volatility rises it seems to continue as well.
Happy Trading!

LNL Trend SystemLNL Trend System is an ATR based day trading system specifically designed for intra-day traders and scalpers. The System works on any chart time frame & can be applied to any market. The study consist of two components - the Trend Line and the Stop Line. Trend System is based on a special ATR calculation that is achieved by combining the previous values of the 13 EMA in relation to the ATR which creates a line of deviations that visually look similar to the basic moving average but actually produce very different results ESPECIALLY in sideways market.
Trend Line:
Trend Line is a simple line which is basically a fast gauge represented by the 13 EMA that can change the color based on the current trend structure defined by multiple averages (8,13,21,34 EMAs). Trend Line is there to simply add the confluence for the current trend. Colors of the line are pretty much self-explanatory. Whenever the line turns red it states that the current structure is bearish. Vice versa for green line. Gray line represents neutral market structure.
Stop Line:
Stop Line is an ATR deviaton line with special calculation based on the previous bar ATRs and position of the price in relation to the current and previous values of 13 EMA. As already stated, this creates an ATR deviation marker either above or below the price that trails the price up or down until they touch. Whenever the price comes into the Stop Line it means it is making an ATR expansion move up or down .This touch will usually resolve into a reaction (a bounce) which provides trade opportunities.
Trend Bars:
When turned ON, Trend Bars can provide additional confulence of the current trend alongside with the Trend Line color. Trend Bars are based on the DMI and ADX indicators. Whenever the DMI is bearish and ADX is above 20 the candles paint themselfs red. And vice versa applies for the green candles and bullish DMI. Whenever the ADX falls below the 20, candles are netural (Gray) which means there is no real trend in place at the moment.
Trend Mode:
There are total of 5 different trend modes available. Each mode is visualizing different ATR settings which provides either aggressive or more conservative approach. The more tigher the mode, the more closer the distance between the price and the Stop Line. First two modes were designed for slower markets, whereas the "Loose" and "FOMC" modes are more suitable for products with high volatility.
Trend Modes:
1. Tight
Ideal for the slowest markets. Slowest market can be any market with unusually small average true range values or just simply a market that does have a personality of a "sleeper". Tight Mode can be also used for aggresive entries in the most ridiculous trends. Sometimes price will barely pullback to the Trend Line not even the Stop Line.
2. Normal
Normal Mode is the golden mean between the modes. "Normal" provides the ideal ATR lengths for the most used markets such as S&P Futures (ES) or SPY, AAPL and plenty of other highly popular stocks. More often than not, the length of this mode is respected considering there is no breaking news or high impact market event scheduled.
3. Loose
The "Loose" mode is basically a normal mode but a little bit more loose. This mode is useful whenever the ATRs jump higher than usual or during the days of highly anticipated news events. This mode is also better suited for more active markets such as NQ futures.
4. FOMC
The FOMC mode is called FOMC for a reason. This mode provides the maximum amount of wiggle room between the price and the Stop Line. This mode was designed for the extreme volatility, breaking news events or post-FOMC trading. If the market quiets down, this mode will not get the Stop Line touch as frequently as othete modes, thus it is not very useful to run this on markets with the average volatlity. Although never properly tested, perhaps the FOMC mode can find its value in the crypto market?
5. The Net
The net mode is basically a combination of all modes into one stop line system which creates "the net" effect. The Net provides the widest Stop Line zone which can be mainly appreciated by traders that like to use scale-in scale-out methods for their trading. Not to mention the visual side of the indicator which looks pretty great with the net mode on.
HTF (Higher Time Frame) Trend System:
The system also includes additional higher time frame (HTF) trend system. This can be set to any time frame by manual HTF mode. HTF mode set to "auto" will automatically choose the best suitable higher time frame trend system based on how appropriate the aggregation is. For everything below 5min the HTF Trend System will stay on 5min. Anything between 5-15min = 30min. 30min - 120min will turn on the 240min. 180min and higher will result in Daily time frame. Anything above the Daily will result in Weekly HTF aggregation, above W = Monthly, above M = Quarterly.
Background Clouds:
In terms of visualization, each trend system is fully customizable through the inputs settings. There is also an option to turn on/off the background clouds behind the stop lines. These clouds can make the charts more clean & visible.
Tips & Tricks:
1. Different Trend Modes
Try out different modes in different markets. There is no one single mode that will fit to everyone on the same type of market. I myself actually prefer more Loose than the Normal.
2. Stop Line Mirroring
Whenever the Stop Lines start to mirror each other (there is one above the price and one below) this means the price is entering a ranging sideways market. It does not matter which Stop Line will the price touch first. They can both be faded until one of them flips.
3. Signs of the Ranging Market
Watch out for signs of ranging market. Whenever the Trend System looses its colors whether on trend line or trend bars, if everything turns neutral (gray) that is usually a solid indication of a range type action for the following moments. Also as already stated before, the Stop Line mirroring is a good sign of the range market.
4. Trailing Tool, Trend System as an Additional Study?
In case you are not a fan of the colorful green / red charts & candles. You can switch all of them off and just leave the Stop Line on. This way you can use the benefits of the trend system and still use other studies on top of that. Similarly as the Parabolic SAR is often used.
5. The Flip Setup
One of my favorite trades is the Flip Setup on the 5min charts. Whenever the Stop Line is broken , the very first opposing touch after the Trend System flips is a usually a highly participated touch. If there is a strong reaction, this means this is likely a beginning of a new trend. Once I am in the position i like to trail the Stop Line on the 1min charts.
Hope it helps.

Directional Movement Index FLEXA common problem experienced by short term traders using DMI/ADX is that the session breaks results in carry-over effects from the prior session. For example, a large gap up would result in a positive DMI, even though momentum is clearly negative. Note the extremely different results in the morning session, when the gap is reversed.
The DMI-FLEX algoritm resets the +DI and -DI values to the prior session ending midpoint, so that new momentum can be observed from the indicator. (Note for Pinescript coders: rma function does not accept series int, thus the explicit pine_rma function)
DMI-FLEX has the added feature that the ADX value, instead of a separate line, is shown as shading between the +DI and -DI lines, and the color itself is determined by whether +DI is above -DI for a bullish color, or -DI is above +DI for a bearish color.
DMI Flex also gives you the flexibility of inverse colors, in case your chart has inverted scale.
Summary and How to use:
1) Green when +DI is above -DI
2) Red when -DI is above +DI
3) Deeper shading represents a higher ADX value.

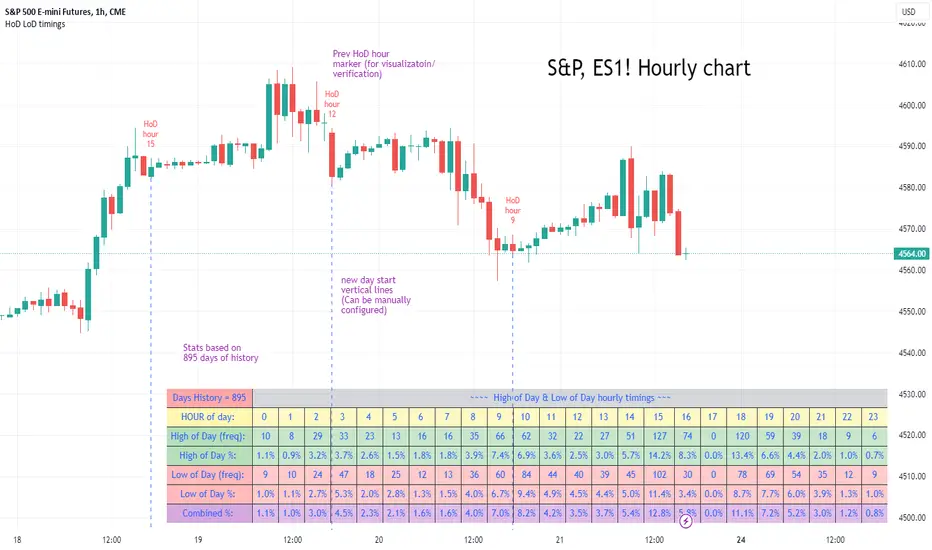
High of Day Low of Day hourly timings: Statistics. Time of day %High of Day (HoD) & Low of Day (LoD) hourly timings: Statistics. Time of day % likelihood for high and low.
//Purpose:
To collect stats on the hourly occurrences of HoD and LoD in an asset, to see which times of day price is more likely to form its highest and lowest prices.
//How it works:
Each day, HoD and LoD are calculated and placed in hourly 'buckets' from 0-23. Frequencies and Percentages are then calculated and printed/tabulated based on the full asset history available.
//User Inputs:
-Timezone (default is New York); important to make sure this matches your chart's timezone
-Day start time: (default is Tradingview's standard). Toggle Custom input box to input your own custom day start time.
-Show/hide day-start vertical lines; show/hide previous day's 'HoD hour' label (default toggled on). To be used as visual aid for setting up & verifying timezone settings are correct and table is populating correctly).
-Use historical start date (default toggled off): Use this along with bar-replay to backtest specific periods in price (i.e. consolidated vs trending, dull vs volatile).
-Standard formatting options (text color/size, table position, etc).
-Option to show ONLY on hourly chart (default toggled off): since this indicator is of most use by far on the hourly chart (most history, max precision).
// Notes & Tips:
-Make sure Timezone settings match (input setting & chart timezone).
-Play around with custom input day start time. Choose a 'dead' time (overnight) so as to ensure stats are their most meaningful (if you set a day start time when price is likely to be volatile or trending, you may get a biased / misleadingly high readout for the start-of-day/ end-of-day hour, due to price's tendency for continuation through that time.
-If you find a time of day with significantly higher % and it falls either side of your day start time. Try adjusting day start time to 'isolate' this reading and thereby filter out potential 'continuation bias' from the stats.
-Custom input start hour may not match to your chart at first, but this is not a concern: simply increment/decrement your input until you get the desired start time line on the chart; assuming your timezone settings for chart and indicator are matching, all will then work properly as designed.
-Use the the lines and labels along with bar-replay to verify HoD/LoD hours are printing correctly and table is populating correctly.
-Hour 'buckets' represent the start of said hour. i.e. hour 14 would be populated if HoD or LoD formed between 14:00 and 15:00.
-Combined % is simply the average of HoD % and LoD %. So it is the % likelihood of 'extreme of day' occurring in that hour.
-Best results from using this on Hourly charts (sub-hourly => less history; above hourly => less precision).
-Note that lower tier Tradingview subscriptions will get less data history. Premium acounts get 20k bars history => circa 900 days history on hourly chart for ES1!
-Works nicely on Btc/Usd too: any 24hr assets this will give meaningful data (whereas some commodities, such as Lean Hogs which only trade 5hrs in a day, will yield less meaningful data).
Example usage on S&P (ES1! 1hr chart): manual day start time of 11pm; New York timezone; Visual aid lines and labels toggled on. HoD LoD hour timings with 920 days history:
Pro ScalperOverview
The Pro Scalper indicator is a powerful day trading tool designed specifically for the 30-minute timeframe, catering to stock and cryptocurrency markets. It provides traders with buy and sell signals, dynamic overbought/oversold zones, and reversal signal indicators. By combining a Kalman-adapted Supertrend calculation for buy and sell signals, and VWMA bands to determine overbought/oversold zones, this indicator aims to assist traders in identifying potential trading opportunities for scalping and day trading strategies using trend-following and mean-reverting methods. This combination of Kalman Filtering with an adapted Supertrend seeks to mitigate false signals, filter out market noise, and aims to provide traders with more reliable buy and sell indications.
Features
Buy and Sell Signals: Pro Scalper generates buy and sell signals based on a Kalman-adapted Supertrend calculation. These signals help traders identify potential entry and exit points in the market.
Dynamic Overbought/Oversold Zones: The indicator dynamically calculates overbought and oversold zones using VWMA bands. These zones provide valuable insights into potential price exhaustion levels, aiding traders in managing risk and identifying potential reversals.
Reversal Signals (R Labels): The indicator includes "R" labels that indicate potential reversal signals. These signals are based on the overbought/oversold zones calculated with VWMA bands. The appearance of an "R" label suggests a possible price reversal, offering traders an additional tool for decision-making.
Calculations
This indicator stands out as a unique tool due to unique Kalman filtering and altered Supertrend calculation, as well as its combination of specific features. This indicator combines the following calculations to provide its features:
Kalman Filter: The indicator employs a Kalman Filter to adapt the Supertrend calculation. This calculation was based on mathematical equations derived from Rudolf E. Kalman. This Kalman Filter helps smooth out price data, reducing noise and removing outliers from data.
Supertrend Calculation: This particular supertrend possesses alterations to price series data and ATR calculations in an aim to improve signal accuracy. Additionally, the calculation uses Kalman-filtering within the calculation to provide a powerful framework to handle uncertainties, noise, and changing conditions.
VWMA Bands: VWMA (Volume-Weighted Moving Average) bands are calculated using the highest high and lowest low values with specified multipliers. These bands are used to determine the dynamic overbought and oversold zones, giving traders insights into potential price exhaustion levels. These are included with the aim to adapt to changing market conditions and price data. This adaptability allows the zones to accurately reflect the current price volatility and trend.
Utility
This tool provides traders with valuable information for scalping and day trading strategies in the 30-minute timeframe. It helps traders by:
Generating buy and sell signals, indicating potential entry and exit points.
Calculating dynamic overbought/oversold zones, enabling traders to identify potential price exhaustion levels.
Displaying "R" labels to highlight potential reversal signals.
Offering optional alerts for reversal signals, buy/sell signals, allowing traders to stay updated even when they're not actively monitoring the charts.
Remember, past performance does not guarantee future performance. Traders should utilize this indicator as part of a comprehensive trading strategy and exercise their own judgment when making trading decisions.

DJ Soori Trading StrategyThe strategy combines three indicators: Exponential Moving Average (EMA), Weighted Moving Average (WMA), and Average Directional Index (ADX).
The EMA and WMA are used to track the average price over different time periods.
The ADX measures the strength of a trend in the market.
The strategy generates buy signals when the EMA is higher than the WMA and the ADX is above a certain threshold. It suggests a potential uptrend.
It generates sell signals when the EMA is lower than the WMA and the ADX is above the threshold. It suggests a potential downtrend.
The strategy also considers whether the ADX is rising or falling to indicate the strength of the trend.
The EMA, WMA, and ADX values are plotted on the chart.
Buy and sell signals are shown as labels on the chart, indicating "Buy (Strong)" or "Buy (Weak)" for buy signals, and "Sell (Strong)" or "Sell (Weak)" for sell signals.

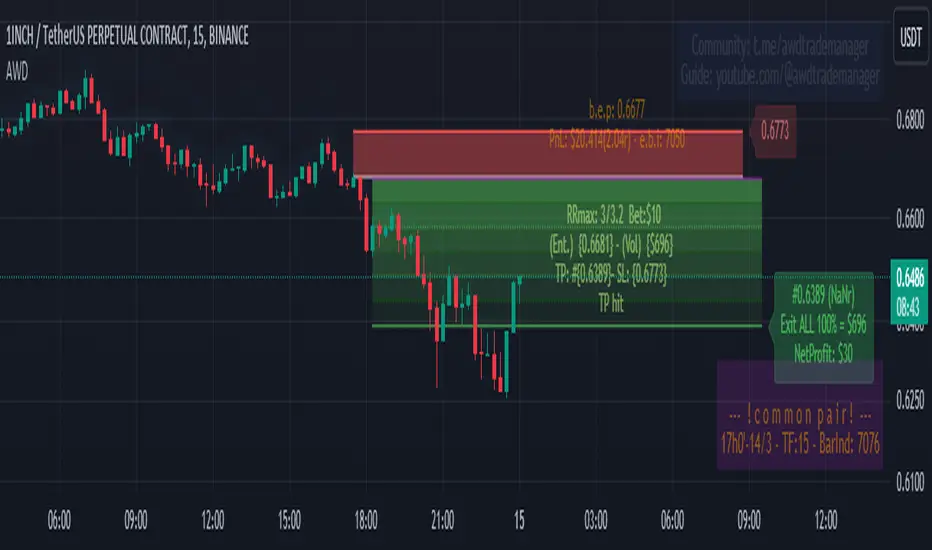
AWD TRADE MANAGER (ATM) by ManhDNAWD TRADE MANAGER (ATM) is a position management tool including with some advanced features and entry suggestions. It helps you to do most of position calculations and position management, reduce time spent for charting by alerts.
There are 3 main things to describe about the manager:
(1) The original function of the manager is to help traders to manage their trades with automatic calculations of all factors of their trades with some of input values. For example, it will calculate the trade volume when you enter the bet size, entry and stop loss price. It calculates take profit price when you enter entry, stop loss prices and the risk/reward ratio, …
(2) Another function is the system of alerts. After set up a trade, create an alert and the manager will do the rest. It will send you an alert when the limit order got filled, got stopped out, take profit level hit, or even it reached a key level or an opposite/spike move just occurred…
(3) Entry suggestions: Suggest entries with price action strategies. Details bellow.
Features in details:
(1) Automatic calculations:
- Auto calculate trade volume based on entry, stop loss prices and the money users willing to lose when the trade is failed. Auto detect some type of assets and volume will be calculated in USD (for cryptocurrencies) or in lot (for forex).
- Auto calculate take profit price based on entry, stop loss prices and expected rr ratio.
-Auto suggest take profit price based on pivot points.
- Auto suggest stop loss price based on pivot points.
- You can enter several exit points with percentages and the manager will calculate the averaged risk reward ratio you earned after the last exit price reached.
- Quick entry price pick to reduce typing requirement.
- Quick trade set up: 2 checkboxes and 1 number entering to set up a trade.
(2) Alert system
After setting up a trade and creating an alert of the manager, it will follow the market and your order. It will send you alerts for all the events that you should follow up your position. These alerts can be sent to your pc, your phone and your smart watch, so even you are a full-time day trader, you will save your time for charting or managing your positions. Here’s the list of alerts:
- Sending alert when suggesting an entry with details calculated from preset inputs so you can just pick that info to enter the position including trading volume, entry, stop loss, take profit prices, timeframe, estimated risk-reward ratio …
- Sending alert when a limit order got filled and auto switch to position-managing-mode.
- Sending alert when a limit order in still staying unfilled but should be canceled (because of price reaching a key level or is running too far, …)
- Sending alert when the position got stopped out or TP hit.
- Sending alert when the running position reached a key level and need to be watched out.
- Sending alert when a spike move or opposite move just occurred.
- Sending alert when a position is taking too long to run.
- You can also set 3 levels of price with messages then ATM will send you alerts when price reaches those levels.
- When price runs, ATM might suggest you to move stop loss to levels based on pivot points by sending you alerts.
- Alert when a BOS occurred.
- Options to turn on/off each kind of alert.
(3) Entry suggestions.
The script included price action entry suggestions.
The 1st strategy is getting in a position when a candle pattern occurred and confirmed by MA20.
The 2nd strategy is detecting double top/bottom and a candle pattern confirm break out after that.
The 3rd strategy is a pullback strategy, in a trending market, a candle pattern occurs and confirms the pullback ends, it will suggest an entry.
All those strategies I am using by myself for a long period of time but to make sure they are good for your trading style, do your own research and backtest before use. Keep in mind to manage risk and be responsible to your capital.
User side modifications:
- Those price action strategies have some major arguments that users can tune themselves to make it meet their style or their needs like choosing method to suggest entries, refine entry quality by changing the confirmation methods,…
- Most of appearance factors can be changed by users.
- one-click to toggle between full features and simple mode.
TradingView Chart demo pictures:
Author's bio:
I have been a full-time day trader for 7 years. I like coding with Pinescript and I also developed some helpful indicators that provide unique aspects to approach markets and the most favorite one from that is Relative Volume Index (RVI) that will be introduced in near future.
Disclaimer:
This tool has been tested and been using for my own trading career for a long period of time but practicing to use it yourself to understand it and use it correctly is needed. All of the features have been carefully tested before publishing but make sure to double-check all the info you get from it before getting into a trade to avoid losing money by a sudden mistake or even a bug. Keep in mind you will need to take all the responsibility with your capital or any potential loss while using this tool.
If you get anything wrong while using it, please leave some comments bellow, all of your ideas or suggestions will be taken seriously.
Thank you in advance!
(It is not possible to explain all the settings or features within the description, If you have questions, please leave comment, I will answer to help you to get familiar with the tool.)
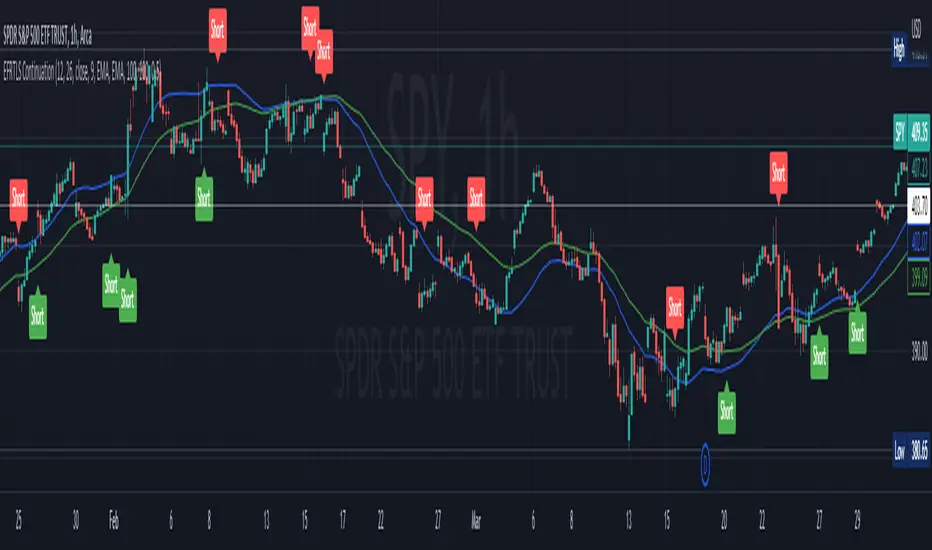
Effortless ContinuationIntroduction:
The Effortless Continuation Indicator is a technical analysis tool designed for traders to identify potential buy and sell signals in the market. This indicator combines three popular technical indicators - Moving Average Convergence Divergence (MACD), Triple Exponential Moving Average (TEMA), and Double Exponential Moving Average (DEMA) - to generate buy and sell signals. It is suitable for use on any time frame, from intraday trading to swing trading and longer-term investing.
Indicator Components:
The indicator comprises of three main components: MACD, TEMA, and DEMA.
Moving Average Convergence Divergence (MACD):
The MACD is a momentum indicator that measures the difference between two moving averages of the price of an asset. It is calculated by subtracting the 26-period Exponential Moving Average (EMA) from the 12-period EMA. The MACD line is used to identify changes in momentum, trends, and potential buy and sell signals.
Triple Exponential Moving Average (TEMA):
The TEMA is a type of Moving Average that takes multiple EMA values and applies a triple smoothing to them. This allows the TEMA to react more quickly to changes in price trends than traditional moving averages. The TEMA line is used as an additional confirmation for potential buy and sell signals.
Double Exponential Moving Average (DEMA):
The DEMA is similar to the TEMA but applies double smoothing to the EMA values. It is used as a signal line to confirm buy and sell signals generated by the MACD and TEMA.
Signal Generation:
The Effortless Continuation Indicator generates buy and sell signals based on the crossover and crossunder of the MACD and DEMA lines, as well as the price being above or below the TEMA line. Long signals are generated when the MACD crosses above the DEMA and the price is above the TEMA. Short signals are generated when the MACD crosses below the DEMA and the price is below the TEMA.
Chop Sensitivity:
The indicator has a user-adjustable "Chop Sensitivity" setting, which allows traders to adjust the ATR sensitivity for long and short signals. ATR is a volatility indicator that measures the average range of price movements over a given period of time. The default value is set to 0.5 ATR, which means that long and short signals will not be generated if the price is within 0.5 ATR of the TEMA.
Alerts:
The Effortless Continuation Indicator has built-in alerts for both long and short signals. It also includes a single alert that will trigger for both long and short signals. This allows traders to stay informed of potential trading opportunities even when they are not actively monitoring the markets.
Conclusion:
The Effortless Continuation Indicator is a powerful technical analysis tool that can help traders identify potential buy and sell signals in the market. It is easy to use and can be customized to suit individual trading styles and preferences. It is important to note that this indicator does not predict the market, but rather provides potential signals that should be confirmed with additional technical and fundamental analysis. With its advanced signal generation and alert features, the Effortless Continuation Indicator can be a valuable addition to any trader's toolbox.
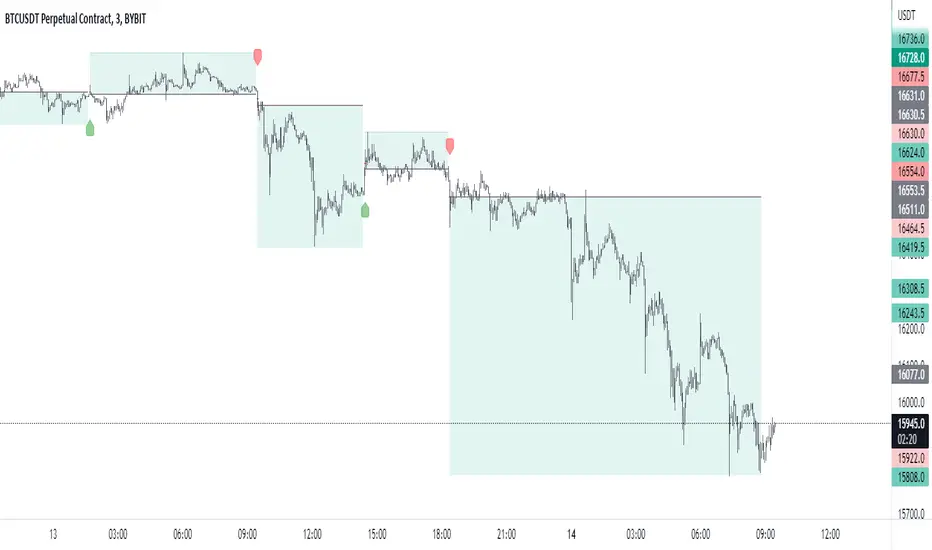
Typical Sweeps: Pivot high/low boxes. Grade sweeps, Handles/PipsTool to show typical pip-grade/ handle-grade sweep distance above pivot highs and pivot lows
-In consolidation/ranging periods (i.e. most of the time); Highs/Lows may by swept by fairly consistent distances in typical stop raids.
-Idea is from ICT teaching on typical Pip-grade sweeps in FX (10,20,30pips). Designed to work on FX, Indices, Commodities, Bitcoin.
-Above chart shows S&P; sweeping below and then above by 5 handles.
///inputs///
~choose sweep distance handles ($) or pips: will auto-calculate depending on the asset: FX= pips; Indices/stocks/commodities = handles ($)
--(2,5,10,20,30,50,100, 500, 1000)
~choose pivot lookback: larger number for more significant swing highs/lows
~choose number of historical boxes to display
~toggle on/off Pivot high boxes and Pivot low boxes independently
~extend boxes fully to the right (default is not extend)
~toggle on/off text
~text & box formatting options
Bitcoin, hourly chart; Pivot lookback = 15; $100 sweep boxes:
Eur/Usd; 15m chart; Pivot lookback = 30; 10pip sweep boxes; Boxes extended fully to the right:

TUE Argentum Algo V1This algorithm is designed to look trend for opening conditions, apply various filters including volume and volatility, then determine stop outs, break evens, and take profits.
The algorithm uses proprietary math based on the concepts of volatility, standard deviations, average true ranges, and volume to help determine trend. You can filter based on cumulative volume delta, volatility, and moving average based trend. It includes settings for either trend following or contrarian trades, and the ability to go long, short, or both.
The take profit areas are based on proprietary math that help find peaks and valleys. You can adjust the size of the take profits as a percentage of the position, change to static take profits (i.e. take profit in 16 ticks), or use both. You can also disable them and use the natural closing conditions of the trades (detection of trend change in the opposite direction).
Our algo works in any market and will allow user to adjust input settings to be used on any ticker they'd like. It is built as a strategy so you can back test on any ticker to find the exact right settings to dial it in and then switch to live trading mode to see signals. Can be used for day trades or swing trades.
Automated Trading
This algo has been tested and certified to work for automated trading.
Works on Forex
It's confirmed to work on forex so you can trade that market.
Gets you into long successful trades, and gets out of poor ones quickly
It keeps you in the long trades taking small profits along the way, but cuts losers quickly in comparison. This style leads to a high profit factor.
It looks at many variables so you don't have to
- Uses trend analysis for opening/closing conditions.
- It measures the strength of trends to help determine if it should enter or not.
- It uses volume, if the user wants, to help filter entries. The volume calculation is based off of my proprietary cumulative volume delta indicator and helps find if the volume is moving long or short.
- It uses proprietary take profit math to help find peaks and valleys to peel off profits. It is based on the changes in momentum of the underlying.
- It allows for stop outs and break evens based on volatility so they'll always adjust with the movement of the underlying ticker (see the blue lines above and below the opening in the chart).
- It allows for offset break evens to keep a portion of the profit.
Strategy for the Algo
Included so you can understand how to trade with it.
ONE: After loading this strategy onto a ticker turn off volume if it's a ticker with no volume , set the dates at the bottom to when the stock is active (you want to start backtesting when a stock started trading like it trades currently).
TWO: From there adjust the short term trend settings to find the highest win rate and profit factor.
THREE: Then adjust the volume length to find the highest win rate and profit factor. It's important while doing these that you pay attention to a smooth upward equity curve.
FOUR: After this has been done now adjust the long and short risk multipliers. This determines your stop out.
FIVE: Then adjust breakeven multipliers - this is the level at which it changes to a breakeven stop out instead of the previous one. You can also set an offset to keep a small part of the profit.
SIX: Finally adjust the take profit sizes.
SEVEN: Once this is all done go back through the list and adjust up and down by one or two clicks and see if a better curve can be obtained. Very frequently long and short trades have different settings.
EIGHT: When you are finished save the settings in a custom indicator template and put it with it's own chart.
Additional
The settings shown on screen are not the default settings, but are settings chosen for this ticker and timeframe based on the process above. Nearly every ticker and timeframe will require adjustment from default, that's why the algorithm is built to be highly flexible. It can fit any ticker and timeframe, as well as market environment.
This particular setup has the algo running a scalping program on ES 3 min with a 16 tick static target. This algorithm can be set up as a scalper, or used to day trade more regularly. It can also swing trade.
As shown here the algo includes $1.25 of commissions and 1 tick of slippage on all orders (about our average for automated trading on ES).

TUE ADX/MACD Confluence Algorithm V1This algorithm is designed to look at the ADX/MACD confluence for opening conditions, apply various filters including volume and volatility, then determine stop outs, break evens, and take profits.
The ADX and MACD confluence can be a powerful predictor in stock movements. Both of these indicators find trend but do it in different ways. When they're combined they have a high success rate of finding openings. That's done by finding the bar in which both show the same direction - that bar is the beginning of the confluence. I have a free indicator called the TUE ADX/MACD Confluence that you can use to see this in action.
This script will help you find those confluences in an easy to understand manner. It will open a trade on a detected confluence, using the rest of the variables available in the algorithm as filters. You can filter based on cumulative volume delta, volatility, and trend. It includes settings for either trend following or contrarian trades, and the ability to go long, short, or both.
It includes Buy and Sell signals for detected confluences, and will show colored candles to help you determine when to exit a trade if you don't want to follow the included take profit areas. When the candles turn to white that means the detected confluence is no longer in play. The Buy and Sell signals will display on the first occurrence of each confluence.
The take profit areas are based on proprietary math that help find peaks and valleys. You can adjust the size of the take profits as a percentage of the position, change to static take profits (i.e. take profit in 16 ticks), or use both. You can also disable them and use the natural closing conditions (reversal of MACD/ADX confluence).
Our algo works in any market and will allow user to adjust input settings to be used on any ticker they'd like. It is built as a strategy so you can back test on any ticker to find the exact right settings to dial it in and then switch to live trading mode to see signals. Can be used for day trades or swing trades.
Automated Trading
This algo has been tested and certified to work for automated trading.
Works on Forex
It's confirmed to work on forex so you can trade that market.
Gets you into long successful trades, and gets out of poor ones quickly
It keeps you in the long trades taking small profits along the way, but cuts losers quickly in comparison. This style leads to a high profit factor, as you can see over 3.0 in the included ES 3 Min chart.
It looks at many variables so you don't have to
- Uses ADX/MACD confluence for opening/closing conditions.
- It uses volume, if the user wants, to help filter entries. The volume calculation is based off of my proprietary cumulative volume delta indicator and helps find if the volume is moving long or short.
- It uses proprietary take profit math to help find peaks and valleys to peel off profits. It is based on the changes in momentum of the underlying.
- It allows for stop outs and break evens based on volatility so they'll always adjust with the movement of the underlying ticker (see the blue lines above and below the opening in the chart).
- It allows for offset break evens to keep a portion of the profit.
Strategy for the Algo
Included so you can understand how to trade with it.
ONE: After loading this strategy onto a ticker turn off volume if it's a ticker with no volume , set the dates at the bottom to when the stock is active (you want to start backtesting when a stock started trading like it trades currently).
TWO: From there adjust the ADX/MACD to find the highest win rate and profit factor.
THREE: Then adjust the volume length to find the highest win rate and profit factor. It's important while doing these that you pay attention to a smooth upward equity curve.
FOUR: After this has been done now adjust the long and short risk multipliers. This determines your stop out.
FIVE: Then adjust breakeven multipliers - this is the level at which it changes to a breakeven stop out instead of the previous one. You can also set an offset to keep a small part of the profit.
SIX: Finally adjust the take profit sizes.
SEVEN: Once this is all done go back through the list and adjust up and down by one or two clicks and see if a better curve can be obtained. Very frequently long and short trades have different settings.
EIGHT: When you are finished save the settings in a custom indicator template and put it with it's own chart.
Additional
The settings shown on screen are not the default settings, but are settings chosen for this ticker and timeframe based on the process above. Nearly every ticker and timeframe will require adjustment from default, that's why the algorithm is built to be highly flexible. It can fit any ticker and timeframe, as well as market environment.
Also included in the chart above is a $1.25 commission per contract, and a tick of slippage (which on average is about right for automated trading on ES).

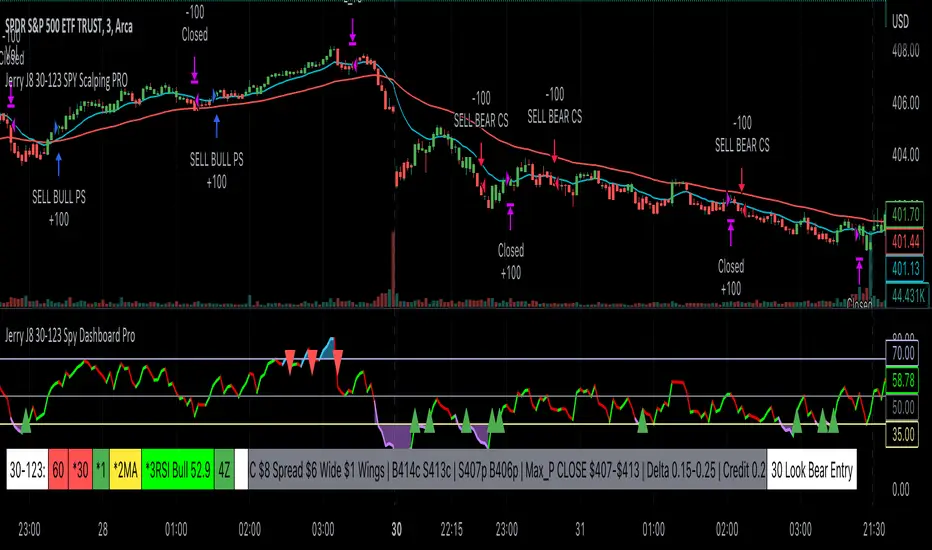
Jerry J8 30-123 Spy Dashboard ProPlease watch the J8 Scalping Tutorial Video below for a walkthrough on how these indicators work.
This script is used in conjunction with Jerry J8 30-123 SPY Scalping PRO” Indicator(which creates the buy and sell orders as a strategy). The Dashboard shows the 4 main criteria statuses from the strategy. I find the dashboard makes scalping the SPY much easier.
This study project is designed for scalping options that expire daily with bull put and bear call credit spreads on a 3 minute chart. The name 30_123 is a reference to 4 main criteria being met to give a green light for a potential trade. The criteria:
* 30 = 30 minute trend
* 1 = 3 minute trend
* 2 = Moving average criteria
* 3 = RSI criteria
4 = Secondary trend. Bonus if in sync but not a requirement.
* The strategy also utilizes momentum as a criteria but this is not shown on the dashboard.
This indicator is designed to trade options that expire daily including the SPY, IWM, QQQ, and NDX. However, it can be used with multiple symbols on a 3 minute chart.
When the 30_123 conditions are all green with all criteria are met a bull signal is created.
When the 30_123 conditions are all red with all criteria are met a bear signal is created.
This study is the dashboard that is designed to show how the main J8 strategy indicator is working and it shows which criteria have been met. Additionally there are multiple user INPUTS that you can adjust for the 4 main criteria plus inputs to help you with your credit spread criteria.
For example, if the SPY is at 400 we could have an order to sell a BULL PUT CREDIT SPREAD and I would likely sell the 398p and buy the 397p; The 398p delta would be approximately -.2. The spread position profits with any close over 398 and/or can be closed early with a bullish price move. IMPORTANT: If the SPY closed the day at $399 on the chart it would look like a loss based on the buy and sell orders but the spread would be a full profit since the close was above 398.
---- IRON CONDOR
For the SPY ticker only an iron condor label is generated when the SPY is trading sideways and meets specified criteria. When the criteria is met the Iron Condor label appears and it provides a recommendation for what option to buy and sell. The iron condor recommendations can be adjusted with user inputs.
This Indicator dashboard shows the criteria labels and colors the criteria as green if bullish and red if bearish. When the criteria are not met the dashboard shows “NO CLEAR SIGNAL”. There is also a label that shows whether you are looking for bullish or bearish positions based on the 30 minute trend.
The chart shown on the indicator is the RSI and for this indicator an RSI over 50 is bullish and under 50 is bearish. The line color shows the RSI trend. RSI OB (overbought) and OS (oversold) areas are shaded. The RSI can remain in an OB or OS state for a prolonged period and while some people use OB and OS as a reversal signal I use it as a strong trend indication and recognize it will not last forever. You can SET the OB and OS levels with inputs.
---- USER INPUTS
Paint Bars: Turns on/off the candle coloring. Default is OFF.
Iron Condor Settings: Defaults are what I use and can be used as a guide.
Criteria: Trend, moving averages, and RSI settings can all be adjusted.
---- SETUP & HINTS
Add "Jerry J8 30-123 SPY Scalping PRO” indicator to show bull and bear signals
Add "Jerry J8 MACD Optimal Entry Zone” indicator to show best MACD range for entry
I also like to add "Jerry Momentum Dream" indicator to see the momentum
With this indicator we’re looking for the 30, 1, 2, and 3 criteria to be met which increases our likelihood of success. IMPORTANT. Never automatically enter a position without reviewing the other indicators and drawing your own conclusions. You want to choose the entries that are the most appealing to you that take into account volume, time of day, and risk/reward. Positions should be closed based on your risk/reward goals.
Indicators are not a magic pill and should be used to support trading decisions, not to make them for you. Past performance is not a guarantee of future returns. The results of individual stocks/indexes with any strategy do not constitute proof they will repeat in the future.
DISCLAIMER: The information contained in our scripts/indicators/ideas does not constitute financial advice or a solicitation to buy or sell any securities of any type. Trading and investing in the stock market and cryptocurrencies involves substantial risk of loss and is not suitable for every investor. I’m NOT a financial adviser. All trading strategies are used at your own risk.
Please Use the AUTHOR’s INSTRUCTIONS link below for more information.
NOTE: The PERFORMANCE SUMMARY below does not accurately reflect the trading strategy because the entry orders generated in the strategy are based on the stock price and our actual order is a credit spread that is profitable even if the price moves against us a little bit. What could show as a loss in the strategy could be a profit in the credit spread.

Jerry J8 30-123 SPY Scalping PROPlease watch the J8 Scalping Tutorial Video below for a walkthrough on how these indicators work.
---- STRATEGY
This study project is designed for scalping options that expire daily with bull put and bear call credit spreads on a 3 minute chart. The name 30_123 is a reference to 4 main criteria being met to give a green light for a potential trade. The 4 main criteria:
*30 = 30 minute trend
*1 = 3 minute trend
*2 = Moving average criteria
*3 = RSI criteria
4 = Secondary trend. Bonus if in sync but not a requirement.
* The strategy also utilizes momentum as a criteria.
This indicator is designed to trade options that expire daily including the SPY, IWM, QQQ, and NDX.
When 30_123 conditions are all green and all criteria are met a bull signal is created.
When 30_123 conditions are all red and criteria are met a bear signal is created.
The bull and bear signals are based on the stock/index price; BUT the actual orders are for option spreads that are normally based on a delta of approximately .15 to .25.
For example, if the SPY is at 400 we could have an order to sell a BULL PUT CREDIT SPREAD and I would likely sell the 398p and buy the 397p; The 398p delta would be approximately -.2. The spread position profits with any close over 398 and/or can be closed early with a bullish price move. IMPORTANT: If the SPY closed the day at $399 on the chart it would look like a loss based on the buy and sell orders but the spread would be a full profit since the close was above 398.
This script is used in conjunction with Jerry J8 30-123 Spy Scalping Dashboard Pro indicator which is the dashboard to give a visual for the 4 main criteria and makes things easier to understand.
---- TRADING TIME FRAME
The default time frame is 10:00 - 15:57 and can be controlled by the user. I do not enter trades in the first 30 minutes since that can be a very volatile period and you can easily configure the indicator and trading time frame based on how you trade.
---- MAJOR USER INPUTS
Paint Bars: Turns on/off the candle coloring for the trend
Exits: Open orders can be closed with 3 different exit criteria and all should be left on. These exits are needed to provide multiple entry signals throughout the day. However, you want to close the spreads based on your own criteria and not on the indicator.
Criteria: Trend, moving averages, RSI settings, and trading time frames can all be adjusted.
---- SETUP & HINTS
Add "Jerry J8 30-123 Spy Scalping Dashboard Pro” indicator to show J8 criteria dashboard
Add "Jerry J8 MACD Optimal Entry Zone” indicator to show best range of entry
I also like to add "Jerry Momentum Dream" indicator to see the momentum
With this indicator we’re looking for the 30, 1, 2, and 3 criteria to be met which increases our likelihood of success. IMPORTANT. Never automatically enter a position without reviewing the other indicators and drawing our own conclusions. You want to choose the entries that are the most appealing to you that take into account volume, time of day, and risk/reward. Positions should be closed based on your risk/reward goals.
Indicators are not a magic pill and should be used to support trading decisions, not to make them for you. Past performance is not a guarantee of future returns. The results of individual stocks/indexes with any strategy do not constitute proof they will repeat in the future.
DISCLAIMER: The information contained in our scripts/indicators/ideas does not constitute financial advice or a solicitation to buy or sell any securities of any type. Trading and investing in the stock market and cryptocurrencies involves substantial risk of loss and is not suitable for every investor. I’m NOT a financial adviser. All trading strategies are used at your own risk.
Please Use the AUTHOR’s INSTRUCTIONS link below for more information.
NOTE: The PERFORMANCE SUMMARY below does not accurately reflect the trading strategy because the entry orders generated in the strategy are based on the stock price and our actual order is a credit spread that is profitable even if the price moves against us a little bit. What could show as a loss in the strategy could be a profit in the credit spread.
BE - Pr_DayLowHigh_BreakoutScreener AlgoHerewith presenting the Screener based indicator which supports Algo trade on the NSE stocks. The idea behind this indicator is when the Current day stock breaks out of Yesterday's high or Low with promising volumes (Using MA's and POC of Volume Profile) along with formation of candle Pattern. Initiates the Trade entries.
Note: Indicator is designed to take an entry even before the candle is closed as soon as the entry level is crossed and it shall exit the trade as soon as the SL is hit even before candle is close.
How to Work with this Indicator.
You can map up to 15 Scripts in this indicator. However you may decide if you wish to load all 15 are few of them. if you wish to load only 10, below settings should help you ignore the rest 10 symbols from screening it for setups
Updating Symbol Script.
This is an important part is used for Algo trades. Read the tooltip for better understanding of the format. Acceptable format is Broker Name followed with : and space with Symbol mapping Name followed with / and Instrument token provided by broker if no token alloted for the script then you may keep 0 against symbol name followed with / and Qty in terms of absolute value or in terms of percentage.
Trade and Scan Settings
Symbol List Mapping
For Improvements in Results - Use Events and keep a track of it / use Nudges etc.

kaptanFantastik[Take Profit and Stop Loss Finder]Hello all,
It's ATR based active take profit & stop loss finder.
You can set multipliers for taking profit and stop losing and you can change the price source for the calculation. Also, you can change the ATR level.
Defaults are my best settings. 2.2x for taking profit and 1.5x for stop losing. Open price is the source. Also, I think 5 ATR is the best for day and swing trade.
Levels are determined according to the open prices (This is because we can enter the position after our other indicators give the signal following the close price. Yet, you can change it). Since it's active and based on my calculation with ATR values, percentages for the taking profits and stop losing may change. Because of this, you need to note the take profit and stop lose prices after your entry price level is determined by the other indicators for the best success rates.
It can be used in any time frame with the other indicators to determine the best entry points. For example, 3 EMA levels with 5,8 and 13 is good option for the entry. You can enter the position when 5 crosses up 8 and both are above the 13. You can also use custom more advanced buy/sell indicators with this one for entry points.
It can be used with any asset from cryptocurrency to the stocks, from forex to gold etc.
Hint: You can set your levels lower than the take profit prices to maximize the success rate.
Note: Market should be open for the positions.
Example trade on the 5-minute timeline.
The below chart has both my custom indicator and the 3 EMAs mentioned above.
Trade 1: Entry price: 19191, Take Profit: 19276. Profit 0.44%
Trade 2: Entry price: 19189, Take Profit: 193009. Profit 0.625%
Türkçe bilen kullanıcılar için açıklama
Herkese merhabalar,
ATR tabanlı aktif kar al ve zararı durdur bulucu.
Kar almak ve zararı kesmek için çarpanlar belirleyebilir ve hesaplama için fiyat kaynağı değiştirebilirsiniz. Ayrıca, ATR seviyesini de değiştirebilirsiniz.
Varsayılanlar benim en iyi ayarlarım. Kar almak için 2,2 kat ve zararı durdurmak için 1,5 kat. Açılış, fiyat kaynağıdır. Ayrıca, 5 ATR'nin günlük ve kısa vade (swing trade) için en iyisi olduğunu düşünüyorum.
Seviyeler açılış fiyatına göre belirlenir (Çünkü diğer göstergelerimiz kapanış fiyatının ardından sinyal verdikten sonra pozisyona girebiliyoruz. Yine de bunu değiştirebilirsiniz). Aktif olduğu için ve ATR değerleri ile yaptığım hesaplamaya göre kar alma ve zarar kes yüzdeleri değişebilir. Bu nedenle, en iyi başarı oranları için; giriş fiyat seviyeniz diğer göstergeler tarafından belirlendikten sonra kar al ve zararı durdur fiyatlarını not etmeniz gerekir.
En iyi giriş noktalarını belirlemek için diğer göstergelerle herhangi bir zaman diliminde kullanılabilir. Örneğin, 5,8 ve 13 ile 3 EMA seviyesi giriş için iyi bir seçenektir. 5, 8'i geçtiğinde ve her ikisi de 13'ün üzerinde olduğunda pozisyona girebilirsiniz. Giriş noktaları için bununla birlikte daha gelişmiş özel al/sat göstergelerini de kullanabilirsiniz.
Kripto paradan hisse senetlerine, forexten altına vb. her türlü varlıkla kullanılabilir.
İpucu: Başarı oranını en üst düzeye çıkarmak için seviyelerinizi kar alma fiyatlarından daha düşük ayarlayabilirsiniz.
Not: Pozisyonlar için piyasa açık olmalıdır.
5 dakikalık zaman çizilgesinde örnek işlem.
Yukarıdaki örnek grafikte hem özel indikatörüm hem de yukrıda belirtilen 3 EMA var.
İşlem 1: Giriş fiyatı: 19191, Kazanç Al: 19276. Kar %0.44
İşlem 2: Giriş fiyatı: 19189, Kazanç Al: 193009. Kar %0.625

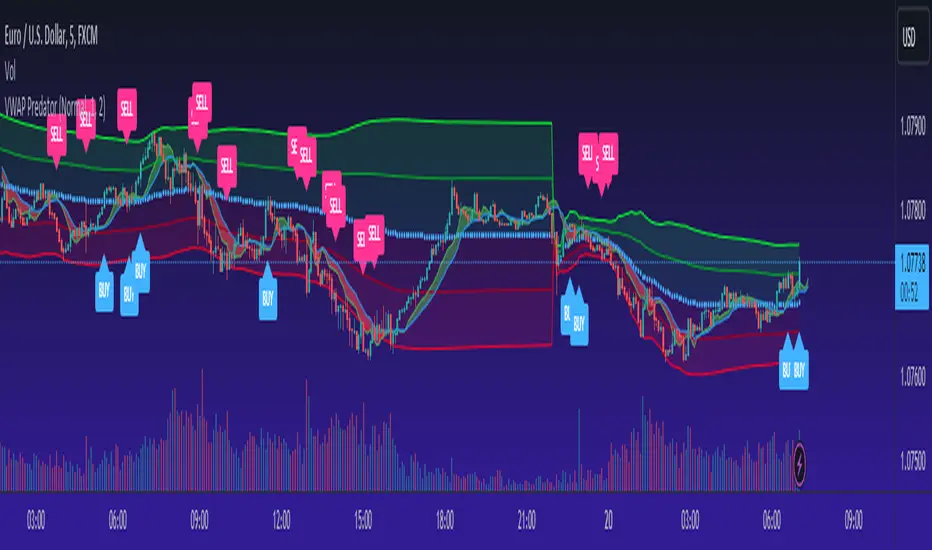
VWAP PredatorUsing VWAP as a start point, the VWAP Predator uses proprietary Fibonacci bands to help determine signal criteria. Most traders use VWAP in a simple way to determine whether an instrument is in a bearish or bullish state, but that doesn't help choosing the correct time to go long or short.
The xBat VWAP Predator uses behavioural analysis with volume, price action with open and close proximities to the Fibonacci bands/zones (Fib Zones). The following describes how the xBrat VWAP Predator is different to any standard use of Volume Weighted Average Price and uses xBrat Proprietary Behavioural logic to determine high probability long and Short signals. All of this heavy lifting and logic is done behind the scenes, keeping traders charts clean.
Long Trading Signals - Candle Coloured in Blue - There are many states with the logic to produce these signals, which are briefly described below:
1. The only standard criteria here - The price action must be above the VWAP Line
2. The Price must open below the boundary of one Fib Zone and close into the next Fib Zone
3. That Same Candle has to be an Accumulation Candle (more volume than the preceding candle and More Buyers) - This is determined with our proprietary logic coding
4. The Same signal candle also has to be higher than average volume. Again, our proprietary xBrat Logic just doesn't look back over a set number of bars, it looks at times of day and day of week, plus more to determine a true valuation of higher, lower or equal to average volume.
5. Only when these states are met, plus two more ema proximity logic, Does the xBrat VWAP predator give a Long Signal.
6. Trade Management is either set targets or indeed a simple ema cross which we provide as a ribbon on the chart to help traders. These ema's are different to entry logic. When the Ribbon turns from green to red, the trader should consider exiting the trade
Short Trading Signals - Candle Coloured in Pink - There are many states with the logic to produce these signals, which are briefly described below:
1. The only standard criteria here - The price action must be below the VWAP Line
2. The Price must open above the boundary of one Fib Zone and close into the next Fib Zone
3. That Same Candle has to be a Distribution Candle (more volume than the preceding candle and More Sellers) - This is determined with our proprietary logic coding
4. The Same signal candle also has to be higher than average volume. Again, our proprietary xBrat Logic just doesn't look back over a set number of bars, it looks at times of day and day of week, plus more to determine a true valuation of higher, lower or equal to average volume.
5. Only when these states are met, plus two more ema proximity logic, Does the xBrat VWAP predator give a Short Signal.
6. Trade Management is either set targets or indeed a simple ema cross which we provide as a ribbon on the chart to help traders. These ema's are different to entry logic. When the Ribbon turns from red to green, the trader should consider exiting the trade.
VWAP Predator is a day trading and scalping signals trading indicator.
Helicopter!Review
This indicator automatically calculates the best trade entry based on volume and real-time volatility. After the algorithm analyzes the current characteristics of the market, an entry signal is placed on the chart. As a result, the trader can be sure that the signal is based on data analysis. One of the key elements is reverse transactions. A long or short position can be stopped either at a profit or at a small loss without compromising the potential profit.
!Risks
The market is unstable, and it is impossible to know what the future holds for it. The only way to manage risk. You can limit the loss by setting a stop loss of 1% from the entry point. Take profit is recommended to set with a ratio of 1:1, 1:2,1:3, with partial fixation of 40%, 30%, 30%!
!Trading recommendations
Trades are opened when a green arrow appears, selling when a yellow arrow appears. Be sure to wait for the candle to close and the signal to appear (the signal may flash when the candle is formed). Recommended timeframes: 1min, 3min, 15min. The indicator is designed for scalp trades and intradays!
!Technical part
The indicator is based on the EMA 20 and EMA 200 moving averages. It is also based on the open and close of past days, weeks, months.
RSI are used.
RSI is a classic oscillator built on the basis of calculating the relative rate of change in asset prices over a given period.
Additional tools: volume and volatility.
NO REPAINT!
-------------------------------------------------------
Denial of responsibility
The information contained in my Scripts/Indicators/Ideas/Algorithms/Systems does not constitute financial advice or an offer to buy or sell any securities of any kind. I do not accept liability for any loss or damage, including but not limited to any loss of profits that may arise directly or indirectly from the use of or reliance on such information.
TMO ScalperTMO - (T)rue (M)omentum (O)scillator) MTF Scalper Version
TMO Scalper is a special custom version of the popular TMO Oscillator. Scalper version was designed specifically for the lower time frames (1-5min intraday scalps). This version prints in the signals directly on top of the oscillator only when the higher aggregations are aligned with the current aggregation (the big wheels must be spinning in order for a small wheel to spin). The scalper consist of three MTF TMO oscillators. First one is the one that plot signals (should be the fastest aggregation), second serves as a short term trend gauge (good rule of thumb is to us 2-5x of the chart time frame or the first aggregation). The third one (optional) is shaded in the background & should only serve as a trend gauge for the day (usually higher time frames 30min+).
Time Frames Preffered by Traders:
1. 1m / 5m / 30m - This one is perfect for catching the fastest moves. However, during choppy days the 1min can produce more false signals..
2. 2m / 10m / 30m - Healthy middle, the 2min aggregation nicely smooths out the 1min mess. Short term gauge is turning slowly (10min for a signal to confirm).
3. 3m / 30m / 60m - This TF is awesome for day traders that prefer to take it slow. Obviously, this combination will produce far less signals during the day.
Hope it helps.

Trend Follower Intraday [ Adjustable TF ]Trend Follower Intraday for 3 minute Time-Frame (Adjustable) , that has the time condition for Indian Markets as well.
Unlike the Free Scripts - Risk Management , Position Sizing , Partial Exit etc. are also included .
Send us a Message to know more about the strategy.
// ══════════════════════════════════════════════════════════════════════════ //
The Timing can be changed to fit other markets, scroll down to "TIME CONDITION" to know more.
The commission is also included in the strategy .
The basic idea is when ,
1) EMA1 crosses above EMA2 , is a Long condition .
2) EMA1 crosses below EMA2 , is a Short condition .
3) Green Section indicates Long position.
4) Red Section indicates Short position.
5) Allowed hours specifies the trade entry timing.
6) ATR STOP is the stop-loss value on chart , can be adjusted in INPUTS.
7) Target 1 is the 1st target value on chart , can be adjusted in INPUTS.
8) RISK is Maximum Risk per trade for the intraday trade can be changed .
9) Total Capital used can be adjusted under INPUTS.
10) ATR TRAIL is used for trailing after entry, as mentioned in the inputs below.
11) Check trades under the list of trades .
12) Trade only in liquid stocks .
13) Risk only 1-5% of total capital.
14) Inputs can be changed for better back-test results, but also manually check the trades before setting alerts
15) SQUARE OFF TIME - As you change the time frame , also change the square-off time to the candle's closing time.
Eg: For 3min Time-frame , Hour = 2Hrs | Minute = 57min
16) Strategy stops for the day if you have a loss .
17) COMMISSION value is set to 20Rs and SLIPPAGE value is set to 2 . Go to properties to change it .
*The input values and the results are mentioned under "BACKTEST RESULTS" below*
// ══════════════════════════════ //
// ————————> RISK MANAGEMENT <——————— //
// ══════════════════════════════ //
Risk management is done based on max loss per trade and can be adjusted in the INPUTS.
// ═══════════════════════════ //
// ————————> POSITION SIZE <——————— //
// ═══════════════════════════ //
Quantity of each trade is different based on the loss
// ═════════════════════════ //
// ————————> PROPERTIES <——————— //
// ═════════════════════════ //
COMMISSION , SLIPPAGE ,RECALCULATE is already mentioned in the code.
COMMISSION can be charges , based on the broker charges.
// ═══════════════════════════════//
// ————————> TIME CONDITION <————————— //
// ═══════════════════════════════//
The time can be changed in the INPUT.
The Indian Markets open at 9:15am and closes at 3:30pm.
The 'Allowed hours' under Inputs specifies the time at which Entries should happen .
"Close All" function closes all the trades before 3pm , at the open of the next candle.
To change the time to close all trades , check INPUT.
All open trades get closed by 3pm , because some brokers don't allow you to place fresh intraday orders after 3pm .
// ═══════════════════════════════════════════════ //
// ————————> BACKTEST RESULTS ( 123 CLOSED TRADES ) <————————— //
// ═══════════════════════════════════════════════ //
INPUTS can be changed for better Back-Test results.
The strategy applied to NSE:JSWENERGY (3 min Time-Frame and with a capital of 3,00,000 ) gives us 81% profitability , as shown below
It was tested for a period a 6 months with a Profit Factor of 1.957 ,net Profit of 43,000Rs .
Sharpe Ratio = 0.745
Sortino Ratio = 2.091
No strategy in the world promises 100% profits in all market conditions , so always define your risk before trading.
Also check Back-Test results manually ,before setting Alerts
The Graph has a Linear Curve with Consistent Profits.
The INPUTS are as follows,
1) EMA1 ————————————————> 38
2) EMA2 ————————————————> 118
3) ALLOWED HRS ———————————> 9:35 TO 14:30
4) ATR STOP ——————————————> 3.2
5) RISK ——————————————————> 3000
6) ATR TRAIL ———————————————> 2.6
7) TARGET 1 ————————————————> 2.4
8) MAX POSITION VALUE ——————————> 3,00,000
8) MAX DRAWDOWN —————————————> 9,000
8) SQUARE-OFF ————————————————> 14:57
NSE:JSWENERGY
Apply it to your charts Now !
NSE:JSWENERGY
Send us a message for FREE TRIALS | Instant Access
Thank You ☺
