Realtime Volume Analysis ToolbarThis script displays an intrabar volume analysis in realtime
displayed data is the following
Total volume
Up volume
Down volume
Delta
Buyers %
More options will be added in the future, at least customization of the colors.
Delta

Binance Big Open Interest Delta Change v2 Note: This script will only work properly with Binance Futures symbols.
This script simply looks at the open interest for the symbol you are currently viewing and determines if a large change in open interest has occurred, which triggers a background color alert.
It does this by comparing the absolute value of the range of the current open interest bar with a simple average (length set by user) of the past x range. The user also determines what is considered a 'large' change in open interest by setting a multiplier with which the current range must exceed compared to the average range in order to trigger an alert.
If the change in open interest is an increase in OI, the alert is blue, and if the change in open interest is a decrease, the alert is orange.
The open interest ticker that is used for calculation is derived by adding the current ticker and "_OI" so that it auto changes each time you switch to a new Binance futures contract.

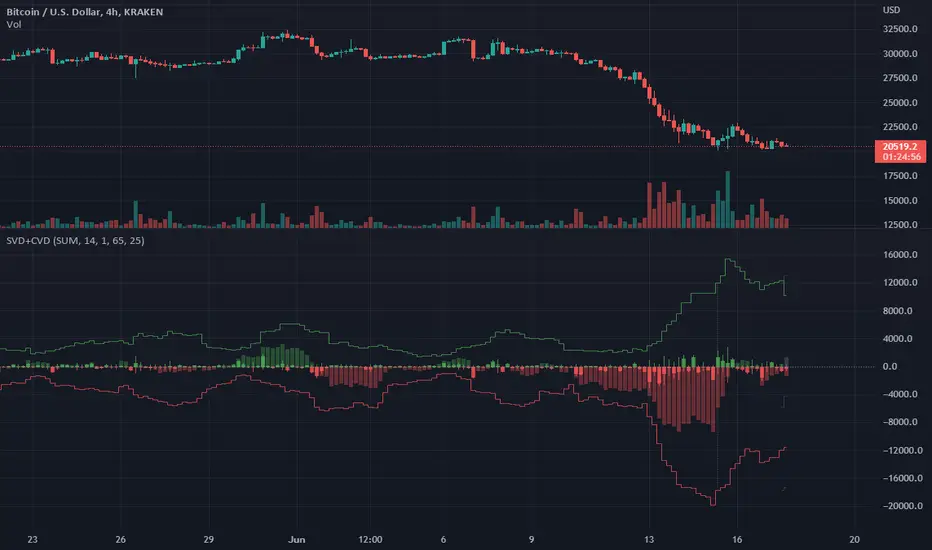
Singular and Cumulative Volume Delta (SVD+CVD)This a Volume Delta indicator with Cumulative Volume Delta.
I have been studying Volume Delta and CVD trading strategies and indicator styles.
This implementation was developed to test a basic trailing window / oscillator approach.
Script has been republished as public and searchable.
Changelog from private era follows.
Jun 9 (2022)
Release Notes:
Added option to use EMA/SMA based cumulation. This will not scale well with singular data, so default view is still SUM.
Jun 9 (2022)
Release Notes:
Outdated comment correction.
Jun 9 (2022)
Release Notes:
Added default option to normalilze visual scale of MA cumulation types. The averaging creates a singular value sized results, instead of a range-sums. This multiples that candle result by the range length to get a range-sum sized result.
Added option to scale the cumulation size relative to the volume size. 1-to-1 scaling creates singular deltas that can be hard to see with all options on. This allows you to beef them up for visual or weighting purposes.
Jun 15 (2022)
Release Notes: * Added break even level for current delta. Tells where current delta must land for cumulative delta to stay flat.
* Added comparison of historical cumulative levels to current level. The historical levels are the initial values going into current accumulation window.
* Changed title of indicator to be more generic, clear, and searchable.
Jun 15 (2022)
Release Notes: * Added option to have the cumulation cutoff line AFTER or OVER the end of the cumulation window. This change is to ensure the indicator clearly documents it's behavior and avoids confusion on this / last cumulation window semantics.
* Bugfix: Initial levels were pulled from cumulation line which was AFTER end of window. This has been changed to the initial values INSIDE the cumulation window.
* Code cleanup.
June 17th (2022)
Release Notes: Marked as beta because TV confirmed they no longer allow private scripts to be changed to public. (Despite lingering documentation that says otherwise.
June 17th (2022)
Re-published as public.
Educational LTF -> HTF volume deltaThis script shows 1 of several technique to gather volume delta
-> more explanation can be found in the script itself,
Cheers!
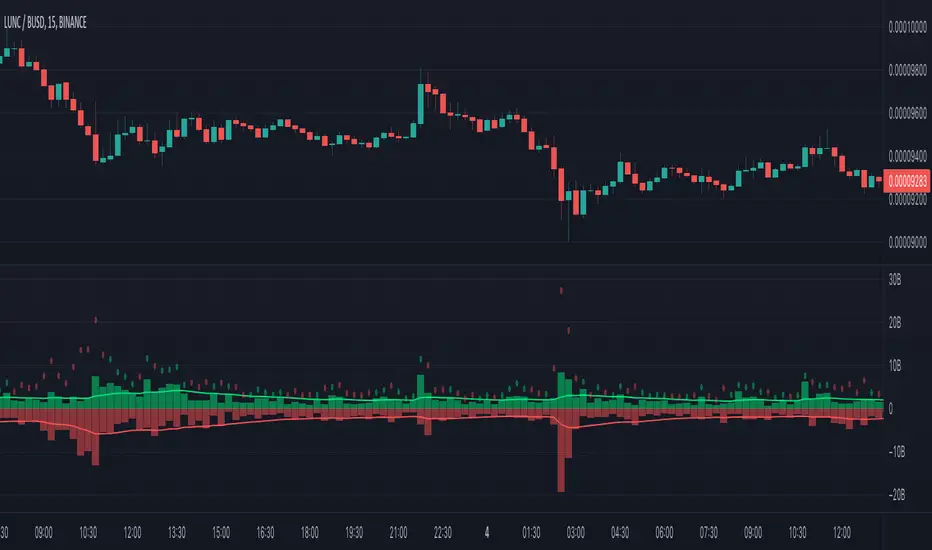
Delta Volume by SiddWolfDelta Volume is Difference between Buying Volume and Selling Volume. This indicator gives the Delta Volume based on Lower TimeFrame Candles. It utilizes security_lower_tf() function, a function that provides Lower TF candle data in Higher TF Chart.
security_lower_tf() is a new function provided by TradingView yesterday. If you are a PineScript Programmer, I suggest you to read about it, as it is a very powerful function that can extremely improve your trading strategy.
How this indicator works:
This indicator checks volume data on lower TimeFrame Candles and Shows it's delta in the current Chart Timeframe. For example: If you open 4 hours chart, this indicator checks volume of 1 minute chart and separates Buying-Selling volume. Then it subtracts Candle's Selling volume from Candle's Buying volume, finally calculating the Delta Volume.
This indicator also provides a Smooth Delta Volume, which is moving average of Delta Volume. As Delta Volume changes a lot, Smooth Delta Volume can be very helpful for identifying Trends . Goto settings and in "Show" section select "Smooth Delta Volume" to lay it on the chart.
Settings is the Key:
Settings are key to all of my indicators. Play around with it a bit. You can change what to show on the chart from settings. Smooth Delta Volume moving average length can be changed from the settings. You can also select "Show as Percentage", which shows Delta Volume as Percentage of Overall Candle's Volume. If you use Weekly or Monthly Timeframe, change increase lower timeframe from settings. Read the tooltips to understand what each settings mean. Tooltips are the (i) button in-front of each settings.
FAQs:
Q. Does the indicator Repaint ?
--- No. None of my indicators repaints. What you see now is what's drawn in real time.
Q. What TimeFrame is Best for this Indicator ?
--- It can be used on timeframes from 5 minutes to higher. But I would prefer to use it from timeframes higher than 30 minutes, as it gathers data from 1 minute TF.
Q. Indicator doesn't show anything ?
--- This indicator only works on security with Volume data. Also use it from higher timeframe than specified in Settings, because Volume Delta is calculated using Data from Lower TimeFrame.
Q. Delta volume is not provided by TradingView, So how exactly does this indicator work?
--- This indicator takes advantage of new pinescript function security_lower_tf(), and calculates volume for smaller timeframe data and calculates delta on higher timeframe.
Q. Does this indicator give financial advice?
--- No. Nope. Nein. Não. नहीं.
Conclusion:
This indicator is very basic but if used correctly it can be very powerful. If you have any questions or suggestions feel free to comment below. I'd love to connect with you. Thank you.
~ @SiddWolf

Heikin Ashi OscillatorThis indicator plots a delta between the Heiken Ashi close price and the regular candlestick closing price as a histogram, which allows you to quickly analyse changes in trend
direction.
It also provides a reverse-engineered closing price for regular candlesticks, to reach in order to maintain the momentum, which allows you to be forewarned of potential pivot points to change in bias in direction.
Feel free to use this indicator to modify and add to your charts as you wish.

Realtime FootprintThe purpose of this script is to gain a better understanding of the order flow by the footprint. To that end, i have added unusual features in addition to the standard features.
I use "Real Time 5D Profile by LucF" main engine to create basic footprint(profile type) and added some popular features and my favorites.
This script can only be used in realtime, because tradingview doesn't provide historical Bid/Ask date.
Bid/Ask date used this script are up/down ticks.
This script can only be used by time based chart (1m, 5m , 60m and daily etc)
This script use many labels and these are limited max 500, so you can't display many bars.
If you want to display foot print bars longer, turn off the unused sub-display function.
Default setting is footprint is 25 labels, IB count is 1, COT high and Ratio high is 1, COT low and Ratio low is 1 and Delta Box Ratio Volume is 1 , total 29.
plus UA , IB stripes , ladder fading mark use several labels.
///////// General Setting ///////////
Resets on Volume / Range bar
: If you want to use simple time based Resets on, please set Total Volume is 0.
Your timeframe is always the first condition. So if you set Total Volume is 1000, both conditions(Volume >= 1000 and your timeframe start next bar) must be met. (that is, new footprint bar doesn't start at when total volume = exactly 1000).
Ticks per row and Maximum row of Bar
: 1 is minimum size(tick). "Maximum row of Bar" decide the number of rows used in one footprint. 1 row is created from 1 label, so you need to reduce this number to display many footprints (Max label is 500).
Volume Filter and For Calculation and Display
: "Volume Filter" decide minimum size of using volume for this script.
"For Calculation and Display" is used to convert volume to an integer.
This script only use integer to make profile look better (I contained Bid number and Ask number in one row( one label) to saving labels. This require to make no difference in width by the number of digits and this script corresponds integers from 0 to 3 digits).
ex) Symbol average volume size is from 0.0001 to 0.001. You decide only use Volume >= 0.0005 by "Volume Filter".
Next, you convert volume to integer, by setting "For Calculation and Display" is 1000 (0.0005 * 1000 = 5).
If 0.00052 → 5.2 → 5, 0.00058 → 5.8 → 6 (Decimal numbers are rounded off)
This integer is used to all calculation in this script.
//////// Main Display ///////
Footprint, Total, Row Delta, Diagonal Delta and Profile
: "Footprint" display Ask and Bid per row. "Total" display Ask + Bid per row.
"Row Delta" display Ask - Bid per row. "Diagonal Delta" display Ask(row N) - Bid(row N -1) per row.
Profile display Total Volume(Ask + Bid) per row by using Block. Profile Block coloring are decided by Row Delta value(default: positive Row Delta (Ask > Bid) is greenish colors and negative Row Delta (Ask < Bid) is reddish colors.)
Volume per Profile Block, Row Imbalance Ratio and Delta Bull/Bear/Neutral Colors
: "Volume per Profile Block" decide one block contain how many total volume.
ex) When you set 20, Total volume 70 display 3 block.
The maximum number of blocks that can be used per low is 20.
So if you set 20, Total volume 400 is 20 blocks. total volume 800 is 20 blocks too.
"Row Imbalance Ratio" decide block coloring. The row imbalance is that the difference between Ask and Bid (row delta) is large.
default is x3, x2 and x1. The larger the difference, the brighter the color.
ex) Ask 30 Bid 10 is light green. Ask 20 Bid 10 is green. Ask 11 Bid 10 is dark green.
Ask 0 Bid 1 is light red. Ask 1 Bid 2 is red. ask 30 Bid 59 is dark green.
Ask 10 Bid 10 is neutral color(gray)
profile coloring is reflected same row's other elements(Ask, Bid, Total and Delta) too.
It's because one label can only use one text color.
/////// Sub Display ///////
Delta, total and Commitment of Traders
: "Delta" is total Ask - total Bid in one footprint bar. Total is total Ask + total Bid in one footprint bar.
"Commitment of traders" is variation of "Delta". COT High is reset to 0 when current highest is touched. COT Low is opposite.
Basic concept of Delta is to compare price with Delta. Ordinary, when price move up, delta is positive. Price move down is negative delta.
This is because market orders move price and market orders are counted by Delta (although this description is not exactly correct).
But, sometimes prices do not move even though many market orders are putting pressure on price , or conversely, price move strongly without many market orders.
This is key point. Big player absorb market orders by iceberg order(Subdivide large orders and pretend to be small limit orders.
Small limit orders look weak in the order book, but they are added each time you fill, so they are more powerful than they look.), so price don't move.
On the other hand, when the price is moving easily, smart players may be aiming to attract and counterattack to a better price for them.
It's more of a sport than science, and there's always no right response. Pay attention to the relationship between price, volume and delta.
ex) If COT Low is large negative value, it means many sell market orders is coming, but iceberg order is absorbing their attack at limit order.
you should not do buy entry, only this clue. but this is one of the hints.
"Delta, Box Ratio and Total texts is contained same label and its color are "Delta" coloring. Positive Delta is Delta Bull color(green),Negative Delta is Delta Bear Color
and Delta = 0 is Neutral Color(gray). When Delta direction and price direction are opposite is Delta Divergence Color(yellow).
I didn't add the cumulative volume delta because I prefer to display the CVD line on the price chart rather than the number.
Box Ratio , Box Ratio Divisor and Heavy Box Ratio Ratio
: This is not ordinary footprint features, but I like this concept so I added.
Box Ratio by Richard W. Arms is simple but useful tool. calculation is "total volume (one bar) divided by Bar range (highest - lowest)."
When Bull and bear are fighting fiercely this number become large, and then important price move happen.
I made average BR from something like 5 SMA and if current BR exceeds average BR x (Heavy Box Ratio Ratio), BR box mark will be filled.
Box Ratio Divisor is used to good looking display(BR multiplied by Box Ratio Divisor is rounded off and displayed as an integer)
Diagonal Imbalance Count , D IB Mark and D IB Stripes
: Diagonal Imbalance is defined by "Diagonal Imbalance Ratio".
ex) You set 2. When Ask(row N) 30 Bid(row N -1)10, it's 30 > 10*2, so positive Diagonal Imbalance.
When Ask(row N) 4 Bid(row N -1)9, it's 4*2 < 9, so negative Diagonal Imbalance.
This calculation does not use equals to avoid Ask(row N) 0 Bid(row N -1)0 became Diagonal Imbalance.
Ask(row N) 0 Bid(row N -1)0, it's 0 = 0*2, not Diagonal Imbalance. Ask(row N) 10 Bid(row N -1)5, it's 10 = 5*2, not Diagonal Imbalance.
"D IB Mark" emphasize Ask or Bid number which is dominant side(Winner of Diagonal Imbalance calculation), by under line.
"Diagonal Imbalance Count" compare Ask side D IB Mark to Bid side D IB Mark in one footprint.
Coloring depend on which is more aggressive side (it has many IB Mark) and When Aggressive direction and price direction are opposite is Delta Divergence Color(yellow).
"D IB Stripes" is a function that further emphasizes with an arrow Mark, when a DIB mark is added on the same side for three consecutive row. Three consecutive arrow is added at third row.
Unfinished Auction, Ratio Bounds and Ladder fading Mark
: "Unfinished Auction" emphasize highest or lowest row which has both Ask and Bid, by Delta Divergence Color(yellow) XXXXXX mark.
Unfinished Auction sometimes has magnet effect, price may touch and breakout at UA side in the future.
This concept is famous as profit taking target than entry decision.
But, I'm interested in the case that Big player make fake breakout at UA side and trapped retail traders, and then do reversal with retail traders stop-loss hunt.
Anyway, it's not stand alone signal.
"Ratio Bounds" gauge decrease of pressure at extreme price. Ratio Bounds High is number which second highest ask is divided by highest ask.
Ratio Bounds Low is number which second lowest bid is divided by lowest bid. The larger the number, the less momentum the price has.
ex)first footprint bar has Ratio Bounds Low 2, second footprint bar has RBL 4, third footprint bar has RBL 20.
This indicates that the bear's power is gradually diminishing.
"Ladder fading mark" emphasizes the decrease of the value in 3 consecutive row at extreme price. I added two type Marks.
Ask/Bid type(triangle Mark) is Ask/Bid values are decreasing of three consecutive row at extreme price.
Row Imbalance type(Diamond Mark) are row Imbalance values are decreasing of three consecutive row at extreme price.
ex)Third lowest Bid 40, second lowest Bid 10 and lowest Bid 5 have triangle up Mark. That is bear's power is gradually diminishing.
(This Mark only check Bid value at lowest price and Ask value at highest price).
Third highest row delta + 60, second highest row delta + 5, highest delta - 20 have diamond Mark. That is Bull's power is gradually diminishing.
Sub display use Delta colors at bottom of Sub display section.
////// Candle & POC /////////
candle and POC
: Ordinary, "POC" Point of Control is row of largest total volume, but this script'POC is volume weighted average.
This is because the regular POC was visually displayed by the profile ,and I was influenced LucF's ideas.
POC coloring is decided in relation to the previous POC. When current POC is higher than previous POC, color is UP Bar Color(green).
In the opposite case, Down Bar color is used.
POC Divergence Color is used when Current POC is up but current bar close is lower than open (Down price Bar),or in the opposite case.
POC coloring has option also highlight background by Delta Divergence Color(yellow). but bg color is displayed at your time frame current price bar not current footprint bar.
The basic explanation is over.
I add some image to promote understanding basic ideas.

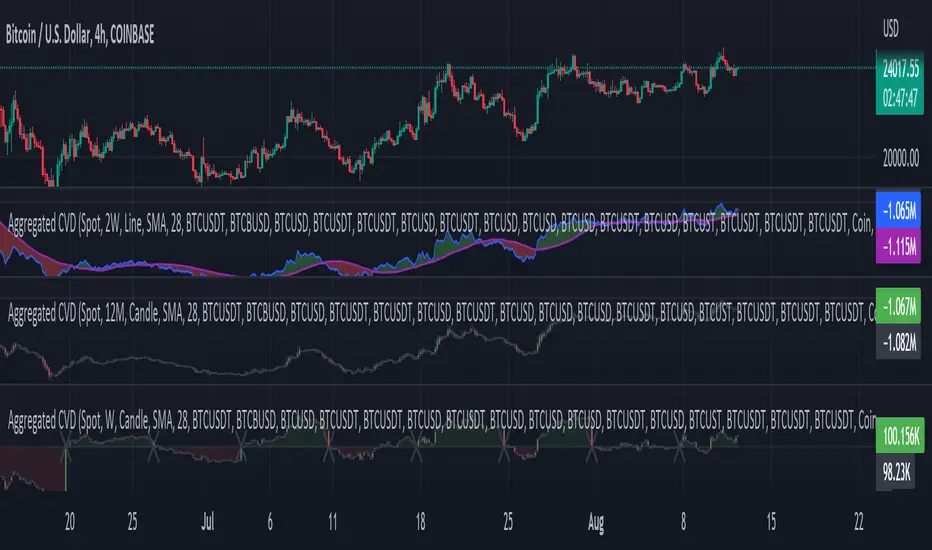
Aggr. CDV / Delta Volume - InFinitoModified & Updated script from MARKET VOLUME by Ricardo M Arjona @XeL_Arjona that Includes Aggregated Volume, Delta Volume, Volume by Side
Aggregation code originally from Crypt0rus
Candle Plotting code from LonesomeTheBlue
***The indicator can be used for any coin/symbol to aggregate volume , but it has to be set up manually***
***The indicator can be used with specific symbol data only by disabling the aggregation option, which allows for it to be used on any symbol***
- Calculated based on Aggregated Volume instead of by symbol volume . Using aggregated data makes it more accurate and allows to compare volume flow between different kinds of markets (Spot, Futures , Perpetuals, Futures+Perpetuals and All Volume ).
- As well, in order to make the data as accurate as possible, the data from each exchange aggregated is normalized to report always in terms of 1 BTC . In case this indicator is used for another symbol, the calculations can be adjusted manually to make it always report data in terms of 1 contract/coin.
All Aggregated Volume By Side: Based of Xel_Arjona's calculation, buy and sell volume is estimated each period. This indicators can display both Buy Volume and Sell Volume for each period.
Aggregated Delta Volume By Side: Displays the difference between Buy & Sell Volume as Delta (Down if Sell Vol - Up if Buy Vol)
Aggregated Cumulative Delta Volume: Displays the sum of Delta Volume as a line, candles or Heiken Aishi Candles. Great for observing Volume Flow and spotting divergences
- It is Possible to add an MA to the CVD and to color fill in between the indicator and the MA
- It is possible to reset the indicators basis to 0 periodically
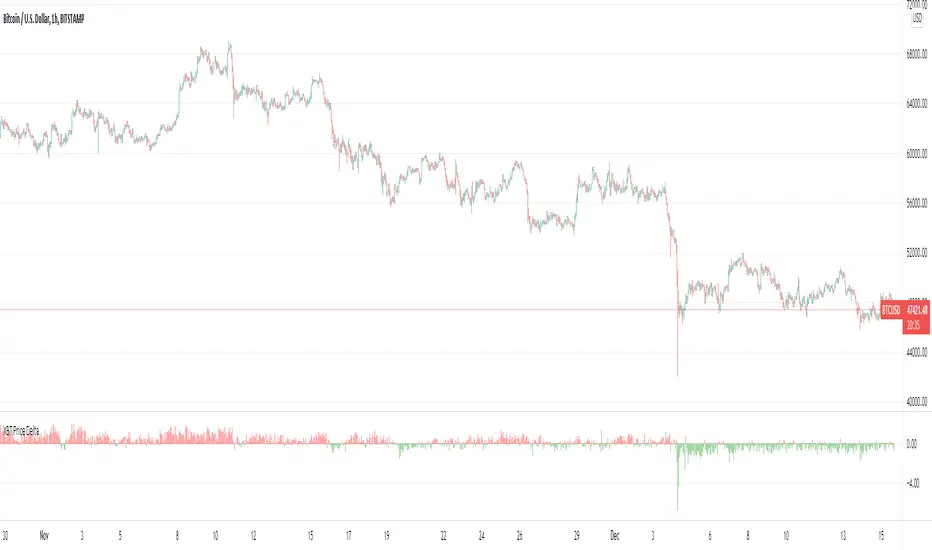
XBT Price DeltaCoinbase spot versus Bybit Perps Indicator
Red = Perps price above Spot price-Perps leading
Green = Spot price above Perps price-Spot Leading
OmegaDeltaExperimental:
- calculates the trajectory of every price change at each bar accordingly to the delta change on the next and so forth,
- the name is just a *pun* at the code☺☺☺

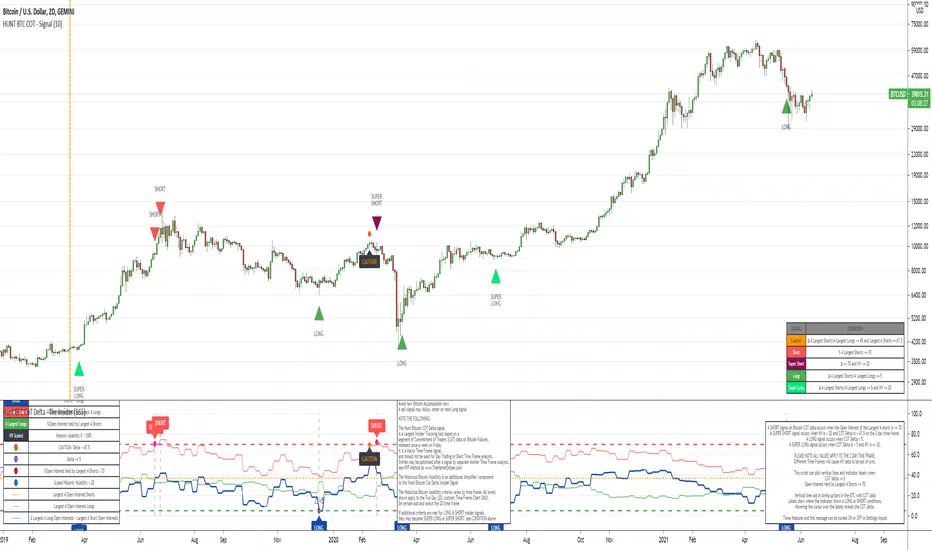
The Insider - Hunt Bitcoin CoT DeltaThe Insider - Hunt Bitcoin CoT Delta
The gift of the Squeeze in the Largest 4 open Interest Shorts vs Longs.
Why Bother another CoT signal?
Its different & focused on the Insider's.
Performance -
This Indicator provided a
1. Signal 1 = 26th March 2019 = SUPER LONG at $4,500 that saw a near $14,000 run up
2. Signal 2 = 18th & 24th June 2019 = SHORT at the second & final level $11,700 after repeated attempts & failure in the $13K range, the mini Echo Bitcoin Bull of 2019
3. Signal 3 = 17th December 2019 = LONG $6,900, Bitcoin rallied to Mid $10,500's
4. Signal 4 = 18th Feb 2020 = SUPER SHORT from $9,700's to a final extreme Low of $3,000, calling the CV-19 collapse
5. Signal 5 = 17th March 2020 = LONG from $5,400 no closure point yet
6. Signal 6 = 29th June 2020 = SUPER LONG reiterate from $10,700 no closure sell signal yet
7. Signal 7 = 17th May 2020 = LONG another accumulate LONG with no sell signal yet generated at Post H&S's low of $33,000
Note - This indicator only commences March 2019, as Bitcoin futures were a recent introduction and needed to settle for 6 months in both use and data, no signals were meaningful prior & data was light.
What is Provided. - Please note the need to also add the Hunt Bitcoin Historical Volatility Indicator for full understanding.
We provide 3 things with the 3 indicators.
'Insider' indications from Largest players in the futures market.
1. Bitcoin Macro Buy Signals.
a) The Bitcoin Commitment of Traders results see us focus solely on Largest 4 Short Open Interest & Largest 4 Long Open Interest aspects of the CoT Release data.
When the difference - is tight, a kind of pinch, these have been great Buy signals in Bitcoin.
We call this difference the Delta & When Delta is 5% or less Bitcoin is a Buy.
2. Bitcoin Macro Sells.
a) A sell signal is Triggered in Bitcoin at any point the Largest 4 short OI > or = to 70
3. AMPLIFIER Trade signals 'Super' Longs or Shorts -
Extreme low volatility events leads to highly impulsive & volatile subsequent moves, if either of 1 or 2 above occur, combined with extreme low volatility
a 'Super Long' or 'SUPER SELL' is generated. In the case of the short side, given Bitcoins general expansive and MACRO Bull trend since inception, we seek an additional component
that is an extreme differential/Delta reading between 4 biggest Longs & Shorts OI.
Namely CoT Delta also must be > 47.5%
We also have a Cautionary level, where it is not necessarily a good idea to accumulate Bitcon, as a better opportunity lower may avail itself, see conditions below.
So the required logic explicitly stated below for all Signals.
1. Long - Hunt Bitcoin CoT Delta < or = 5
2. SUPER Long - Hunt Bitcoin CoT Delta < or = 5; and 2 Day Historical Bitcoin Volatility = or < 20
3. Short - Largest 4 Sellers OI = or > 70
4. SUPER Short - Largest 4 Sellers OI = or > 70; AND..
Hunt Bitcoin CoT Delta = or > 47.5 AND 2 Day Historical BTC Volatility = or < 20
5. Caution - Largest 4 Sellers OI = or > 67.5 AND Hunt Bitcoin CoT Delta = or > 45
WARNING SEE Notes Below
Note 1 - = Largest 4 Open Interest Shorts
Note 2 - = Largest 4 Open Interest Longs
Note 3 - = Hunt Cot Delta = (Largest 4 sellers OI) -( Largest 4 Buyers OI)
Caution = Avoid new Bitcoin Accumulation Right Now, A sell signal might follow Enter on next Long
Note 4 - The Hunt Bitcoin COT Delta signal is a Largest 'Insider' Tracking tool based on a segment of Commitment of Traders data on Bitcoin Futures, released once a week on a Friday.
It is a Macro Timeframe signal , and should not be used for Day trading and Short Timeframe analysis , Entries may be optimised after a Hunt Bitcoin CoT Signal is generated by separate shorter Timeframe analysis.
Note 5 - The Historical Bitcoin Volatility is an additional 'Amplifier' component to the 'Hunt Bitcoin Cot Delta' Insider Signal
Note 6 - The Historical Bitcoin Volatility criteria varies by timeframe, the above levels are those applying on a Two Day TF Chart, select this custom timeframe in Trading View.
if additional criteria are met for LONG & SHORT insider signals, they may become 'Super Longs/Shorts', see conditions box above.
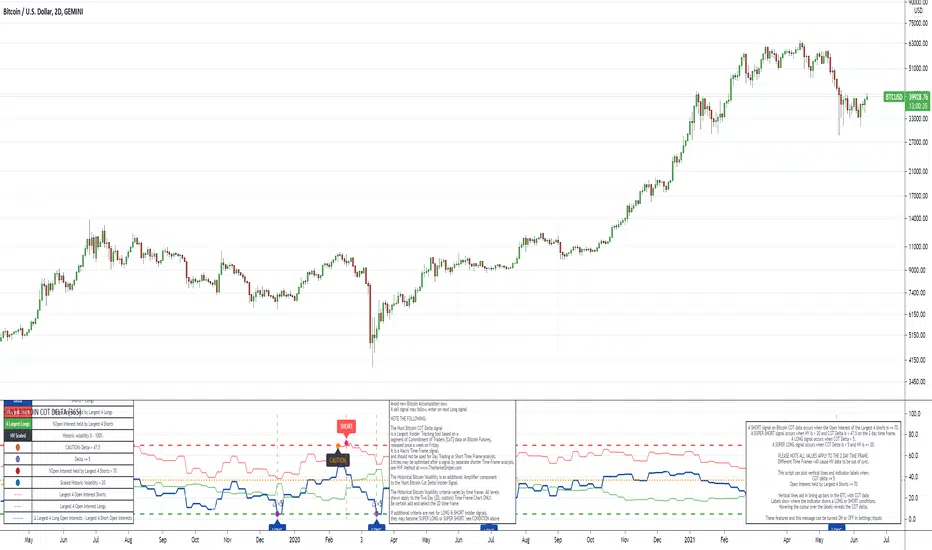
The Signal - Hunt Bitcoin CoT Buy/SellThe Signal - Hunt Bitcoin CoT Buy/Sell
Why Bother with another CoT signal?
Its different & focused on the Insider's. The Largest 4 Open Interest Seller and the Largest 4 open Interest Longs, plus the distance they are apart, the Delta, what does high percentage of Largest 4 sellers mean with a low 4 OI Buyers. , what when the usually higher Sellers are low and the largest 4 buyers almost the same value , Time to track the insiders Delta..
Performance -
This Indicator provided a
1. Signal 1 = 26th March 2019 = SUPER LONG at $4,500 that saw a near $14,000 run up
2. Signal 2 = 18th & 24th June 2019 = SHORT at the second & final level $11,700 after repeated attempts & failure in the $13K range, the mini Echo Bitcoin Bull of 2019
3. Signal 3 = 17th December 2019 = LONG $6,900, Bitcoin rallied to Mid $10,500's
4. Signal 4 = 18th Feb 2020 = SUPER SHORT from $9,700's to a final extreme Low of $3,000, calling the CV-19 collapse
5. Signal 5 = 17th March 2020 = LONG from $5,400 no closure point yet
6. Signal 6 = 29th June 2020 = SUPER LONG reiterate from $10,700 no closure sell signal yet
7. Signal 7 = 17th May 2020 = LONG another accumulate LONG with no sell signal yet generated at Post H&S's low of $33,000
Note - This indicator only commences March 2019, as Bitcoin futures were a recent introduction and needed to settle for 6 months in both use and data, no signals were meaningful prior & data was light.
What is Provided. - Please note the need to also add the Hunt Bitcoin Historical Volatility Indicator for full understanding.
We provide 3 things with the 3 indicators.
'Insider' indications from Largest players in the futures market.
1. Bitcoin Macro Buy Signals.
a) The Bitcoin Commitment of Traders results see us focus solely on Largest 4 Short Open Interest & Largest 4 Long Open Interest aspects of the CoT Release data.
When the difference - is tight, a kind of pinch, these have been great Buy signals in Bitcoin.
We call this difference the Delta & When Delta is 5% or less Bitcoin is a Buy.
2. Bitcoin Macro Sells.
a) A sell signal is Triggered in Bitcoin at any point the Largest 4 short OI > or = to 70
3. AMPLIFIER Trade signals 'Super' Longs or Shorts -
Extreme low volatility events leads to highly impulsive & volatile subsequent moves, if either of 1 or 2 above occur, combined with extreme low volatility
a 'Super Long' or 'SUPER SELL' is generated. In the case of the short side, given Bitcoins general expansive and MACRO Bull trend since inception, we seek an additional component
that is an extreme differential/Delta reading between 4 biggest Longs & Shorts OI.
Namely CoT Delta also must be > 47.5%
We also have a Cautionary level, where it is not necessarily a good idea to accumulate Bitcon, as a better opportunity lower may avail itself, see conditions below.
So the required logic explicitly stated below for all Signals.
1. Long - Hunt Bitcoin CoT Delta < or = 5
2. SUPER Long - Hunt Bitcoin CoT Delta < or = 5; and 2 Day Historical Bitcoin Volatility = or < 20
3. Short - Largest 4 Sellers OI = or > 70
4. SUPER Short - Largest 4 Sellers OI = or > 70; AND..
Hunt Bitcoin CoT Delta = or > 47.5 AND 2 Day Historical BTC Volatility = or < 20
5. Caution - Largest 4 Sellers OI = or > 67.5 AND Hunt Bitcoin CoT Delta = or > 45
WARNING SEE Notes Below
Note 1 - = Largest 4 Open Interest Shorts
Note 2 - = Largest 4 Open Interest Longs
Note 3 - = Hunt Cot Delta = (Largest 4 sellers OI) -( Largest 4 Buyers OI)
Caution = Avoid new Bitcoin Accumulation Right Now, A sell signal might follow Enter on next Long
Note 4 - The Hunt Bitcoin COT Delta signal is a Largest 'Insider' Tracking tool based on a segment of Commitment of Traders data on Bitcoin Futures, released once a week on a Friday.
It is a Macro Timeframe signal , and should not be used for Day trading and Short Timeframe analysis , Entries may be optimised after a Hunt Bitcoin CoT Signal is generated by separate shorter Timeframe analysis.
Note 5 - The Historical Bitcoin Volatility is an additional 'Amplifier' component to the 'Hunt Bitcoin Cot Delta' Insider Signal
Note 6 - The Historical Bitcoin Volatility criteria varies by timeframe, the above levels are those applying on a Two Day TF Chart, select this custom timeframe in Trading View.
if additional criteria are met for LONG & SHORT insider signals, they may become 'Super Longs/Shorts', see conditions box above.

Hunt Bitcoin CoT Open Interest DeltaWhy Bother another CoT signal?
Its different & focused on the Insider's.
Performance -
This Indicator provided a
1. Signal 1 = 26th March 2019 = SUPER LONG at $4,500 that saw a near $14,000 run up
2. Signal 2 = 18th & 24th June 2019 = SHORT at the second & final level $11,700 after repeated attempts & failure in the $13K range, the mini Echo Bitcoin Bull of 2019
3. Signal 3 = 17th December 2019 = LONG $6,900, Bitcoin rallied to Mid $10,500's
4. Signal 4 = 18th Feb 2020 = SUPER SHORT from $9,700's to a final extreme Low of $3,000, calling the CV-19 collapse
5. Signal 5 = 17th March 2020 = LONG from $5,400 no closure point yet
6. Signal 6 = 29th June 2020 = SUPER LONG reiterate from $10,700 no closure sell signal yet
7. Signal 7 = 17th May 2020 = LONG another accumulate LONG with no sell signal yet generated at Post H&S's low of $33,000
Note - This indicator only commences March 2019, as Bitcoin futures were a recent introduction and needed to settle for 6 months in both use and data, no signals were meaningful prior & data was light.
What is Provided. - Please note the need to also add the Hunt Bitcoin Historical Volatility Indicator for full understanding.
We provide 3 things with the 3 indicators.
'Insider' indications from Largest players in the futures market.
1. Bitcoin Macro Buy Signals.
a) The Bitcoin Commitment of Traders results see us focus solely on Largest 4 Short Open Interest & Largest 4 Long Open Interest aspects of the CoT Release data.
When the difference - is tight, a kind of pinch, these have been great Buy signals in Bitcoin.
We call this difference the Delta & When Delta is 5% or less Bitcoin is a Buy.
2. Bitcoin Macro Sells.
a) A sell signal is Triggered in Bitcoin at any point the Largest 4 short OI > or = to 70
3. AMPLIFIER Trade signals 'Super' Longs or Shorts -
Extreme low volatility events leads to highly impulsive & volatile subsequent moves, if either of 1 or 2 above occur, combined with extreme low volatility
a 'Super Long' or 'SUPER SELL' is generated. In the case of the short side, given Bitcoins general expansive and MACRO Bull trend since inception, we seek an additional component
that is an extreme differential/Delta reading between 4 biggest Longs & Shorts OI.
Namely CoT Delta also must be > 47.5%
We also have a Cautionary level, where it is not necessarily a good idea to accumulate Bitcon, as a better opportunity lower may avail itself, see conditions below.
So the required logic explicitly stated below for all Signals.
1. Long - Hunt Bitcoin CoT Delta < or = 5
2. SUPER Long - Hunt Bitcoin CoT Delta < or = 5; and 2 Day Historical Bitcoin Volatility = or < 20
3. Short - Largest 4 Sellers OI = or > 70
4. SUPER Short - Largest 4 Sellers OI = or > 70; AND..
Hunt Bitcoin CoT Delta = or > 47.5 AND 2 Day Historical BTC Volatility = or < 20
5. Caution - Largest 4 Sellers OI = or > 67.5 AND Hunt Bitcoin CoT Delta = or > 45
WARNING SEE Notes Below
Note 1 - = Largest 4 Open Interest Shorts
Note 2 - = Largest 4 Open Interest Longs
Note 3 - = Hunt Cot Delta = (Largest 4 sellers OI) -( Largest 4 Buyers OI)
Caution = Avoid new Bitcoin Accumulation Right Now, A sell signal might follow Enter on next Long
Note 4 - The Hunt Bitcoin COT Delta signal is a Largest 'Insider' Tracking tool based on a segment of Commitment of Traders data on Bitcoin Futures, released once a week on a Friday.
It is a Macro Timeframe signal , and should not be used for Day trading and Short Timeframe analysis , Entries may be optimised after a Hunt Bitcoin CoT Signal is generated by separate shorter Timeframe analysis.
Note 5 - The Historical Bitcoin Volatility is an additional 'Amplifier' component to the 'Hunt Bitcoin Cot Delta' Insider Signal
Note 6 - The Historical Bitcoin Volatility criteria varies by timeframe, the above levels are those applying on a Two Day TF Chart, select this custom timeframe in Trading View.
if additional criteria are met for LONG & SHORT insider signals, they may become 'Super Longs/Shorts', see conditions box above.
Tape [LucF]█ OVERVIEW
This script prints an ersatz of a trading console's "tape" section to the right of your chart. It displays the time, price and volume of each update of the chart's feed. It also calculates volume delta for the bar. As it calculates from realtime information, it will not display information on historical bars.
█ FEATURES
Calculations
Each new line in the tape displays the last price/volume update from the TradingView feed that's building your chart. These updates do not necessarily correspond to ticks from the originating broker/exchange's matching engine. Multiple broker/exchange ticks are often aggregated in one chart update.
The script first determines if price has moved up or down since the last update. The polarity of the price change, in turn, determines the polarity of the volume for that specific update. If price does not move between consecutive updates, then the last known polarity is used. Using this method, we can calculate a running volume delta accumulation for the bar, which becomes the bar's final volume delta value when the bar closes (you can inspect values of elapsed realtime bars in the Data Window or the indicator's values). Note that these values will all reset if the script re-executes because of a change in inputs or a chart refresh.
While this method of calculating volume delta is not perfect, it is currently the most precise way of calculating volume delta available on TradingView at the moment. Calculating more precise results would require scripts to have access to bid/ask levels from any chart timeframe. Charts at seconds timeframes do use exchange/broker ticks when the feeds you are using allow for it, and this indicator will run on them, but tick data is not yet available from higher timeframes, for now. Also note that the method used in this script is far superior to the intrabar inspection technique used on historical bars in my other "Delta Volume" indicators. This is because volume delta here is calculated from many more realtime updates than the available intrabars in history.
Inputs
You can use the script's inputs to configure:
• The number of lines displayed in the tape.
• If new lines appear at the top or bottom.
• If you want to hide lines with low volume.
• The precision of volume values.
• The size of the text and the colors used to highlight either the tape's text or background.
• The position where you want the tape on your chart.
• Conditions triggering three different markers.
Display
Deltas are shown at the bottom of the tape. They are reset on each bar. Time delta displays the time elapsed since the beginning of the bar, on intraday timeframes only. Contrary to the price change display by TradingView at the top left of charts, which is calculated from the close of the previous bar, the price delta in the tape is calculated from the bar's open, because that's the information used in the calculation of volume delta. The time will become orange when volume delta's polarity diverges from that of the bar. The volume delta value represents the current, cumulative value for the bar. Its color reflects its polarity.
When new realtime bars appear on the chart, a ↻ symbol will appear before the volume value in tape lines.
Markers
There are three types of markers you can choose to display:
• Marker 1 on volume bumps. A bump is defined as two consecutive and increasing/decreasing plus/minus delta volume values,
when no divergence between the polarity of delta volume and the bar occurs on the second bar.
• Marker 2 on volume delta for the bar exceeding a limit of your choice when there is no divergence between the polarity of delta volume and the bar. These trigger at the bar's close.
• Marker 3 on tape lines with volume exceeding a threshold. These trigger in realtime. Be sure to set a threshold high enough so that it doesn't generate too many alerts.
These markers will only display briefly under the bar, but another marker appears next to the relevant line in the tape.
The marker conditions are used to trigger alerts configured on the script. Alert messages will mention the marker(s) that triggered the specific alert event, along with the relevant volume value that triggered the marker. If more than one marker triggers a single alert, they will overprint under the bar, which can make it difficult to distinguish them.
For more detailed on-chart analysis of realtime volume delta, see my Delta Volume Realtime Action .
█ NOTES FOR CODERS
This script showcases two new Pine features:
• Tables, which allow Pine programmers to display tabular information in fixed locations of the chart. The tape uses this feature.
See the Pine User Manual's page on Tables for more information.
• varip -type variables which we can use to save values between realtime updates.
See the " Using `varip` variables " publication by PineCoders for more information.

Average Directional Index + ΔDI± (Delta)Average Directional Index (ADX) and Difference between DI+ and DI- (ΔDI±), I call it Delta for short.
The idea explained:
ADX is a common indicator for analysing trend strength. Values over 25 usually indicate the symbol is in "trend mode", meaning there is a lot of momentum, upwards or downwards, - while values under 25 suggest it is in "range mode", the price moves sideways, lacking energy. Note that this indicator is not volume-based.
I moved the graph (red) down 25 points; this version shows positive values in "trend mode" (>25), and negative values in "range mode" (<25). The line sits at 0. The underlying code for the ADX is basically identical to the official TradingView built-in version.
Now the exciting part: DI+ and DI- are used to calculate the ADX. They are sometimes included in the ADX indicator chart, I included a version that shows them in the graphic, at the bottom. Traditionally, DI+ (green) crossing DI- (dark red) from below shows the beginning of an upward trend, and therefore a good LONG entry position. However, I noticed that this is usually not the case: this method responds very slowly to the actual price movement. At the point the indicator tells you to enter, the trend is usually already exhausted.
I found a better way to use this data; instead of waiting for both graphs to cross, meaning the difference in their respective values is 0, we look for the greatest possible difference. That is what the purple graph of my indicator shows (ΔDI±). It utilizes the zero-line we already created for the ADX. High positive values declare that the DI+ is much greater than the DI-, and vice versa. Delta is the greek letter used in mathematics for difference, so that is what I call this indicator.
How to use it:
When you look at the graph, low Delta values seem to be good entry points for LONG positions, high Delta values good exits. This is similar to how RSI and CCI work, which is why included them in the chart above (). However, this is only reliable, when the ADX is above 25, or 0 in this version, indicating the symbol is in "trend mode". This is important .
When you look at the examples in the chart, you can confirm that. The marked candles show good entry and exit points, with Delta being notably low/high (±25 seems to be a good threshold, the dashed lines sit at +30/-30), and the ADX above 0 (25). Now, you might have noticed that around mid-december the Delta actually registers the highest value for this symbol in the given time frame, indicating a strong SHORT after a steep climb. But, importantly , the ADX is not in "trend mode" as required for a clear signal, it is in "range mode": the price discovers this new level and takes a few days to get used to it. It does not fall. This shows why only the combination of both Delta and ADX gives desirable results.
I noticed that this seems to work best for 1D and 1H candles; if you find any other time frames or scenarios, let me know!
PLEASE NOTE THAT THIS IS BASED ON PERSONAL, EMPIRICAL OBSERVATIONS. PAST RESULTS DO NOT GUARANTEE SUCCESS IN THE FUTURE. DO NOT TAKE THIS AS INVESTMENT ADVICE!
Thanks to TradingView and robertkowalski for providing the basis on which the code is built. Credit goes to the appropriate developers/owners.
()
Let me know if you make any other observations, or find other ways to use the data!

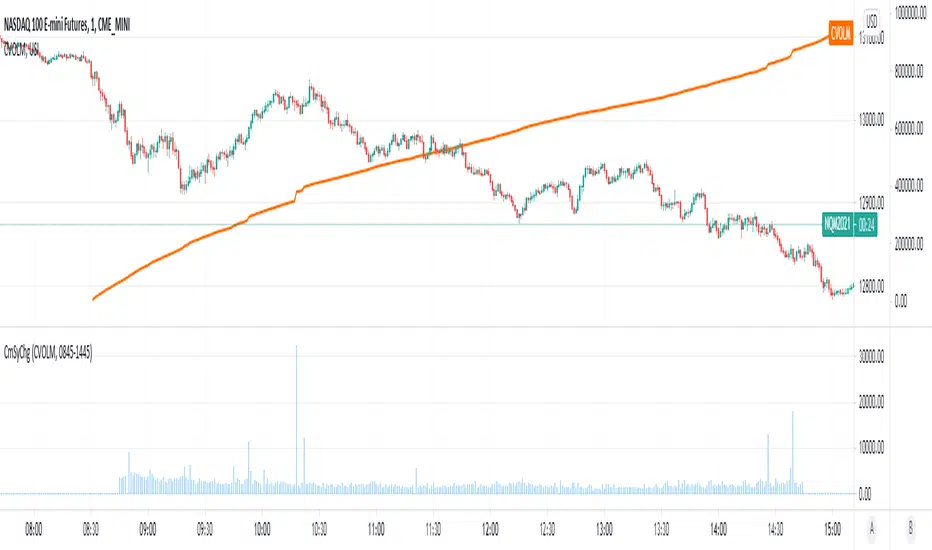
Cumulative Symbol ChangeSome symbols in trading view are cumulative - meaning they increment continuously throughout the trading day and are reset to 0 at the new trading day.
For example USI:CVOLM (Call Volume in Miami).
This script subtracts the current cumulative value from the prior cumulative value, so the change/delta in the cumulative value can be determined bar-by-bar.
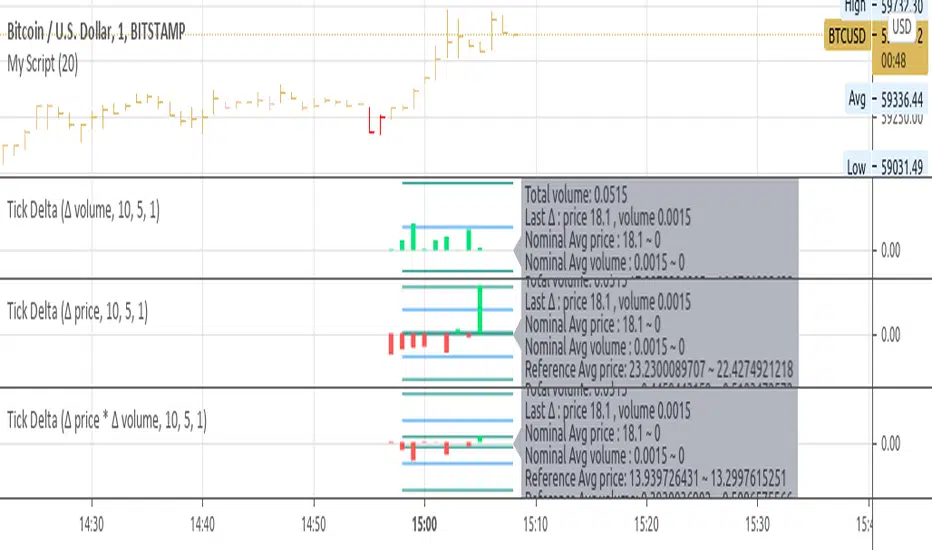
Tick Delta VolumeExperimental:
this script only works on live updating bars(market open and live), the longer it runs the more accurate it will be.
displays:
- total intrabar volume processed(may not be equal to volume).
- last delta tick change in volume.
- this bar delta avg and stdev per tick.
- a overall of all live candles processed avg and stdev of the deltas processed.
Cumulative Volume DeltaCumulative Delta Volume is one of the key analysis in figuring out the Volume Price Action dependencies
Its very Intuitive in nature,
The below image shows how it is computed!
Enjoy

Delta Volume Weighted - IntradayResets at the start of the day's session (9:50 am on the ASX).
Takes the first candle and checks if its a green candle (close > open), and adds the volume to a total (which starts at 0 at the start of the day).
Subtracts it if the candles in red.
Continues to do this along with all the candles.
The volume is also multiplied by the difference between open and close so that large candles with large volume have more weight and move the indicator more.

Perp vs Spot Delta (Bybit-CB)Simple script showing the delta of Bybit BTCUSD perp vs Coinbase BTCUSD spot. Orange positive candles show bybit is higher, blue negative candles show Coinbase is higher.

Delta Volume v2.1 by kernel_phiOld Version:
The source code of this script is now open. Feel free to modify it.
*** Not real-time. The indicator will be calculated only after a bar is closed. ***

Delta Volume Columns Pro [LucF]█ OVERVIEW
This indicator displays volume delta information calculated with intrabar inspection on historical bars, and feed updates when running in realtime. It is designed to run in a pane and can display either stacked buy/sell volume columns or a signal line which can be calculated and displayed in many different ways.
Five different models are offered to reveal different characteristics of the calculated volume delta information. Many options are offered to visualize the calculations, giving you much leeway in morphing the indicator's visuals to suit your needs. If you value delta volume information, I hope you will find the time required to master Delta Volume Columns Pro well worth the investment. I am confident that if you combine a proper understanding of the indicator's information with an intimate knowledge of the volume idiosyncrasies on the markets you trade, you can extract useful market intelligence using this tool.
█ WARNINGS
1. The indicator only works on markets where volume information is available,
Please validate that your symbol's feed carries volume information before asking me why the indicator doesn't plot values.
2. When you refresh your chart or re-execute the script on the chart, the indicator will repaint because elapsed realtime bars will then recalculate as historical bars.
3. Because the indicator uses different modes of calculation on historical and realtime bars, it's critical that you understand the differences between them. Details are provided further down.
4. Calculations using intrabar inspection on historical bars can only be done from some chart timeframes. See further down for a list of supported timeframes.
If the chart's timeframe is not supported, no historical volume delta will display.
█ CONCEPTS
Chart bars
Three different types of bars are used in charts:
1. Historical bars are bars that have already closed when the script executes on them.
2. The realtime bar is the current, incomplete bar where a script is running on an open market. There is only one active realtime bar on your chart at any given time.
The realtime bar is where alerts trigger.
3. Elapsed realtime bars are bars that were calculated when they were realtime bars but have since closed.
When a script re-executes on a chart because the browser tab is refreshed or some of its inputs are changed, elapsed realtime bars are recalculated as historical bars.
Why does this indicator use two modes of calculation?
Historical bars on TradingView charts contain OHLCV data only, which is insufficient to calculate volume delta on them with any level of precision. To mine more detailed information from those bars we look at intrabars , i.e., bars from a smaller timeframe (we call it the intrabar timeframe ) that are contained in one chart bar. If your chart Is running at 1D on a 24x7 market for example, most 1D chart bars will contain 24 underlying 1H bars in their dilation. On historical bars, this indicator looks at those intrabars to amass volume delta information. If the intrabar is up, its volume goes in the Buy bin, and inversely for the Sell bin. When price does not move on an intrabar, the polarity of the last known movement is used to determine in which bin its volume goes.
In realtime, we have access to price and volume change for each update of the chart. Because a 1D chart bar can be updated tens of thousands of times during the day, volume delta calculations on those updates is much more precise. This precision, however, comes at a price:
— The script must be running on the chart for it to keep calculating in realtime.
— If you refresh your chart you will lose all accumulated realtime calculations on elapsed realtime bars, and the realtime bar.
Elapsed realtime bars will recalculate as historical bars, i.e., using intrabar inspection, and the realtime bar's calculations will reset.
When the script recalculates elapsed realtime bars as historical bars, the values on those bars will change, which means the script repaints in those conditions.
— When the indicator first calculates on a chart containing an incomplete realtime bar, it will count ALL the existing volume on the bar as Buy or Sell volume,
depending on the polarity of the bar at that point. This will skew calculations for that first bar. Scripts have no access to the history of a realtime bar's previous updates,
and intrabar inspection cannot be used on realtime bars, so this is the only to go about this.
— Even if alerts only trigger upon confirmation of their conditions after the realtime bar closes, they are repainting alerts
because they would perhaps not have calculated the same way using intrabar inspection.
— On markets like stocks that often have different EOD and intraday feeds and volume information,
the volume's scale may not be the same for the realtime bar if your chart is at 1D, for example,
and the indicator is using an intraday timeframe to calculate on historical bars.
— Any chart timeframe can be used in realtime mode, but plots that include moving averages in their calculations may require many elapsed realtime bars before they can calculate.
You might prefer drastically reducing the periods of the moving averages, or using the volume columns mode, which displays instant values, instead of the line.
Volume Delta Balances
This indicator uses a variety of methods to evaluate five volume delta balances and derive other values from those balances. The five balances are:
1 — On Bar Balance : This is the only balance using instant values; it is simply the subtraction of the Sell volume from the Buy volume on the bar.
2 — Average Balance : Calculates a distinct EMA for both the Buy and Sell volumes, and subtracts the Sell EMA from the Buy EMA.
3 — Momentum Balance : Starts by calculating, separately for both Buy and Sell volumes, the difference between the same EMAs used in "Average Balance" and
an SMA of double the period used for the "Average Balance" EMAs. The difference for the Sell side is subtracted from the difference for the Buy side,
and an RSI of that value is calculated and brought over the −50/+50 scale.
4 — Relative Balance : The reference values used in the calculation are the Buy and Sell EMAs used in the "Average Balance".
From those, we calculate two intermediate values using how much the instant Buy and Sell volumes on the bar exceed their respective EMA — but with a twist.
If the bar's Buy volume does not exceed the EMA of Buy volume, a zero value is used. The same goes for the Sell volume with the EMA of Sell volume.
Once we have our two intermediate values for the Buy and Sell volumes exceeding their respective MA, we subtract them. The final "Relative Balance" value is an ALMA of that subtraction.
The rationale behind using zero values when the bar's Buy/Sell volume does not exceed its EMA is to only take into account the more significant volume.
If both instant volume values exceed their MA, then the difference between the two is the signal's value.
The signal is called "relative" because the intermediate values are the difference between the instant Buy/Sell volumes and their respective MA.
This balance flatlines when the bar's Buy/Sell volumes do not exceed their EMAs, which makes it useful to spot areas where trader interest dwindles, such as consolidations.
The smaller the period of the final value's ALMA, the more easily you will see the balance flatline. These flat zones should be considered no-trade zones.
5 — Percent Balance : This balance is the ALMA of the ratio of the "On Bar Balance" value, i.e., the volume delta balance on the bar (which can be positive or negative),
over the total volume for that bar.
From the balances and marker conditions, two more values are calculated:
1 — Marker Bias : It sums the up/down (+1/‒1) occurrences of the markers 1 to 4 over a period you define, so it ranges from −4 to +4, times the period.
Its calculation will depend on the modes used to calculate markers 3 and 4.
2 — Combined Balances : This is the sum of the bull/bear (+1/−1) states of each of the five balances, so it ranges from −5 to +5.
█ FEATURES
The indicator has two main modes of operation: Columns and Line .
Columns
• In Columns mode you can display stacked Buy/Sell volume columns.
• The buy section always appears above the centerline, the sell section below.
• The top and bottom sections can be colored independently using eight different methods.
• The EMAs of the Buy/Sell values can be displayed (these are the same EMAs used to calculate the "Average Balance").
Line
• Displays one of seven signals: the five balances or one of two complementary values, i.e., the "Marker Bias" or the "Combined Balances".
• You can color the line and its fill using independent calculation modes to pack more information in the display.
You can thus appraise the state of 3 different values using the line itself, its color and the color of its fill.
• A "Divergence Levels" feature will use the line to automatically draw expanding levels on divergence events.
Default settings
Using the indicator's default settings, this is the information displayed:
• The line is calculated on the "Average Balance".
• The line's color is determined by the bull/bear state of the "Percent Balance".
• The line's fill gradient is determined by the advances/declines of the "Momentum Balance".
• The orange divergence dots are calculated using discrepancies between the polarity of the "On Bar Balance" and the chart's bar.
• The divergence levels are determined using the line's level when a divergence occurs.
• The background's fill gradient is calculated on advances/declines of the "Marker Bias".
• The chart bars are colored using advances/declines of the "Relative Balance". Divergences are shown in orange.
• The intrabar timeframe is automatically determined from the chart's timeframe so that a minimum of 50 intrabars are used to calculate volume delta on historical bars.
Alerts
The configuration of the marker conditions explained further is what determines the conditions that will trigger alerts created from this script. Note that simply selecting the display of markers does not create alerts. To create an alert on this script, you must use ALT-A from the chart. You can create multiple alerts triggering on different conditions from this same script; simply configure the markers so they define the trigger conditions for each alert before creating the alert. The configuration of the script's inputs is saved with the alert, so from then on you can change them without affecting the alert. Alert messages will mention the marker(s) that triggered the specific alert event. Keep in mind, when creating alerts on small chart timeframes, that discrepancies between alert triggers and markers displayed on your chart are to be expected. This is because the alert and your chart are running two distinct instances of the indicator on different servers and different feeds. Also keep in mind that while alerts only trigger on confirmed conditions, they are calculated using realtime calculation mode, which entails that if you refresh your chart and elapsed realtime bars recalculate as historical bars using intrabar inspection, markers will not appear in the same places they appeared in realtime. So it's important to understand that even though the alert conditions are confirmed when they trigger, these alerts will repaint.
Let's go through the sections of the script's inputs.
Columns
The size of the Buy/Sell columns always represents their respective importance on the bar, but the coloring mode for tops and bottoms is independent. The default setup uses a standard coloring mode where the Buy/Sell columns are always in the bull/bear color with a higher intensity for the winning side. Seven other coloring modes allow you to pack more information in the columns. When choosing to color the top columns using a bull/bear gradient on "Average Balance", for example, you will have bull/bear colored tops. In order for the color of the bottom columns to continue to show the instant bar balance, you can then choose the "On Bar Balance — Dual Solid Colors" coloring mode to make those bars the color of the winning side for that bar. You can display the averages of the Buy and Sell columns. If you do, its coloring is controlled through the "Line" and "Line fill" sections below.
Line and Line fill
You can select the calculation mode and the thickness of the line, and independent calculations to determine the line's color and fill.
Zero Line
The zero line can display dots when all five balances are bull/bear.
Divergences
You first select the detection mode. Divergences occur whenever the up/down direction of the signal does not match the up/down polarity of the bar. Divergences are used in three components of the indicator's visuals: the orange dot, colored chart bars, and to calculate the divergence levels on the line. The divergence levels are dynamic levels that automatically build from the line's values on divergence events. On consecutive divergences, the levels will expand, creating a channel. This implementation of the divergence levels corresponds to my view that divergences indicate anomalies, hesitations, points of uncertainty if you will. It precludes any attempt to identify a directional bias to divergences. Accordingly, the levels merely take note of divergence events and mark those points in time with levels. Traders then have a reference point from which they can evaluate further movement. The bull/bear/neutral colors used to plot the levels are also congruent with this view in that they are determined by the line's position relative to the levels, which is how I think divergences can be put to the most effective use. One of the coloring modes for the line's fill uses advances/declines in the line after divergence events.
Background
The background can show a bull/bear gradient on six different calculations. As with other gradients, you can adjust its brightness to make its importance proportional to how you use it in your analysis.
Chart bars
Chart bars can be colored using seven different methods. You have the option of emptying the body of bars where volume does not increase, as does my TLD indicator, and you can choose whether you want to show divergences.
Intrabar Timeframe
This is the intrabar timeframe that will be used to calculate volume delta using intrabar inspection on historical bars. You can choose between four modes. The three "Auto-steps" modes calculate, from the chart's timeframe, the intrabar timeframe where the said number of intrabars will make up the dilation of chart bars. Adjustments are made for non-24x7 markets. "Fixed" mode allows you to select the intrabar timeframe you want. Checking the "Show TF" box will display in the lower-right corner the intrabar timeframe used at any given moment. The proper selection of the intrabar timeframe is important. It must achieve maximal granularity to produce precise results while not unduly slowing down calculations, or worse, causing runtime errors. Note that historical depth will vary with the intrabar timeframe. The smaller the timeframe, the shallower historical plots you will be.
Markers
Markers appear when the required condition has been confirmed on a closed bar. The configuration of the markers when you create an alert is what determines when the alert will trigger. Five markers are available:
• Balances Agreement : All five balances are either bullish or bearish.
• Double Bumps : A double bump is two consecutive up/down bars with +/‒ volume delta, and rising Buy/Sell volume above its average.
• Divergence confirmations : A divergence is confirmed up/down when the chosen balance is up/down on the previous bar when that bar was down/up, and this bar is up/down.
• Balance Shifts : These are bull/bear transitions of the selected signal.
• Marker Bias Shifts : Marker bias shifts occur when it crosses into bull/bear territory.
Periods
Allows control over the periods of the different moving averages used to calculate the balances.
Volume Discrepancies
Stock exchanges do not report the same volume for intraday and daily (or higher) resolutions. Other variations in how volume information is reported can also occur in other markets, namely Forex, where volume irregularities can even occur between different intraday timeframes. This will cause discrepancies between the total volume on the bar at the chart's timeframe, and the total volume calculated by adding the volume of the intrabars in that bar's dilation. This does not necessarily invalidate the volume delta information calculated from intrabars, but it tells us that we are using partial volume data. A mechanism to detect chart vs intrabar timeframe volume discrepancies is provided. It allows you to define a threshold percentage above which the background will indicate a difference has been detected.
Other Settings
You can control here the display of the gray dot reminder on realtime bars, and the display of error messages if you are using a chart timeframe that is not greater than the fixed intrabar timeframe, when you use that mode. Disabling the message can be useful if you only use realtime mode at chart timeframes that do not support intrabar inspection.
█ RAMBLINGS
On Volume Delta
Volume is arguably the best complement to interpret price action, and I consider volume delta to be the most effective way of processing volume information. In periods of low-volatility price consolidations, volume will typically also be lower than normal, but slight imbalances in the trend of the buy/sell volume balance can sometimes help put early odds on the direction of the break from consolidation. Additionally, the progression of the volume imbalance can help determine the proximity of the breakout. I also find volume delta and the number of divergences very useful to evaluate the strength of trends. In trends, I am looking for "slow and steady", i.e., relatively low volatility and pauses where price action doesn't look like world affairs are being reassessed. In my personal mythology, this type of trend is often more resilient than high-volatility breakouts, especially when volume balance confirms the general agreement of traders signaled by the low-volatility usually accompanying this type of trend. The volume action on pauses will often help me decide between aggressively taking profits, tightening a stop or going for a longer-term movement. As for reversals, they generally occur in high-volatility areas where entering trades is more expensive and riskier. While the identification of counter-trend reversals fascinates many traders to no end, they represent poor opportunities in my view. Volume imbalances often precede reversals, but I prefer to use volume delta information to identify the areas following reversals where I can confirm them and make relatively low-cost entries with better odds.
On "Buy/Sell" Volume
Buying or selling volume are misnomers, as every unit of volume transacted is both bought and sold by two different traders. While this does not keep me from using the terms, there is no such thing as “buy only” or “sell only” volume. Trader lingo is riddled with peculiarities.
Divergences
The divergence detection method used here relies on a difference between the direction of a signal and the polarity (up/down) of a chart bar. When using the default "On Bar Balance" to detect divergences, however, only the bar's volume delta is used. You may wonder how there can be divergences between buying/selling volume information and price movement on one bar. This will sometimes be due to the calculation's shortcomings, but divergences may also occur in instances where because of order book structure, it takes less volume to increase the price of an asset than it takes to decrease it. As usual, divergences are points of interest because they reveal imbalances, which may or may not become turning points. To your pattern-hungry brain, the divergences displayed by this indicator will — as they do on other indicators — appear to often indicate turnarounds. My opinion is that reality is generally quite sobering and I have no reliable information that would tend to prove otherwise. Exercise caution when using them. Consequently, I do not share the overwhelming enthusiasm of traders in identifying bullish/bearish divergences. For me, the best course of action when a divergence occurs is to wait and see what happens from there. That is the rationale underlying how my divergence levels work; they take note of a signal's level when a divergence occurs, and it's the signal's behavior from that point on that determines if the post-divergence action is bullish/bearish.
Superfluity
In "The Bed of Procrustes", Nassim Nicholas Taleb writes: To bankrupt a fool, give him information . This indicator can display lots of information. While learning to use a new indicator inevitably requires an adaptation period where we put it through its paces and try out all its options, once you have become used to it and decide to adopt it, rigorously eliminate the components you don't use and configure the remaining ones so their visual prominence reflects their relative importance in your analysis. I tried to provide flexible options for traders to control this indicator's visuals for that exact reason — not for window dressing.
█ LIMITATIONS
• This script uses a special characteristic of the `security()` function allowing the inspection of intrabars — which is not officially supported by TradingView.
It has the advantage of permitting a more robust calculation of volume delta than other methods on historical bars, but also has its limits.
• Intrabar inspection only works on some chart timeframes: 3, 5, 10, 15 and 30 minutes, 1, 2, 3, 4, 6, and 12 hours, 1 day, 1 week and 1 month.
The script’s code can be modified to run on other resolutions.
• When the difference between the chart’s timeframe and the intrabar timeframe is too great, runtime errors will occur. The Auto-Steps selection mechanisms should avoid this.
• All volume is not created equally. Its source, components, quality and reliability will vary considerably with sectors and instruments.
The higher the quality, the more reliably volume delta information can be used to guide your decisions.
You should make it your responsibility to understand the volume information provided in the data feeds you use. It will help you make the most of volume delta.
█ NOTES
For traders
• The Data Window shows key values for the indicator.
• While this indicator displays some of the same information calculated in my Delta Volume Columns ,
I have elected to make it a separate publication so that traders continue to have a simpler alternative available to them. Both code bases will continue to evolve separately.
• All gradients used in this indicator determine their brightness intensities using advances/declines in the signal—not their relative position in a pre-determined scale.
• Volume delta being relative, by nature, it is particularly well-suited to Forex markets, as it filters out quite elegantly the cyclical volume data characterizing the sector.
If you are interested in volume delta, consider having a look at my other "Delta Volume" indicators:
• Delta Volume Realtime Action displays realtime volume delta and tick information on the chart.
• Delta Volume Candles builds volume delta candles on the chart.
• Delta Volume Columns is a simpler version of this indicator.
For coders
• I use the `f_c_gradientRelativePro()` from the PineCoders Color Gradient Framework to build my gradients.
This function has the advantage of allowing begin/end colors for both the bull and bear colors. It also allows us to define the number of steps allowed for each gradient.
I use this to modulate the gradients so they perform optimally on the combination of the signal used to calculate advances/declines,
but also the nature of the visual component the gradient applies to. I use fewer steps for choppy signals and when the gradient is used on discrete visual components
such as volume columns or chart bars.
• I use the PineCoders Coding Conventions for Pine to write my scripts.
• I used functions modified from the PineCoders MTF Selection Framework for the selection of timeframes.
█ THANKS TO:
— The devs from TradingView's Pine and other teams, and the PineCoders who collaborate with them. They are doing amazing work,
and much of what this indicator does could not be done without their recent improvements to Pine.
— A guy called Kuan who commented on a Backtest Rookies presentation of their Volume Profile indicator using a `for` loop.
This indicator started from the intrabar inspection technique illustrated in Kuan's snippet.
— theheirophant , my partner in the exploration of the sometimes weird abysses of `security()`’s behavior at intrabar timeframes.
— midtownsk8rguy , my brilliant companion in mining the depths of Pine graphics.

Delta Volume Candles [LucF]█ OVERVIEW
This indicator plots on-chart volume delta information using candles that can replace your normal candles, tops and bottoms appended to normal candles, optional MAs of those tops and bottoms levels, a divergence channel and a chart background. The indicator calculates volume delta using intrabar analysis, meaning that it uses the lower timeframe bars constituting each chart bar.
█ CONCEPTS
Volume Delta
The volume delta concept divides a bar's volume in "up" and "down" volumes. The delta is calculated by subtracting down volume from up volume. Many calculation techniques exist to isolate up and down volume within a bar. The simplest use the polarity of interbar price changes to assign their volume to up or down slots, e.g., On Balance Volume or the Klinger Oscillator . Others such as Chaikin Money Flow use assumptions based on a bar's OHLC values. The most precise calculation method uses tick data and assigns the volume of each tick to the up or down slot depending on whether the transaction occurs at the bid or ask price. While this technique is ideal, it requires huge amounts of data on historical bars, which considerably limits the historical depth of charts and the number of symbols for which tick data is available. Furthermore, historical tick data is not yet available on TradingView.
This indicator uses intrabar analysis to achieve a compromise between the simplest and most precise methods of calculating volume delta. It is currently the most precise method usable on TradingView charts. TradingView's Volume Profile built-in indicators use it, as do the CVD - Cumulative Volume Delta Candles and CVD - Cumulative Volume Delta (Chart) indicators published from the TradingView account . My Delta Volume Channels and Volume Delta Columns Pro indicators also use intrabar analysis. Other volume delta indicators such as my Realtime 5D Profile use realtime chart updates to calculate volume delta without intrabar analysis, but that type of indicator only works in real time; they cannot calculate on historical bars.
This is the logic I use to determine the polarity of intrabars, which determines the up or down slot where its volume is added:
• If the intrabar's open and close values are different, their relative position is used.
• If the intrabar's open and close values are the same, the difference between the intrabar's close and the previous intrabar's close is used.
• As a last resort, when there is no movement during an intrabar, and it closes at the same price as the previous intrabar, the last known polarity is used.
Once all intrabars making up a chart bar have been analyzed and the up or down property of each intrabar's volume determined, the up volumes are added, and the down volumes subtracted. The resulting value is volume delta for that chart bar, which can be used as an estimate of the buying/selling pressure on an instrument. Not all markets have volume information. Without it, this indicator is useless.
Intrabar analysis
Intrabars are chart bars at a lower timeframe than the chart's. The timeframe used to access intrabars determines the number of intrabars accessible for each chart bar. On a 1H chart, each chart bar of an active market will, for example, usually contain 60 bars at the lower timeframe of 1min, provided there was market activity during each minute of the hour.
This indicator automatically calculates an appropriate lower timeframe using the chart's timeframe and the settings you use in the script's "Intrabars" section of the inputs. As it can access lower timeframes as small as seconds when available, the indicator can be used on charts at relatively small timeframes such as 1min, provided the market is active enough to produce bars at second timeframes.
The quantity of intrabars analyzed in each chart bar determines:
• The precision of calculations (more intrabars yield more precise results).
• The chart coverage of calculations (there is a 100K limit to the quantity of intrabars that can be analyzed on any chart,
so the more intrabars you analyze per chart bar, the less chart bars can be calculated by the indicator).
The information box displayed at the bottom right of the chart shows the lower timeframe used for intrabars, as well as the average number of intrabars detected for chart bars and statistics on chart coverage.
Balances
This indicator calculates five balances from volume delta values. The balances are oscillators with a zero centerline; positive values are bullish, and negative values are bearish. It is important to understand the balances as they can be used to:
• Color candle bodies.
• Calculate body and top and bottom divergences.
• Color an EMA channel.
• Color the chart's background.
• Configure markers and alerts.
The five balances are:
1 — Bar Balance : This is the only balance using instant values; it is simply the subtraction of the down volume from the up volume on the bar, so the instant volume delta for that bar.
2 — Average Balance : Calculates a distinct EMA for both the up and down volumes, and subtracts the down EMA from the up EMA.
The result is akin to MACD's histogram because it is the subtraction of two moving averages.
3 — Momentum Balance : Starts by calculating, separately for both up and down volumes, the difference between the same EMAs used in "Average Balance" and
an SMA of twice the period used for the "Average Balance" EMAs. The difference for the up side is subtracted from the difference for the down side,
and an RSI of that value is calculated and brought over the −50/+50 scale.
4 — Relative Balance : The reference values used in the calculation are the up and down EMAs used in the "Average Balance".
From those, we calculate two intermediate values using how much the instant up and down volumes on the bar exceed their respective EMA — but with a twist.
If the bar's up volume does not exceed the EMA of up volume, a zero value is used. The same goes for the down volume with the EMA of down volume.
Once we have our two intermediate values for the up and down volumes exceeding their respective MA, we subtract them. The final value is an ALMA of that subtraction.
The rationale behind using zero values when the bar's up/down volume does not exceed its EMA is to only take into account the more significant volume.
If both instant volume values exceed their MA, then the difference between the two is the signal's value.
The signal is called "relative" because the intermediate values are the difference between the instant up/down volumes and their respective MA.
This balance flatlines when the bar's up/down volumes do not exceed their EMAs, which makes it useful to spot areas where trader interest dwindles, such as consolidations.
The smaller the period of the final value's ALMA, the more easily it will flatline. These flat zones should be considered no-trade zones.
5 — Percent Balance : This balance is the ALMA of the ratio of the "Bar Balance" over the total volume for that bar.
From the balances and marker conditions, two more values are calculated:
1 — Marker Bias : This sums the up/down (+1/‒1) occurrences of the markers 1 to 4 over a period you define, so it ranges from −4 to +4, times the period.
Its calculation will depend on the modes used to calculate markers 3 and 4.
2 — Combined Balances : This is the sum of the bull/bear (+1/−1) states of each of the five balances, so it ranges from −5 to +5.
The periods for all of these balances can be configured in the "Periods" section at the bottom of the script's inputs. As you cannot see the balances on the chart, you can use my Volume Delta Columns Pro indicator in a pane; it can plot the same balances, so you will be able to analyze them.
Divergences
In the context of this indicator, a divergence is any bar where the bear/bull state of a balance (above/below its zero centerline) diverges from the polarity of a chart bar. No directional bias is assigned to divergences when they occur. Candle bodies and tops/bottoms can each be colored differently on divergences detected from distinct balances.
Divergence Channel
The divergence channel is the space between two levels (by default, the bar's open and close ) saved when divergences occur. When price (by default the close ) has breached a channel and a new divergence occurs, a new channel is created. Until that new channel is breached, bars where additional divergences occur will expand the channel's levels if the bar's price points are outside the channel.
Prices breaches of the divergence channel will change its state. Divergence channels can be in one of three different states:
• Bull (green): Price has breached the channel to the upside.
• Bear (red): Price has breached the channel to the downside.
• Neutral (gray): The channel has not yet been breached.
█ HOW TO USE THE INDICATOR
I do not make videos to explain how to use my indicators. I do, however, try hard to include in their description everything one needs to understand what they do. From there, it's up to you to explore and figure out if they can be useful in your trading practice. Communicating in videos what this description and the script's tooltips contain would make for very long videos that would likely exceed the attention span of most people who find this description too long. There is no quick way to understand an indicator such as this one because it uses many different concepts and has quite a bit of settings one can use to modify its visuals and behavior — thus how one uses it. I will happily answer questions on the inner workings of the indicator, but I do not answer questions like "How do I trade using this indicator?" A useful answer to that question would require an in-depth analysis of who you are, your trading methodology and objectives, which I do not have time for. I do not teach trading.
Start by loading the indicator on an active chart containing volume information. See here if you need help.
The default configuration displays:
• Normal candles where the bodies are only colored if the bar's volume has increased since the last bar.
If you want to use this indicator's candles, you may want to disable your chart's candles by clicking the eye icon to the right of the symbol's name in the top left of the chart.
• A top or bottom appended to the normal candles. It represents the difference between up and down volume for that bar
and is positioned at the top or bottom, depending on its polarity. If up volume is greater than down volume, a top is displayed. If down volume is greater, a bottom is plotted.
The size of tops and bottoms is determined by calculating a factor which is the proportion of volume delta over the bar's total volume.
That factor is then used to calculate the top or bottom size relative to a baseline of the average candle body size of the last 100 bars.
• An information box in the bottom right displaying intrabar and chart coverage information.
• A light red background when the intrabar volume differs from the chart's volume by more than 1%.
The script's inputs contain tooltips explaining most of the fields. I will not repeat them here. Following is a brief description of each section of the indicator's inputs which will give you an idea of what the indicator can do:
Normal Candles is where you configure the replacement candles plotted by the script. You can choose from different coloring schemes for their bodies and specify a unique color for bodies where a divergence calculated using the method you choose occurs.
Volume Tops & Botttoms is where you configure the display of tops and bottoms, and their EMAs. The EMAs are calculated from the high point of tops and the low point of bottoms. They can act as a channel to evaluate price, and you can choose to color the channel using a gradient reflecting the advances/declines in the balance of your choice.
Divergence Channel is where you set up the appearance and behavior of the divergence channel. These areas represent levels where price and volume delta information do not converge. They can be interpreted as regions with no clear direction from where one will look for breaches. You can configure the channel to take into account one or both types of divergences you have configured for candle bodies and tops/bottoms.
Background allows you to configure a gradient background color that reflects the advances/declines in the balance of your choice. You can use this to provide context to the volume delta values from bars. You can also control the background color displayed on volume discrepancies between the intrabar and the chart's timeframe.
Intrabars is where you choose the calculation mode determining the lower timeframe used to access intrabars. The indicator uses the chart's timeframe and the type of market you are on to calculate the lower timeframe. Your setting there should reflect which compromise you prefer between the precision of calculations and chart coverage. This is also where you control the display of the information box in the lower right corner of the chart.
Markers allows you to control the plotting of chart markers on different conditions. Their configuration determines when alerts generated from the indicator will fire. Note that in order to generate alerts from this script, they must be created from your chart. See this Help Center page to learn how. Only the last 500 markers will be visible on the chart, but this will not affect the generation of alerts.
Periods is where you configure the periods for the balances and the EMAs used in the indicator.
The raw values calculated by this script can be inspected using the Data Window.
█ INTERPRETATION
Rightly or wrongly, volume delta is considered by many a useful complement to the interpretation of price action. I use it extensively in an attempt to find convergence between my read of volume delta and price movement — not so much as a predictor of future price movement. No system or person can predict the future. Accordingly, I consider people who speak or act as if they know the future with certainty to be dangerous to themselves and others; they are charlatans, imprudent or blissfully ignorant.
I try to avoid elaborate volume delta interpretation schemes involving too many variables and prefer to keep things simple:
• Trends that have more chances of continuing should be accompanied by VD of the same polarity.
In trends, I am looking for "slow and steady". I work from the assumption that traders and systems often overreact, which translates into unproductive volatility.
Wild trends are more susceptible to overreactions.
• I prefer steady VD values over wildly increasing ones, as large VD increases often come with increased price volatility, which can backfire.
Large VD values caused by stopping volume will also often occur on trend reversals with abnormally high candles.
• Prices escaping divergence channels may be leading a trend in that direction, although there is no telling how long that trend will last; could be just a few bars or hundreds.
When price is in a channel, shifts in VD balances can sometimes give us an idea of the direction where price has the most chance of breaking.
• Dwindling VD will often indicate trend exhaustion and predate reversals by many bars, but the problem is that mere pauses in a trend will often produce the same behavior in VD.
I think it is too perilous to infer rigidly from VD decreases.
Divergence Channel
Here I have configured the divergence channels to be visible. First, I set the bodies to display divergences on the default Bar Balance. They are indicated by yellow bodies. Then I activated the divergence channels by choosing to draw levels on body divergences and checked the "Fill" checkbox to fill the channel with the same color as the levels. The divergence channel is best understood as a direction-less area from where a breach can be acted on if other variables converge with the breach's direction:
Tops and Bottoms EMAs
I find these EMAs rather interesting. They have no equivalent elsewhere, as they are calculated from the top and bottom values this indicator plots. The only similarity they have with volume-weighted MAs, including VWAP, is that they use price and volume. This indicator's Tops and Bottoms EMAs, however, use the price and volume delta. While the channel differs from other channels in how it is calculated, it can be used like others, as a baseline from which to evaluate price movement or, alternatively, as stop levels. Remember that you can change the period used for the EMAs in the "Periods" section of the inputs.
This chart shows the EMAs in action, filled with a gradient representing the advances/decline from the Momentum balance. Notice the anomaly in the chart's latest bars where the Momentum balance gradient has been indicating a bullish bias for some time, during which price was mostly below the EMAs. Price has just broken above the channel on positive VD. My interpretation of this situation would be that it is a risky opportunity for a long trade in the larger context where the market has been in a downtrend since the 5th. Intrepid traders choosing to enter here could do so with a "make or break" tight stop that will minimize their losses should the market continue its downtrend while hopefully preserving the potential upside of price continuing on the longer-term uptrend prevalent since the 28th:
█ NOTES
Volume
If you use indicators such as this one which depends on volume information, it is important to realize that the volume data they consume comes from data feeds, and that all data feeds are NOT created equally. Those who create the data feeds we use must make decisions concerning the nature of the transactions they tally and the way they are tallied in each feed, and these decisions affect the nature of our volume data. My Volume X-ray publication discusses some of the reasons why volume information from different timeframes, brokers/exchanges or sectors may vary considerably. I encourage you to read it. This indicator's display of a warning through a background color on volume discrepancies between the timeframe used to access intrabars and the chart's timeframe is an attempt to help you realize these variations in feeds. Don't take things for granted, and understand that the quality of a given feed's volume information affects the quality of the results this indicator calculates.
Markets as ecosystems
I believe it is perilous to think that behavioral patterns you discover in one market through the lens of this or any other indicator will necessarily port to other markets. While this may sometimes be the case, it will often not. Why is that? Because each market is its own ecosystem. As cities do, all markets share some common characteristics, but they also all have their idiosyncrasies. A proportion of a city's inhabitants is always composed of outsiders who come and go, but a core population of regulars and systems is usually the force that actually defines most of the city's observable characteristics. I believe markets work somewhat the same way; they may look the same, but if you live there for a while and pay attention, you will notice the idiosyncrasies. Some things that work in some markets will, accordingly, not work in others. Please keep that in mind when you draw conclusions.
On Up/Down or Buy/Sell Volume
Buying or selling volume are misnomers, as every unit of volume transacted is both bought and sold by two different traders. While this does not keep me from using the terms, there is no such thing as “buy only” or “sell only” volume. Trader lingo is riddled with peculiarities. Without access to order book information, traders work with the assumption that when price moves up during a bar, there was more buying pressure than selling pressure, just as when buy market orders take out limit ask orders in the order book at successively higher levels. The built-in volume indicator available on TradingView uses this logic to color the volume columns green or red. While this script’s calculations are more precise because it analyses intrabars to calculate its information, it uses pretty much the same imperfect logic. Until Pine scripts can have access to how much volume was transacted at the bid/ask prices, our volume delta calculations will remain a mere proxy.
Repainting
• The values calculated on the realtime bar will update as new information comes from the feed.
• Historical values may recalculate if the historical feed is updated or when calculations start from a new point in history.
• Markers and alerts will not repaint as they only occur on a bar's close. Keep this in mind when viewing markers on historical bars,
where one could understandably and incorrectly assume they appear at the bar's open.
To learn more about repainting, see the Pine Script™ User Manual's page on the subject .
Superfluity
In "The Bed of Procrustes", Nassim Nicholas Taleb writes: To bankrupt a fool, give him information . This indicator can display a lot of information. The inevitable adaptation period you will need to figure out how to use it should help you eliminate all the visuals you do not need. The more you eliminate, the easier it will be to focus on those that are the most useful to your trading practice. Don't be a fool.
█ THANKS
Thanks to alexgrover for his Dekidaka-Ashi indicator. His volume plots on candles were the inspiration for my top/bottom plots.
Kudos to PineCoders for their libraries. I use two of them in this script: Time and lower_tf .
The first versions of this script used functionality that I would not have known about were it not for these two guys:
— A guy called Kuan who commented on a Backtest Rookies presentation of their Volume Profile indicator.
— theheirophant , my partner in the exploration of the sometimes weird abysses of request.security() ’s behavior at lower timeframes.
