LibPvotLibrary "LibPvot"
This is a library for advanced technical analysis, specializing
in two core areas: the detection of price-oscillator
divergences and the analysis of market structure. It provides
a back-end engine for signal detection and a toolkit for
indicator plotting.
Key Features:
1. **Complete Divergence Suite (Class A, B, C):** The engine detects
all three major types of divergences, providing a full spectrum of
analytical signals:
- **Regular (A):** For potential trend reversals.
- **Hidden (B):** For potential trend continuations.
- **Exaggerated (C):** For identifying weakness at double tops/bottoms.
2. **Advanced Signal Filtering:** The detection logic uses a
percentage-based price tolerance (`prcTol`). This feature
enables the practical detection of Exaggerated divergences
(which rarely occur at the exact same price) and creates a
"dead zone" to filter insignificant noise from triggering
Regular divergences.
3. **Pivot Synchronization:** A bar tolerance (`barTol`) is used
to reliably match price and oscillator pivots that do not
align perfectly on the same bar, preventing missed signals.
4. **Signal Invalidation Logic:** Features two built-in invalidation
rules:
- An optional `invalidate` parameter automatically terminates
active divergences if the price or the oscillator breaks
the level of the confirming pivot.
- The engine also discards 'half-pivots' (e.g., a price pivot)
if a corresponding oscillator pivot does not appear within
the `barTol` window.
5. **Stateful Plotting Helpers:** Provides helper functions
(`bullDivPos` and `bearDivPos`) that abstract away the
state management issues of visualizing persistent signals.
They generate gap-free, accurately anchored data series
ready to be used in `plotshape` functions, simplifying
indicator-side code.
6. **Rich Data Output:** The core detection functions (`bullDiv`, `bearDiv`)
return a comprehensive 9-field data tuple. This includes the
boolean flags for each divergence type and the precise
coordinates (price, oscillator value, bar index) of both the
starting and the confirming pivots.
7. **Market Structure & Trend Analysis:** Includes a
`marketStructure` function to automatically identify pivot
highs/lows, classify their relationship (HH, LH, LL, HL),
detect structure breaks, and determine the current trend
state (Up, Down, Neutral) based on pivot sequences.
---
**DISCLAIMER**
This library is provided "AS IS" and for informational and
educational purposes only. It does not constitute financial,
investment, or trading advice.
The author assumes no liability for any errors, inaccuracies,
or omissions in the code. Using this library to build
trading indicators or strategies is entirely at your own risk.
As a developer using this library, you are solely responsible
for the rigorous testing, validation, and performance of any
scripts you create based on these functions. The author shall
not be held liable for any financial losses incurred directly
or indirectly from the use of this library or any scripts
derived from it.
bullDiv(priceSrc, oscSrc, leftLen, rightLen, depth, barTol, prcTol, persist, invalidate)
Detects bullish divergences (Regular, Hidden, Exaggerated) based on pivot lows.
Parameters:
priceSrc (float) : series float Price series to check for pivots (e.g., `low`).
oscSrc (float) : series float Oscillator series to check for pivots.
leftLen (int) : series int Number of bars to the left of a pivot (default 5).
rightLen (int) : series int Number of bars to the right of a pivot (default 5).
depth (int) : series int Maximum number of stored pivot pairs to check against (default 2).
barTol (int) : series int Maximum bar distance allowed between the price pivot and the oscillator pivot (default 3).
prcTol (float) : series float The percentage tolerance for comparing pivot prices. Used to detect Exaggerated
divergences and filter out market noise (default 0.05%).
persist (bool) : series bool If `true` (default), the divergence flag stays active for the entire duration of the signal.
If `false`, it returns a single-bar pulse on detection.
invalidate (bool) : series bool If `true` (default), terminates an active divergence if price or oscillator break
below the confirming pivot low.
Returns: A tuple containing comprehensive data for a detected bullish divergence.
regBull series bool `true` if a Regular bullish divergence (Class A) is active.
hidBull series bool `true` if a Hidden bullish divergence (Class B) is active.
exgBull series bool `true` if an Exaggerated bullish divergence (Class C) is active.
initPivotPrc series float Price value of the initial (older) pivot low.
initPivotOsz series float Oscillator value of the initial pivot low.
initPivotBar series int Bar index of the initial pivot low.
lastPivotPrc series float Price value of the last (confirming) pivot low.
lastPivotOsz series float Oscillator value of the last pivot low.
lastPivotBar series int Bar index of the last pivot low.
bearDiv(priceSrc, oscSrc, leftLen, rightLen, depth, barTol, prcTol, persist, invalidate)
Detects bearish divergences (Regular, Hidden, Exaggerated) based on pivot highs.
Parameters:
priceSrc (float) : series float Price series to check for pivots (e.g., `high`).
oscSrc (float) : series float Oscillator series to check for pivots.
leftLen (int) : series int Number of bars to the left of a pivot (default 5).
rightLen (int) : series int Number of bars to the right of a pivot (default 5).
depth (int) : series int Maximum number of stored pivot pairs to check against (default 2).
barTol (int) : series int Maximum bar distance allowed between the price pivot and the oscillator pivot (default 3).
prcTol (float) : series float The percentage tolerance for comparing pivot prices. Used to detect Exaggerated
divergences and filter out market noise (default 0.05%).
persist (bool) : series bool If `true` (default), the divergence flag stays active for the entire duration of the signal.
If `false`, it returns a single-bar pulse on detection.
invalidate (bool) : series bool If `true` (default), terminates an active divergence if price or oscillator break
above the confirming pivot high.
Returns: A tuple containing comprehensive data for a detected bearish divergence.
regBear series bool `true` if a Regular bearish divergence (Class A) is active.
hidBear series bool `true` if a Hidden bearish divergence (Class B) is active.
exgBear series bool `true` if an Exaggerated bearish divergence (Class C) is active.
initPivotPrc series float Price value of the initial (older) pivot high.
initPivotOsz series float Oscillator value of the initial pivot high.
initPivotBar series int Bar index of the initial pivot high.
lastPivotPrc series float Price value of the last (confirming) pivot high.
lastPivotOsz series float Oscillator value of the last pivot high.
lastPivotBar series int Bar index of the last pivot high.
bullDivPos(regBull, hidBull, exgBull, rightLen, yPos)
Calculates the plottable data series for bullish divergences. It manages
the complex state of a persistent signal's plotting window to ensure
gap-free and accurately anchored visualization.
Parameters:
regBull (bool) : series bool The regular bullish divergence flag from `bullDiv`.
hidBull (bool) : series bool The hidden bullish divergence flag from `bullDiv`.
exgBull (bool) : series bool The exaggerated bullish divergence flag from `bullDiv`.
rightLen (int) : series int The same `rightLen` value used in `bullDiv` for correct timing.
yPos (float) : series float The series providing the base Y-coordinate for the shapes (e.g., `low`).
Returns: A tuple of three `series float` for plotting bullish divergences.
regBullPosY series float Contains the static anchor Y-value for Regular divergences where a shape should be plotted; `na` otherwise.
hidBullPosY series float Contains the static anchor Y-value for Hidden divergences where a shape should be plotted; `na` otherwise.
exgBullPosY series float Contains the static anchor Y-value for Exaggerated divergences where a shape should be plotted; `na` otherwise.
bearDivPos(regBear, hidBear, exgBear, rightLen, yPos)
Calculates the plottable data series for bearish divergences. It manages
the complex state of a persistent signal's plotting window to ensure
gap-free and accurately anchored visualization.
Parameters:
regBear (bool) : series bool The regular bearish divergence flag from `bearDiv`.
hidBear (bool) : series bool The hidden bearish divergence flag from `bearDiv`.
exgBear (bool) : series bool The exaggerated bearish divergence flag from `bearDiv`.
rightLen (int) : series int The same `rightLen` value used in `bearDiv` for correct timing.
yPos (float) : series float The series providing the base Y-coordinate for the shapes (e.g., `high`).
Returns: A tuple of three `series float` for plotting bearish divergences.
regBearPosY series float Contains the static anchor Y-value for Regular divergences where a shape should be plotted; `na` otherwise.
hidBearPosY series float Contains the static anchor Y-value for Hidden divergences where a shape should be plotted; `na` otherwise.
exgBearPosY series float Contains the static anchor Y-value for Exaggerated divergences where a shape should be plotted; `na` otherwise.
marketStructure(highSrc, lowSrc, leftLen, rightLen, srcTol)
Analyzes the market structure by identifying pivot points, classifying
their sequence (e.g., Higher Highs, Lower Lows), and determining the
prevailing trend state.
Parameters:
highSrc (float) : series float Price series for pivot high detection (e.g., `high`).
lowSrc (float) : series float Price series for pivot low detection (e.g., `low`).
leftLen (int) : series int Number of bars to the left of a pivot (default 5).
rightLen (int) : series int Number of bars to the right of a pivot (default 5).
srcTol (float) : series float Percentage tolerance to consider two pivots as 'equal' (default 0.05%).
Returns: A tuple containing detailed market structure information.
pivType series PivType The type of the most recently formed pivot (e.g., `hh`, `ll`).
lastPivHi series float The price level of the last confirmed pivot high.
lastPivLo series float The price level of the last confirmed pivot low.
lastPiv series float The price level of the last confirmed pivot (either high or low).
pivHiBroken series bool `true` if the price has broken above the last pivot high.
pivLoBroken series bool `true` if the price has broken below the last pivot low.
trendState series TrendState The current trend state (`up`, `down`, or `neutral`).
背離

CCI [Hash Adaptive]Adaptive CCI Pro: Professional Technical Analysis Indicator
The Commodity Channel Index is a momentum oscillator developed by Donald Lambert in 1980. CCI measures the relationship between an asset's price and its statistical average, identifying cyclical turns and overbought/oversold conditions. The indicator oscillates around zero, with values above +100 indicating overbought conditions and values below -100 suggesting oversold conditions.
Standard CCI Formula: (Typical Price - Moving Average) / (0.015 × Mean Deviation)
This indicator transforms the traditional CCI into a sophisticated visual analysis tool through several key enhancements:
Implements dual exponential moving average smoothing to eliminate market noise
Preserves signal integrity while reducing false signals
Adaptive smoothing responds to market volatility conditions
Dynamic Color Visualization System
Continuous gradient transitions from red (bearish momentum) to green (bullish momentum)
Real-time color intensity reflects momentum strength
Eliminates discrete color jumps for fluid visual interpretation
Adaptive Intelligence Features
Dynamic overbought/oversold thresholds adapt to market conditions
Reduces false signals during high volatility periods
Maintains sensitivity during low volatility environments
Momentum Vector Analysis
Incorporates velocity calculations for early trend identification
Crossover detection with momentum confirmation
Advanced signal filtering reduces market noise
Extreme Level Analysis
Values above +100: Strong overbought conditions, potential reversal zones
Values below -100: Strong oversold conditions, potential buying opportunities
Zero-line crossovers: Momentum shift confirmation
Optimization Parameters
CCI Period (Default: 14)
Shorter periods (10-12): Increased sensitivity, more signals
Standard periods (14-20): Balanced responsiveness and reliability
Longer periods (21-30): Reduced noise, stronger signal confirmation
Smoothing Factor (Default: 5)
Lower values (1-3): Maximum responsiveness, suitable for scalping
Medium values (4-6): Balanced approach for swing trading
Higher values (7-10): Institutional-grade smoothness for position trading
Signal Sensitivity (Default: 6)
Conservative (7-10): High-probability signals, reduced frequency
Balanced (5-6): Optimal risk-reward ratio
Aggressive (1-4): Maximum signal generation, requires additional confirmation
Strategic Implementation
Oversold reversals in red zones with momentum confirmation
Zero-line breaks with sustained color transitions
Extreme readings followed by momentum divergence
Risk Management
Use extreme levels (+100/-100) for position sizing decisions
Monitor color intensity for momentum strength assessment
Combine with price action analysis for comprehensive market view
Market Context Application
Trending markets: Focus on momentum direction and extreme readings
Range-bound markets: Utilize overbought/oversold levels for mean reversion
Volatile markets: Increase smoothing parameters and signal sensitivity
Professional Advantages
Instantaneous momentum assessment through color visualization
Reduced cognitive load compared to traditional oscillators
Professional presentation suitable for client reporting
Adaptive Technology
Self-adjusting parameters reduce manual optimization requirements
Consistent performance across varying market conditions
Advanced mathematics eliminate common CCI limitations
The Adaptive CCI Pro represents the evolution of momentum analysis, combining Lambert's foundational CCI concept with modern computational techniques to deliver institutional-grade market intelligence through an intuitive visual interface.

Smart Volume Imbalance (SVI) — Lower Panel (MNQ tuned)How to use & interpret (quick guide — tuned for MNQ)
What SVI shows
SVI > 0 — price move is directionally efficient with supportive volume (bullish smart flow).
SVI < 0 — price move is directionally efficient with selling pressure (bearish smart flow).
Large |SVI| (default threshold ±1.5) indicates institutional-strength moves worth respecting.
Absorption (orange/yellow marker): high volume but small candle body → potential smart accumulation/distribution (often precedes directional moves).
Primary signals
Entry (momentum): SVI crosses above +svThresh on pullbacks aligned with trend (use price structure to confirm).
Fade / Short: SVI falls below -svThresh at or near resistance, especially with bearish divergence.
Divergence: Price makes higher high but SVI makes lower high → likely smart-money sell; be cautious.
Default parameter reasoning for MNQ
volLen = 20, spreadLen = 20 — balances responsiveness and noise for a fast future.
normLen = 50, smoothLen = 8 — reduces tick noise but still responsive to MNQ spikes.
absorbVolMul = 1.8 — flags volume ~80% above average as significant; tweak if your data source reports higher/lower baseline.
Tuning tips
If you see too many false signals, increase normLen or smoothLen (more smoothing).
If you want earlier signals (more noise), lower smoothLen and normLen.
For lower-timeframes (1s/1m) you may need shorter SMAs; for higher-timeframes (5m+) defaults often work well.
Practical workflow
Use SVI in a separate lower panel while trading MNQ on your preferred timeframe (1m–5m are common).
Combine SVI with structure: only take bullish SVI signals above a prior structure support / after CHoCH, etc.
Watch absorption zones near highs/lows — they often signal where smart money is stepping in/out.

Mean Reversion Oscillator [Alpha Extract]An advanced composite oscillator system specifically designed to identify extreme market conditions and high-probability mean reversion opportunities, combining five proven oscillators into a single, powerful analytical framework.
By integrating multiple momentum and volume-based indicators with sophisticated extreme level detection, this oscillator provides precise entry signals for contrarian trading strategies while filtering out false reversals through momentum confirmation.
🔶 Multi-Oscillator Composite Framework
Utilizes a comprehensive approach that combines Bollinger %B, RSI, Stochastic, Money Flow Index, and Williams %R into a unified composite score. This multi-dimensional analysis ensures robust signal generation by capturing different aspects of market extremes and momentum shifts.
// Weighted composite (equal weights)
normalized_bb = bb_percent
normalized_rsi = rsi
normalized_stoch = stoch_d_val
normalized_mfi = mfi
normalized_williams = williams_r
composite_raw = (normalized_bb + normalized_rsi + normalized_stoch + normalized_mfi + normalized_williams) / 5
composite = ta.sma(composite_raw, composite_smooth)
🔶 Advanced Extreme Level Detection
Features a sophisticated dual-threshold system that distinguishes between moderate and extreme market conditions. This hierarchical approach allows traders to identify varying degrees of mean reversion potential, from moderate oversold/overbought conditions to extreme levels that demand immediate attention.
🔶 Momentum Confirmation System
Incorporates a specialized momentum histogram that confirms mean reversion signals by analyzing the rate of change in the composite oscillator. This prevents premature entries during strong trending conditions while highlighting genuine reversal opportunities.
// Oscillator momentum (rate of change)
osc_momentum = ta.mom(composite, 5)
histogram = osc_momentum
// Momentum confirmation
momentum_bullish = histogram > histogram
momentum_bearish = histogram < histogram
// Confirmed signals
confirmed_bullish = bullish_entry and momentum_bullish
confirmed_bearish = bearish_entry and momentum_bearish
🔶 Dynamic Visual Intelligence
The oscillator line adapts its color intensity based on proximity to extreme levels, providing instant visual feedback about market conditions. Background shading creates clear zones that highlight when markets enter moderate or extreme territories.
🔶 Intelligent Signal Generation
Generates precise entry signals only when the composite oscillator crosses extreme thresholds with momentum confirmation. This dual-confirmation approach significantly reduces false signals while maintaining sensitivity to genuine mean reversion opportunities.
How It Works
🔶 Composite Score Calculation
The indicator simultaneously tracks five different oscillators, each normalized to a 0-100 scale, then combines them into a smoothed composite score. This approach eliminates the noise inherent in single-oscillator analysis while capturing the consensus view of multiple momentum indicators.
// Mean reversion entry signals
bullish_entry = ta.crossover(composite, 100 - extreme_level) and composite < (100 - extreme_level)
bearish_entry = ta.crossunder(composite, extreme_level) and composite > extreme_level
// Bollinger %B calculation
bb_basis = ta.sma(src, bb_length)
bb_dev = bb_mult * ta.stdev(src, bb_length)
bb_percent = (src - bb_lower) / (bb_upper - bb_lower) * 100
🔶 Extreme Zone Identification
The system automatically identifies when markets reach statistically significant extreme levels, both moderate (65/35) and extreme (80/20). These zones represent areas where mean reversion has the highest probability of success based on historical market behavior.
🔶 Momentum Histogram Analysis
A specialized momentum histogram tracks the velocity of oscillator changes, helping traders distinguish between healthy corrections and potential trend reversals. The histogram's color-coded display makes momentum shifts immediately apparent.
🔶 Divergence Detection Framework
Built-in divergence analysis identifies situations where price and oscillator movements diverge, often signaling impending reversals. Diamond-shaped markers highlight these critical divergence patterns for enhanced pattern recognition.
🔶 Real-Time Information Dashboard
An integrated information table provides instant access to current oscillator readings, market status, and individual component values. This dashboard eliminates the need to manually check multiple indicators while trading.
🔶 Individual Component Display
Optional display of individual oscillator components allows traders to understand which specific indicators are driving the composite signal. This transparency enables more informed decision-making and deeper market analysis.
🔶 Adaptive Background Coloring
Intelligent background shading automatically adjusts based on market conditions, creating visual zones that correspond to different levels of mean reversion potential. The subtle color gradations make pattern recognition effortless.
1D
3D
🔶 Comprehensive Alert System
Multi-tier alert system covers confirmed entry signals, divergence patterns, and extreme level breaches. Each alert type provides specific context about the detected condition, enabling traders to respond appropriately to different signal strengths.
🔶 Customizable Threshold Management
Fully adjustable extreme and moderate levels allow traders to fine-tune the indicator's sensitivity to match different market volatilities and trading timeframes. This flexibility ensures optimal performance across various market conditions.
🔶 Why Choose AE - Mean Reversion Oscillator?
This indicator provides the most comprehensive approach to mean reversion trading by combining multiple proven oscillators with advanced confirmation mechanisms. By offering clear visual hierarchies for different extreme levels and requiring momentum confirmation for signals, it empowers traders to identify high-probability contrarian opportunities while avoiding false reversals. The sophisticated composite methodology ensures that signals are both statistically significant and practically actionable, making it an essential tool for traders focused on mean reversion strategies across all market conditions.

AlphaMACD - Adaptive MACD with Efficiency RatioOVERVIEW
AlphaMACD is an adaptive implementation of the classic MACD indicator that dynamically adjusts its calculation periods based on market efficiency. Unlike traditional MACD which uses fixed periods (typically 12, 26, 9), this indicator adapts its fast and slow EMA periods in real-time based on how efficiently the market is trending.
WHAT MAKES THIS ORIGINAL
This is not a simple MACD with different settings or colors. The core innovation is the adaptive period calculation using Kaufman's Efficiency Ratio, which was originally developed for the Adaptive Moving Average (AMA). This indicator applies that adaptive logic to MACD itself.
Key Differences from Standard MACD:
- Periods dynamically adjust between user-defined ranges (default: 8-21 for fast, 21-55 for slow)
- Uses Kaufman's Efficiency Ratio to measure market trendiness
- Implements gap protection to prevent extreme spikes from market gaps
- Includes market regime detection to filter signals in choppy conditions
- Provides multi-timeframe trend confirmation
HOW IT WORKS
1. Efficiency Ratio Calculation:
The indicator calculates market efficiency by comparing the absolute price change over a period to the sum of absolute price changes within that period. High efficiency = strong trending market. Low efficiency = choppy/sideways market.
2. Adaptive Period Adjustment:
- In trending markets (high efficiency): Periods move toward the minimum values for faster response
- In choppy markets (low efficiency): Periods move toward the maximum values for slower, more stable signals
- The "Sensitivity" parameter controls how aggressively periods adapt (0.5 to 5.0)
3. Gap Protection:
The custom adaptive EMA function detects abnormal price gaps (moves larger than 3x the typical ATR-based change) and limits their impact on the calculation. This prevents weekends or news gaps from causing extreme MACD spikes.
4. Signal Quality Filtering:
- Market regime detection identifies trending vs sideways conditions
- Momentum filter (RSI-based) prevents signals during overextended moves
- Signal strength calculation helps identify high-confidence setups
- Sideways market signals are marked with warning symbols
5. Multi-Timeframe Analysis:
The indicator compares current timeframe MACD with a higher timeframe (default 60 min) to provide context and filter against-trend signals.
HOW TO USE IT
Settings:
- Core Settings: Define the minimum and maximum periods for fast/slow EMAs
- Sensitivity: Higher values make the indicator more responsive to market changes
- Multi-timeframe: Set a higher timeframe for trend confirmation
- Visual options: Customize appearance and enable/disable features
Signal Interpretation:
- Strong bullish/bearish signals (large triangles): High-confidence entries in trending markets
- Warning signals (small ⚠): Crossovers in sideways markets - use caution or skip
- Divergence labels ("DIV"): Price and MACD diverging - potential reversal
- Background color: Green tint = trending market, Orange tint = sideways market
The Information Table shows:
- Current market regime (trending or sideways)
- Market efficiency percentage (how clean the trend is)
- Current adaptive fast and slow periods
- Higher timeframe trend direction
- Current signal strength
Best Practices:
- In trending markets: Trust strong signals, avoid warning signals
- In sideways markets: Reduce position sizes or skip trades entirely
- Use higher timeframe confirmation for better signal quality
- Adjust sensitivity based on your trading timeframe (higher for intraday, lower for swing)
TECHNICAL DETAILS
Calculation Method:
- Efficiency Ratio = ABS(Close - Close ) / SUM(ABS(Close - Close ), Period)
- Smoothed Efficiency = EMA(Efficiency Ratio, 5)
- Fast Period = Fast_Min + (Fast_Max - Fast_Min) × (1 - Smoothed_Efficiency × Sensitivity)
- Slow Period = Slow_Min + (Slow_Max - Slow_Min) × (1 - Smoothed_Efficiency × Sensitivity)
- Adaptive EMA uses standard EMA formula with gap detection and limiting
- MACD = Fast Adaptive EMA - Slow Adaptive EMA
- Signal = EMA(MACD, Signal Period)
- Histogram = MACD - Signal
The adaptive periods are calculated on every bar, so the MACD responds faster in trending conditions and stabilizes during consolidation.
WHAT THIS SOLVES
Standard MACD Problems:
- Fixed periods don't adapt to changing market conditions
- Too many false signals in sideways markets
- Whipsaws during low-volatility consolidation
- Price gaps can cause misleading spikes
AlphaMACD Solutions:
- Periods automatically adjust to market state
- Market regime filter identifies and warns about sideways conditions
- Adaptive smoothing reduces whipsaws
- Gap protection prevents false extremes
LIMITATIONS
- Like all indicators, this does not predict the future
- Requires trending markets for optimal performance
- Adaptive calculation means backtesting results will differ from fixed-period MACD
- More complex than standard MACD - requires understanding of adaptive concepts
- The adaptive periods mean you cannot directly compare this to traditional MACD studies
This indicator is best used as part of a complete trading system, not as a standalone signal generator.
EDUCATIONAL VALUE
For traders learning about:
- Adaptive indicators and market efficiency concepts
- Kaufman's Adaptive Moving Average principles applied to oscillators
- Market regime detection and signal filtering
- Gap handling in technical indicators
- Multi-timeframe analysis integration
Not Financial advice.

Divergences + Alerts (ANY Indicator)📊 Divergences + Alerts (ANY Indicator)
This versatile indicator detects four types of divergences between price action and an oscillator:
Buyer Exhaustion
Buyer Absorption
Seller Exhaustion
Seller Absorption
Each divergence type is automatically identified and visually marked on the chart with colored lines. The indicator also includes built-in alert conditions for all four divergence types, allowing traders to receive real-time notifications when potential reversal signals occur.
By default, the oscillator is a candle-style visualization of the Money Flow Index (MFI), enhanced with volatility filtering via a VWMA-based ATR. However, users can replace the default MFI oscillator with any external source using the “Plug External Source” input, enabling full customization and compatibility with other indicators.
Key features:
🔍 Detects both exhaustion and absorption divergences
🔔 Alerts for each divergence type
🕯️ Candle-style oscillator visualization
🔌 Optional input for external indicator sources
⚙️ ATR-based filtering for precision
Ideal for traders seeking to spot early signs of trend reversals or momentum shifts with customizable flexibility.

Bollinger Band ToolkitBollinger Band Toolkit
An advanced, adaptive Bollinger Band system for traders who want more context, precision, and edge.
This indicator expands on the classic Bollinger Bands by combining statistical and volatility-based methods with modern divergence and squeeze detection tools. It helps identify volatility regimes, potential breakouts, and early momentum shifts — all within one clean overlay.
🔹 Core Features
1. Adaptive Bollinger Bands (σ + ATR)
Classic 20-period bands enhanced with an ATR-based volatility adjustment, making them more responsive to true market movement rather than just price variance.
Reduces “overreacting” during chop and avoids bands collapsing too tightly during trends.
2. %B & RSI Divergence Detection
🟢 Green dots: Positive %B divergence — price makes a lower low, but %B doesn’t confirm (bullish).
🔴 Red dots: Negative %B divergence — price makes a higher high, but %B doesn’t confirm (bearish).
✚ Red/green crosses: RSI divergence confirmation — momentum fails to confirm the price’s new extreme.
These signals highlight potential reversal or slowdown zones that are often invisible to the naked eye.
3. Bollinger Band Squeeze (with Volume Filter)
Yellow squares (■) show periods when Bollinger Bands are at their narrowest relative to recent history.
Volume confirmation ensures the squeeze only triggers when both volatility and participation contract.
Often marks the “calm before the storm” — breakout potential zones.
4. Multi-Timeframe Breakout Markers
Optionally displays breakouts from higher or lower timeframes using different colors/symbols.
Lets you see when a higher timeframe band break aligns with your current chart — a strong trend continuation signal.
5. Dual- and Triple-Band Visualization (±1σ, ±2σ, ±3σ)
Optional inner (±1σ) and outer (±3σ) bands provide a layered volatility map:
Price holding between ±1σ → stable range / mean-reverting behavior
Price riding near ±2σ → trending phase, sustained momentum
Price touching or exceeding ±3σ → volatility expansion or exhaustion zone
This triple-band layout visually distinguishes normal movement from statistical extremes, helping you read when the market is balanced, expanding, or approaching its limits.
⚙️ Inputs & Customization
Choose band type (SMA/EMA/SMMA/WMA/VWMA)
Adjust deviation multiplier (σ) and ATR multiplier
Toggle individual features (divergence dots, squeeze markers, inner bands, etc.)
Multi-timeframe and colour controls for advanced users
🧠 How to Use
Watch for squeeze markers followed by a breakout bar beyond ±2σ → volatility expansion signal.
Combine divergence dots with RSI or price structure to anticipate slowdowns or reversals.
Confirm direction using multi-timeframe breakouts and volume expansion.
💬 Why It Works
This toolkit transforms qualitative chart reading (tight bands, hidden divergence) into quantitative, testable conditions — giving you objective insights that can be backtested, coded, or simply trusted in live setups.

RSI Cloud v1.0 [PriceBlance] RSI Cloud v1.0 — Ichimoku-style Cloud on RSI(14), not on price.
Recalibrated baselines: EMA9 (Tenkan) for speed, WMA45 (Kijun) for stability.
Plus ADX-on-RSI to grade strength so you know when momentum persists or fades.
1. Introduction
RSI Cloud v1.0 applies an Ichimoku Cloud directly on RSI(14) to reveal momentum regimes earlier and cleaner than price-based views. We replaced Tenkan with EMA9 (faster, more responsive) and Kijun with WMA45 (slower, more stable) to fit a bounded oscillator (0–100). Forward spans (+26) and a lagging line (−26) provide a clear framework for trend bias and transitions.
To qualify signals, the indicator adds ADX computed on RSI—highlighting whether strength is weak, strong, or very strong, so you can decide when to follow, fade, or stand aside.
2. Core Mapping (Hook + Bullets)
At a glance: Ichimoku on RSI(14) with recalibrated baselines for a bounded oscillator.
Source: RSI(14)
Tenkan → EMA9(RSI) (fast, responsive)
Kijun → WMA45(RSI) (slow, stable)
Span A: classic Ichimoku midline, displaced +26
Span B: classic Ichimoku baseline, displaced +26
Lagging line: RSI shifted −26
3. Key Benefits (Why traders care)
Momentum regimes on RSI: position vs. Cloud = bull / bear / transition at a glance.
Cleaner confirmations: EMA9/WMA45 pairing cuts noise vs. raw 30/70 flips.
Earlier warnings: Cloud breaks on RSI often lead price-based confirmations.
4. ADX on RSI (Enhanced Strength Normalization)
Grade strength inside the RSI domain using ADX from ΔRSI:
ADX ≤ 20 → Weak (transparency = 60)
ADX ≤ 40 → Strong (transparency = 15)
ADX > 40 → Very strong (transparency = 0)
Use these tiers to decide when to trust, fade, or ignore a signal.
5. How to Read (Quick rules)
Bias / Regime
Bullish: RSI above Cloud and RSI > WMA45
Bearish: RSI below Cloud and RSI < WMA45
Neutral / Transition: all other cases
6. Settings (Copy & use)
RSI Length: 14 (default)
Tenkan: EMA9 on RSI · Kijun: WMA45 on RSI
Displacement: +26 (Span A/B) · −26 (Lagging)
Theme: PriceBlance Dark/Light
Visibility toggles: Cloud, Baselines, Lagging, labels/panel, Overbought/Oversold, Divergence, ADX-on-RSI (via transparency coloring)
7. Credits & License
Author/Brand: PriceBlance
Version: v1.0 (Free)
Watermark: PriceBlance • RSI Cloud v1.0
Disclaimer: Educational content; not financial advice.
8. CTA
If this helps, please ⭐ Star and Follow for updates & new tools.
Feedback is welcome—comment what you’d like added next (alerts, presets, visuals).

Extreme Pressure Zones Indicator (EPZ) [BullByte]Extreme Pressure Zones Indicator(EPZ)
The Extreme Pressure Zones (EPZ) Indicator is a proprietary market analysis tool designed to highlight potential overbought and oversold "pressure zones" in any financial chart. It does this by combining several unique measurements of price action and volume into a single, bounded oscillator (0–100). Unlike simple momentum or volatility indicators, EPZ captures multiple facets of market pressure: price rejection, trend momentum, supply/demand imbalance, and institutional (smart money) flow. This is not a random mashup of generic indicators; each component was chosen and weighted to reveal extreme market conditions that often precede reversals or strong continuations.
What it is?
EPZ estimates buying/selling pressure and highlights potential extreme zones with a single, bounded 0–100 oscillator built from four normalized components. Context-aware weighting adapts to volatility, trendiness, and relative volume. Visual tools include adaptive thresholds, confirmed-on-close extremes, divergence, an MTF dashboard, and optional gradient candles.
Purpose and originality (not a mashup)
Purpose: Identify when pressure is building or reaching potential extremes while filtering noise across regimes and symbols.
Originality: EPZ integrates price rejection, momentum cascade, pressure distribution, and smart money flow into one bounded scale with context-aware weighting. It is not a cosmetic mashup of public indicators.
Why a trader might use EPZ
EPZ provides a multi-dimensional gauge of market extremes that standalone indicators may miss. Traders might use it to:
Spot Reversals: When EPZ enters an "Extreme High" zone (high red), it implies selling pressure might soon dominate. This can hint at a topside reversal or at least a pause in rallies. Conversely, "Extreme Low" (green) can highlight bottom-fish opportunities. The indicator's divergence module (optional) also finds hidden bullish/bearish divergences between price and EPZ, a clue that price momentum is weakening.
Measure Momentum Shifts: Because EPZ blends momentum and volume, it reacts faster than many single metrics. A rising MPO indicates building bullish pressure, while a falling MPO shows increasing bearish pressure. Traders can use this like a refined RSI: above 50 means bullish bias, below 50 means bearish bias, but with context provided by the thresholds.
Filter Trades: In trend-following systems, one could require EPZ to be in the bullish (green) zone before taking longs, or avoid new trades when EPZ is extreme. In mean-reversion systems, one might specifically look to fade extremes flagged by EPZ.
Multi-Timeframe Confirmation: The dashboard can fetch a higher timeframe EPZ value. For example, you might trade a 15-minute chart only when the 60-minute EPZ agrees on pressure direction.
Components and how they're combined
Rejection (PRV) – Captures price rejection based on candle wicks and volume (see Price Rejection Volume).
Momentum Cascade (MCD) – Blends multiple momentum periods (3,5,8,13) into a normalized momentum score.
Pressure Distribution (PDI) – Measures net buy/sell pressure by comparing volume on up vs down candles.
Smart Money Flow (SMF) – An adaptation of money flow index that emphasizes unusual volume spikes.
Each of these components produces a 0–100 value (higher means more bullish pressure). They are then weighted and averaged into the final Market Pressure Oscillator (MPO), which is smoothed and scaled. By combining these four views, EPZ stands out as a comprehensive pressure gauge – the whole is greater than the sum of parts
Context-aware weighting:
Higher volatility → more PRV weight
Trendiness up (RSI of ATR > 25) → more MCD weight
Relative volume > 1.2x → more PDI weight
SMF holds a stable weight
The weighted average is smoothed and scaled into MPO ∈ with 50 as the neutral midline.
What makes EPZ stand out
Four orthogonal inputs (price action, momentum, pressure, flow) unified in a single bounded oscillator with consistent thresholds.
Adaptive thresholds (optional) plus robust extreme detection that also triggers on crossovers, so static thresholds work reliably too.
Confirm Extremes on Bar Close (default ON): dots/arrows/labels/alerts print on closed bars to avoid repaint confusion.
Clean dashboard, divergence tools, pre-alerts, and optional on-price gradients. Visual 3D layering uses offsets for depth only,no lookahead.
Recommended markets and timeframes
Best: liquid symbols (index futures, large-cap equities, major FX, BTC/ETH).
Timeframes: 5–15m (more signals; consider higher thresholds), 1H–4H (balanced), 1D (clear regimes).
Use caution on illiquid or very low TFs where wick/volume geometry is erratic.
Logic and thresholds
MPO ∈ ; 50 = neutral. Above 50 = bullish pressure; below 50 = bearish.
Static thresholds (defaults): thrHigh = 70, thrLow = 30; warning bands 5 pts inside extremes (65/35).
Adaptive thresholds (optional):
thrHigh = min(BaseHigh + 5, mean(MPO,100) + stdev(MPO,100) × ExtremeSensitivity)
thrLow = max(BaseLow − 5, mean(MPO,100) − stdev(MPO,100) × ExtremeSensitivity)
Extreme detection
High: MPO ≥ thrHigh with peak/slope or crossover filter.
Low: MPO ≤ thrLow with trough/slope or crossover filter.
Cooldown: 5 bars (default). A new extreme will not print until the cooldown elapses, even if MPO re-enters the zone.
Confirmation
"Confirm Extremes on Bar Close" (default ON) gates extreme markers, pre-alerts, and alerts to closed bars (non-repainting).
Divergences
Pivot-based bullish/bearish divergence; tags appear only after left/right bars elapse (lookbackPivot).
MTF
HTF MPO retrieved with lookahead_off; values can update intrabar and finalize at HTF close. This is disclosed and expected.
Inputs and defaults (key ones)
Core: Sensitivity=1.0; Analysis Period=14; Smoothing=3; Adaptive Thresholds=OFF.
Extremes: Base High=70, Base Low=30; Extreme Sensitivity=1.5; Confirm Extremes on Bar Close=ON; Cooldown=5; Dot size Small/Tiny.
Visuals: Heatmap ON; 3D depth optional; Strength bars ON; Pre-alerts OFF; Divergences ON with tags ON; Gradient candles OFF; Glow ON.
Dashboard: ON; Position=Top Right; Size=Normal; MTF ON; HTF=60m; compact overlay table on price chart.
Advanced caps: Max Oscillator Labels=80; Max Extreme Guide Lines=80; Divergence objects=60.
Dashboard: what each element means
Header: EPZ ANALYSIS.
Large readout: Current MPO; color reflects state (extreme, approaching, or neutral).
Status badge: "Extreme High/Low", "Approaching High/Low", "Bullish/Neutral/Bearish".
HTF cell (when MTF ON): Higher-timeframe MPO, color-coded vs extremes; updates intrabar, settles at HTF close.
Predicted (when MTF OFF): Simple MPO extrapolation using momentum/acceleration—illustrative only.
Thresholds: Current thrHigh/thrLow (static or adaptive).
Components: ASCII bars + values for PRV, MCD, PDI, SMF.
Market metrics: Volume Ratio (x) and ATR% of price.
Strength: Bar indicator of |MPO − 50| × 2.
Confidence: Heuristic gauge (100 in extremes, 70 in warnings, 50 with divergence, else |MPO − 50|). Convenience only, not probability.
How to read the oscillator
MPO Value (0–100): A reading of 50 is neutral. Values above ~55 are increasingly bullish (green), while below ~45 are increasingly bearish (red). Think of these as "market pressure".
Extreme Zones: When MPO climbs into the bright orange/red area (above the base-high line, default 70), the chart will display a dot and downward arrow marking that extreme. Traders often treat this as a sign to tighten stops or look for shorts. Similarly, a bright green dot/up-arrow appears when MPO falls below the base-low (30), hinting at a bullish setup.
Heatmap/Candles: If "Pressure Heatmap" is enabled, the background of the oscillator pane will fade green or red depending on MPO. Users can optionally color the price candles by MPO value (gradient candles) to see these extremes on the main chart.
Prediction Zone(optional): A dashed projection line extends the MPO forward by a small number of bars (prediction_bars) using current MPO momentum and acceleration. This is a heuristic extrapolation best used for short horizons (1–5 bars) to anticipate whether MPO may touch a warning or extreme zone. It is provisional and becomes less reliable with longer projection lengths — always confirm predicted moves with bar-close MPO and HTF context before acting.
Divergences: When price makes a higher high but EPZ makes a lower high (bearish divergence), the indicator can draw dotted lines and a "Bear Div" tag. The opposite (lower low price, higher EPZ) gives "Bull Div". These signals confirm waning momentum at extremes.
Zones: Warning bands near extremes; Extreme zones beyond thresholds.
Crossovers: MPO rising through 35 suggests easing downside pressure; falling through 65 suggests waning upside pressure.
Dots/arrows: Extreme markers appear on closed bars when confirmation is ON and respect the 5-bar cooldown.
Pre-alert dots (optional): Proximity cues in warning zones; also gated to bar close when confirmation is ON.
Histogram: Distance from neutral (50); highlights strengthening or weakening pressure.
Divergence tags: "Bear Div" = higher price high with lower MPO high; "Bull Div" = lower price low with higher MPO low.
Pressure Heatmap : Layered gradient background that visually highlights pressure strength across the MPO scale; adjustable intensity and optional zone overlays (warning / extreme) for quick visual scanning.
A typical reading: If the oscillator is rising from neutral towards the high zone (green→orange→red), the chart may see strong buying culminating in a stall. If it then turns down from the extreme, that peak EPZ dot signals sell pressure.
Alerts
EPZ: Extreme Context — fires on confirmed extremes (respects cooldown).
EPZ: Approaching Threshold — fires in warning zones if no extreme.
EPZ: Divergence — fires on confirmed pivot divergences.
Tip: Set alerts to "Once per bar close" to align with confirmation and avoid intrabar repaint.
Practical usage ideas
Trend continuation: In positive regimes (MPO > 50 and rising), pullbacks holding above 50 often precede continuation; mirror for bearish regimes.
Exhaustion caution: E High/E Low can mark exhaustion risk; many wait for MPO rollover or divergence to time fades or partial exits.
Adaptive thresholds: Useful on assets with shifting volatility regimes to maintain meaningful "extreme" levels.
MTF alignment: Prefer setups that agree with the HTF MPO to reduce countertrend noise.
Examples
Screenshots captured in TradingView Replay to freeze the bar at close so values don't fluctuate intrabar. These examples use default settings and are reproducible on the same bars; they are for illustration, not cherry-picking or performance claims.
Example 1 — BTCUSDT, 1h — E Low
MPO closed at 26.6 (below the 30 extreme), printing a confirmed E Low. HTF MPO is 26.6, so higher-timeframe pressure remains bearish. Components are subdued (Momentum/Pressure/Smart$ ≈ 29–37), with Vol Ratio ≈ 1.19x and ATR% ≈ 0.37%. A prior Bear Div flagged weakening impulse into the drop. With cooldown set to 5 bars, new extremes are rate-limited. Many traders wait for MPO to curl up and reclaim 35 or for a fresh Bull Div before considering countertrend ideas; if MPO cannot reclaim 35 and HTF stays weak, treat bounces cautiously. Educational illustration only.
Example 2 — ETHUSD, 30m — E High
A strong impulse pushed MPO into the extreme zone (≥ 70), printing a confirmed E High on close. Shortly after, MPO cooled to ~61.5 while a Bear Div appeared, showing momentum lag as price pushed a higher high. Volume and volatility were elevated (≈ 1.79x / 1.25%). With a 5-bar cooldown, additional extremes won't print immediately. Some treat E High as exhaustion risk—either waiting for MPO rollover under 65/50 to fade, or for a pullback that holds above 50 to re-join the trend if higher-timeframe pressure remains constructive. Educational illustration only.
Known limitations and caveats
The MPO line itself can change intrabar; extreme markers/alerts do not repaint when "Confirm Extremes on Bar Close" is ON.
HTF values settle at the close of the HTF bar.
Illiquid symbols or very low TFs can be noisy; consider higher thresholds or longer smoothing.
Prediction line (when enabled) is a visual extrapolation only.
For coders
Pine v6. MTF via request.security with lookahead_off.
Extremes include crossover triggers so static thresholds also yield E High/E Low.
Extreme markers and pre-alerts are gated by barstate.isconfirmed when confirmation is ON.
Arrays prune oldest objects to respect resource limits; defaults (80/80/60) are conservative for low TFs.
3D layering uses negative offsets purely for drawing depth (no lookahead).
Screenshot methodology:
To make labels legible and to demonstrate non-repainting behavior, the examples were captured in TradingView Replay with "Confirm Extremes on Bar Close" enabled. Replay is used only to freeze the bar at close so plots don't change intrabar. The examples use default settings, include both Extreme Low and Extreme High cases, and can be reproduced by scrolling to the same bars outside Replay. This is an educational illustration, not a performance claim.
Disclaimer
This script is for educational purposes only and does not constitute financial advice. Markets involve risk; past behavior does not guarantee future results. You are responsible for your own testing, risk management, and decisions.

Divergence Scalp v1.1 By DaoAn advanced divergence detection indicator based on RSI and price pivots, designed for scalpers and swing traders who want to catch high-probability reversal points.
🔑 Key Features
RSI Divergence Detection
Regular Bullish Divergence → Price makes lower low, RSI makes higher low (RSI < 50).
Hidden Bullish Divergence → Price makes higher low, RSI makes lower low (RSI < 50).
Regular Bearish Divergence → Price makes higher high, RSI makes lower high (RSI > 50).
Hidden Bearish Divergence → Price makes lower high, RSI makes higher high (RSI > 50).
Customizable Settings
Pivot lookback length & detection range.
Toggle On/Off for Bullish, Bearish, Hidden signals.
Adjustable colors for signals and labels.
RSI Visualization
Plots RSI line with overbought (70), oversold (30), and midline (50).
Background shading for quick visual reference.
Signal Labels
“Bull / H Bull” → Bullish Divergence.
“Bear / H Bear” → Bearish Divergence.
Built-in Alerts → Real-time alerts for all four divergence types.
📊 How It Helps
This tool makes it easier to spot early signs of momentum shifts, allowing traders to anticipate reversals at key levels and improve entry/exit timing.
👉 Perfect for traders who use RSI divergence + price action as a scalping or swing strategy.

Smart Money Techniques (SMT) Divergence by RiseSmart Money Divergence - Early Reversal Indicator
This sophisticated indicator identifies and analyzes Smart Money Divergence patterns by systematically examining pivot point relationships between a primary asset and a secondary correlated instrument.
The indicator establishes divergence signals through precise algorithmic detection when pivot pairs exhibit opposing directional patterns between the primary and secondary assets. This sophisticated analysis reveals institutional positioning discrepancies that often precede significant market reversals.
Following divergence confirmation, the indicator provides comprehensive visualization tools and optional alert systems to capitalize on these high-probability trading opportunities. Advanced filtering capabilities allow traders to customize sensitivity levels, timeframe parameters, and styling to align with their specific trading methodology.
This powerful solution delivers unmatched functionality for traders seeking to identify and exploit Smart Money positioning through multi-asset divergence analysis. With its robust detection algorithms and granular customization options, it provides capabilities that surpass conventional divergence indicators by incorporating institutional flow analysis principles highly regarded in professional trading circles.
What is Smart Money Divergence?
Smart Money Divergence is another name for Smart Money Techniques (SMT). These patterns appear when comparing swing points, of adjustable strength, between correlated assets...
When an asset makes a higher high while the other makes a lower high.
When an asset makes a lower low while the other makes a higher low.
Potential Divergence
This indicator allows users to see potential SMT before the second swing point of the pair forms. It is showcased with different styling until it's confirmation, when enough bars pass based on the user-defined strength parameter.
Multi-Timeframe
Our tool allows traders to have higher/lower-timeframe divergences displayed on the chart of their choice, further automating their trading strategies.
Input Settings:
This tool offers a lot of customizable options, which could be overwhelming to some users. Below you will find an in-depth definition of every input's purpose to complement the tooltips that can be found directly in the indicator's settings.
Symbol 📊
This parameter let's users define the asset used in search of SMT divergence. We recommend using correlated assets, like NASDAQ100 with S&P500 or EURUSD with GBPUSD...
Timeframe 🔧
This is where users choose, if they wish, to set a different timeframe which will be utilized when looking for divergences.
Mode ⚙️
Default -> Displays all SMTs.
Bullish -> Displays only bullish SMTs using low pivots.
Bearish -> Displays only bearish SMTs using high pivots.
Historical 📜
This indicator allows users to display only a specific amount of SMTs... The historical input will display the specified amount of divergences up to 25, which will then showcase all available SMTs.
Parameters
This section defines the main parameters uses in establishing and managing SMT divergences.
Pivot Strength -> Number of bars to the left and right for pivot considerations.
Pivot Lookback -> Amount of past pivots to maintain in memory.
Allow Time Difference? -> Allow up to one bar difference when comparing pivots.
Time Filters -> The indicator allows for up to two time filters...
Checkbox -> Activate this time filter.
Time Range-> Define the time range which will only validate SMTs during.
Remove After Invalidation? -> Remove drawings from invalidated SMTs.
Style
Colors for bullish and bearish SMTs respectively.
Line styling and width
Potential Divergence -> checkbox and line styling.
Text
Label Contents :
Long -> "Smart Money Divergence"
Short -> "SMT"
None -> No text.
Include Symbol? -> Include the comparing asset's symbol within label text.
Size .
Font (Default or Monospace) and Format (None, Italic or Bold).
Align -> vertical and horizontal positioning.
This indicator is for educational and informational purposes only. Past performance and historical patterns do not guarantee future results. Trading involves substantial risk of loss and is not suitable for all investors. Always conduct your own analysis and consider your financial situation before making any trading decisions. The identification of patterns does not constitute trading advice.

OBV Cloud v1.0 [PriceBlance]🌐 English
OBV Cloud v1.0 – Free & Open-Source
OBV Cloud v1.0 integrates On-Balance Volume (OBV) with a Cloud model and enhanced trend filters.
It helps traders quickly identify:
Money Flow Trend: OBV Cloud acts as a dynamic support/resistance zone.
Trend Filters: EMA9 (short-term) and WMA45 (medium-term) directly applied on OBV.
OBV–Price Divergence: Detects both regular and hidden bullish/bearish divergences.
Trend Strength: Measured with ADX calculated on OBV.
OBV Cloud is suitable for both swing and day trading, allowing traders to spot breakouts, reversals, or sustained trends through volume-based analysis.

VWAP Divergence LevelsThis is an indicator which paints levels on your chart based on degrees of historical divergence from VWAP. I conceived and designed it for my personal use trading index funds (QQQ, SPY) on the NYSE. It is one of the primary indicators I use on a daily basis, and may be of interest to traders with a focus on volume.
This indicator works by tracking, each session, the maximum amount that price diverges from VWAP that day. The lookback period is locked to 21 days, or about 1 month's worth of trading days. Bearish and bullish divergences are tracked separately.
From this data, we take the average of all maximum daily bullish divergences (the "Mean Bull" divergence amount), and paint that line relative to the current VWAP. In other words, if the VWAP for the current bar is at $2.50 and the Mean Bull divergence is $0.40, the line will be painted at $2.90. The largest value from the lookback period ("Max Bull") is also painted. The same is done for bearish divergences.
Finally, midpoints between the VWAP and the Mean and Max levels are drawn. Optionally, quarter-levels are drawn in the spaces between Mean and VWAP.
When I created this indicator, I found that price very often responds and retraces around these levels, allowing me to more easily visualize the relationship between price and volume. Personally, I have found it useful for finding entrance and exit points-- especially when the levels coincide with important previous daily levels, or other support/resistance points.
Good luck & happy trading.
Disclaimer : Use at your own risk. This indicator and the strategy described herein are not in any way financial advice, nor does the author of this script make any claims about the effectiveness of this indicator or of any related strategy, which may depend highly on the discretion and skill of the trader executing it, among many other factors outside of the author's control. The author of this script accepts no liability, and is not responsible for any trading decisions that you may or may not make as a result of this indicator. You should expect to lose money if using this indicator.

Algorithmic Value Oscillator [CRYPTIK1]Algorithmic Value Oscillator
Introduction: What is the AVO? Welcome to the Algorithmic Value Oscillator (AVO), a powerful, modern momentum indicator that reframes the classic "overbought" and "oversold" concept. Instead of relying on a fixed lookback period like a standard RSI, the AVO measures the current price relative to a significant, higher-timeframe Value Zone .
This gives you a more contextual and structural understanding of price. The core question it answers is not just "Is the price moving up or down quickly?" but rather, " Where is the current price in relation to its recently established area of value? "
This allows traders to identify true "premium" (overbought) and "discount" (oversold) levels with greater accuracy, all presented with a clean, futuristic aesthetic designed for the modern trader.
The Core Concept: Price vs. Value The market is constantly trying to find equilibrium. The AVO is built on the principle that the high and low of a significant prior period (like the previous day or week) create a powerful area of perceived value.
The Value Zone: The range between the high and low of the selected higher timeframe.
Premium Territory (Distribution Zone): When the oscillator moves into the glowing pink/purple zone above +100, it is trading at a premium.
Discount Territory (Accumulation Zone): When the oscillator moves into the glowing teal/blue zone below -100, it is trading at a discount.
Key Features
1. Glowing Gradient Oscillator: The main oscillator line is a dynamic visual guide to momentum.
The line changes color smoothly from light blue to neon teal as bullish momentum increases.
It shifts from hot pink to bright purple as bearish momentum increases.
Multiple transparent layers create a professional "glow" effect, making the trend easy to see at a glance.
2. Dynamic Volatility Histogram: This histogram at the bottom of the indicator is a custom volatility meter. It has been engineered to be adaptive, ensuring that the visual differences between high and low volatility are always clear and dramatic, no matter your zoom level. It uses a multi-color gradient to visualize the intensity of market volatility.
3. Volatility Regime Dashboard: This simple on-screen table analyzes the histogram and provides a clear, one-word summary of the current market state: Compressing, Stable, or Expanding.
How to Use the AVO: Trading Strategies
1. Reversion Trading This is the most direct way to use the indicator.
Look for Buys: When the AVO line drops into the teal "Accumulation Zone" (below -100), the price is trading at a discount. Watch for the oscillator to form a bottom and start turning up as a signal that buying pressure is returning.
Look for Sells: When the AVO line moves into the pink "Distribution Zone" (above +100), the price is trading at a premium. Watch for the oscillator to form a peak and start turning down as a signal that selling pressure is increasing.
2. Best Practices & Settings
Timeframe Synergy: The AVO is most effective when your chart timeframe is lower than your selected "Value Zone Source." For example, if you trade on the 1-hour chart, set your Value Zone to "Previous Day."
Confirmation is Key: This indicator provides powerful context, but it should not be used in isolation. Always combine its readings with your primary analysis, such as market structure and support/resistance levels.

BTC Lead(v3.31)Summary
A 15-minute, BTC-focused lead/divergence indicator designed for simple execution: when a ▲/▼ appears, start scaling in with small clips; when a ■ (black square) prints, it means the indicator’s edge has weakened (not that the market trend is over). Real-time expected move label and alert templates included. Do not fade the signal—if you must try the opposite side, wait until a ■ appears.
How to read the signals
▲ Green → Long bias increased
▼ Pink → Short bias increased
■ Black → Edge weakened; consider taking profits/standing aside
Multiple level markers on the same bar (L2/L3/L4) = stronger setup
Live label (top of chart)
A single line shows the Expected Move (%) with arrow and color-coded background (↑ green / ↓ pink) for instant direction clarity.
Tip: Use Replay to watch label → ▲/▼ → ■ sequences on past data.
Confidence filter (important)
|Expected Move| < 1% → treat as noise / ignore
If considering the opposite direction, wait for a ■ first (edge reduced).
Scope
Internal calculations are fixed to 15-minute resolution.
Built for BTC 15m. It may display on other crypto symbols/timeframes, but performance is not guaranteed.
Alerts
Ready-made conditions: ENTRY LONG / ENTRY SHORT / EXIT LONG / EXIT SHORT. Add an alert on this indicator and choose the condition you want.
Risk note
For research/education only. Past behavior doesn’t guarantee future results. Predefine position sizing, stops, and profit-taking, and execute consistently.
cd_indiCATor_CxGeneral:
This indicator is the redesigned, simplified, and feature-enhanced version of the previously shared indicators:
cd_cisd_market_Cx, cd_HTF_Bias_Cx, cd_sweep&cisd_Cx, cd_SMT_Sweep_CISD_Cx, and cd_RSI_divergence_Cx.
Within the holistic setup, the indicator tracks:
• HTF bias
• Market structure (trend) in the current timeframe
• Divergence between selected pairs (SMT)
• Divergence between price and RSI values
• Whether the price is in an important area (FVG, iFVG, and Volume Imbalance)
• Whether the price is at a key level
• Whether the price is within a user-defined special timeframe
The main condition and trigger of the setup is an HTF sweep with CISD confirmation on the aligned timeframe.
When the main condition occurs, the indicator provides the user with a real-time market status summary, enriched with other data.
________________________________________
What’s new?
-In the SMT module:
• Triad SMT analysis (e.g.: NQ1!, ES1!, and YM1!)
• Dyad SMT analysis (e.g.: EURUSD, GBPUSD)
• Alternative pair definition and divergence analysis for non-correlated assets
o For crypto assets (xxxUSDT <--> xxxUSDT.P) (e.g.: SOLUSDT.P, SOLUSDT)
o For stocks, divergence analysis by comparing the asset with its value in another currency
(BIST:xxx <--> BIST:xxx / EURTRY), (BAT:xxx <--> BAT:xxx / EURUSD)
-Special timeframe definition
-Configurable multi-option alarm center
-Alternative summary presentation (check list / status table / stickers)
________________________________________
Details and usage:
The user needs to configure four main sections:
• Pair and correlated pairs
• Timeframes (Auto / Manual)
• Alarm center
• Visual arrangement and selections
Pair Selections:
The user should adjust trading pairs according to their trade preferences.
Examples:
• Triad: NQ1!-ES1!-YM1!, BTC-ETH-Total3
• Dyad: NAS100-US500, XAUUSD-XAGUSD, XRPUSDT-XLMUSDT
Single pairs:
-Crypto Assets:
If crypto assets are not in the triad or dyad list, they are automatically matched as:
Perpetual <--> Spot (e.g.: DOGEUSDT.P <--> DOGEUSDT)
If the asset is already defined in a dyad list (e.g., DOGE – SHIB), the dyad definition takes priority.
________________________________________
-Stocks:
If stocks are defined in the dyad list (e.g.: BIST:THYAO <--> BIST:PGSUS), the dyad definition takes priority.
If not defined, the stock is compared with its value in the selected currency.
For example, in the Turkish Stock Exchange:
BIST:FENER stock, if EUR is chosen from the menu, is compared as BIST:FENER / OANDA:EURTRY.
Here, “OANDA” and the stock market currency (TRY) are automatically applied for the exchange rate.
For NYSE:XOM, its pair will be NYSE:XOM / EURUSD.
________________________________________
Timeframes:
By default, the menu is set to “Auto.” In this mode, aligned timeframes are automatically selected.
Aligned timeframes (LTF-HTF):
1m-15m, 3m-30m, 5m-1h, 15m-4h, 1h-D, 4h-W, D-M
Example: if monitoring the chart on 5m:
• 1h sweep + 5m CISD confirmation
• D sweep + 1h CISD confirmation (bias)
• 5m market structure
• 1h SMT and 1h RSI divergence analysis
For manual selections, the user must define the timeframes for Sweep and HTF bias.
FVG, iFVG, and Volume Imbalance timeframes must be manually set in both modes.
________________________________________
Alarm Center:
The user can choose according to preferred criteria.
Each row has options.
“Yes” → included in alarm condition.
“No” → not included in alarm condition.
If special timeframe criteria are added to the alarm, the hour range must also be entered in the same row, and the “Special Zone” tab (default: -4) should be checked.
Key level timeframes and plot options must be set manually.
Example alarm setup:
Alongside the main Sweep + CISD condition, if we also want HTF bias + Trend alignment + key level (W, D) and special timeframe (09:00–11:00), we should set up the menu as follows:
________________________________________
Visual Arrangement and Selections:
Users can control visibility with checkboxes according to their preferences.
In the Table & Sticker tab, table options and labels can be controlled.
• Summary Table has two options: Check list and Status Table
• From the HTF bias section, real-time bias and HTF sweep zone (optional) are displayed
• The RSI divergence section only shows divergence analysis results
• The SMT 2 sub-section only functions when triad is selected
Labels are shown on the bar where the sweep + CISD condition occurs, displaying the current situation.
With the Check box option, all criteria’s real-time status is shown (True/False).
Status Table provides a real-time summary table.
Although the menu may look crowded, most settings only need to be adjusted once during initial use.
________________________________________
What’s next?
• Suggestions from users
• Standard deviation projection
• Mitigation/order blocks (cd special mtg)
• PSP /TPD
________________________________________
Final note:
Every additional criterion in the alarm settings will affect alarm frequency.
Multiple conditions occurring at the same time is not, by itself, sufficient to enter a trade—you should always apply your own judgment.
Looking forward to your feedback and suggestions.
Happy trading! 🎉

PowerDelta Oscillator [FxScripts]PowerDelta Oscillator
The PowerDelta Oscillator measures real-time buying and selling pressure using the proprietary PowerDelta Algorithm. By quantifying order flow, it identifies whether the market conditions favor bullish or bearish activity, helping traders determine directional bias for both trend and countertrend setups.
Calculation Methodology
The PowerDelta computes the delta (difference) between buying and selling pressure by integrating both price movement and volume behavior rather than relying solely on volume or price-based approximations like other oscillators.
The PowerDelta Algorithm evaluates six core price-volume conditions:
Price advancing with increasing volume
Price advancing with decreasing volume
Price consolidating with increasing volume
Price consolidating with decreasing volume
Price declining with increasing volume
Price declining with decreasing volume
From these conditions, the algorithm derives:
Accumulation vs Distribution phases
Buyer/Seller exhaustion points
Effort vs No Result scenarios (volume pressure failing to move price)
Operational Use
The PowerDelta Oscillator has three operational modes:
Trend
Countertrend
Blended (Trend/Countertrend hybrid)
Trend Mode
In Trend Mode, the indicator plots an oscillator that fluctuates between positive and negative values:
Positive readings indicate dominant buying pressure
Negative readings indicate dominant selling pressure
The magnitude of the reading reflects the intensity of the pressure
Crossovers at the zero line provide directional shifts:
Negative → Positive: bullish transition
Positive → Negative: bearish transition
Additionally:
Sustained positive values indicate control by buyers, long bias is favoured
Sustained negative values indicate control by sellers, short bias is favoured
The magnitude of displacement from zero provides additional confirmation of market strength or weakness
Countertrend Mode
In Countertrend Mode, the primary use of the PowerDelta Oscillator is to locate divergences between price and the oscillator (as visualised on the chart above) which helps traders pinpoint potential reversals
The oscillator is much more sensitive in this mode, making highs, lows and hence divergences, easier to spot
Like Trend Mode, the magnitude of displacement from zero provides additional confirmation of market strength or weakness
The various Analytical Scenarios detailed below provide detailed use cases for both Trend and Countertrend Mode
Blended Mode
To provide maximum flexibility, there’s also a third Blended Mode
This mode combines elements of the two primary modes and can be used as part of a hybrid approach making it easier to spot both trends and reversals
Alternative Source
The PowerDelta algorithm utilises volume data therefore it’s best to use the most reliable source of volume data for the instrument being traded
For instance, whilst XAUUSD provides excellent results with most forex brokers, slightly better results may be achieved using GC futures data which comes direct from the exchange (data package required)
To use a third-party source, select 'Alternative' and input the relevant source
This can also be used as a way to monitor correlated pairs by adding two instances of the PowerDelta to the same chart, selecting pair 1 e.g. EURUSD as the first instance and the correlated pair e.g. USDCHF as the second instance
Thorough backtesting advised
Analytical Scenarios
Accumulation: High positive oscillator readings combined with upward price movement suggest active accumulation.
Optimal strategy: Monitor pullbacks for potential long entries or wait for a divergence with price and potential reversal.
Distribution: High negative oscillator readings with downward price movement indicate distribution.
Optimal strategy: Monitor pullbacks for potential short entries or wait for a divergence with price and potential reversal.
Buyer Exhaustion: Price forms higher highs while oscillator value declines. Indicates weakening buying strength and potential bearish reversal.
Seller Exhaustion: Price forms lower lows while oscillator value contracts. Indicates weakening selling strength and potential bullish reversal.
Effort / No Result (Buyers): Positive oscillator expansion without higher highs indicates aggressive buying without price confirmation, suggesting overbought conditions and a potential bearish reversal.
Effort / No Result (Sellers): Negative oscillator expansion without lower lows indicates aggressive selling without price confirmation, suggesting oversold conditions and a potential bullish reversal.
Alerts
To trigger alerts when market bias transitions across the zero line:
Right-click on chart → Add Alert on PowerDelta
Condition: PowerDelta → Select Mode
Type: Crossing
Value: 0
Execution: Once Per Bar Close
Adjust additional parameters as required
Performance and Optimization
Backtesting Results: The PowerDelta Oscillator has undergone extensive backtesting across various instruments, timeframes and market conditions, demonstrating strong performance in identifying strong trends and reversals. User backtesting is strongly encouraged as it allows traders to optimize settings for their preferred instruments and timeframes.
Optimization for Diverse Markets: The PowerDelta Oscillator can be used on crypto, forex, indices, commodities and stocks. The PowerDelta Oscillator's algorithmic foundation ensures consistent performance across a variety of instruments. The Trend, Countertrend and Blended Modes make it easy for the trader to set up based on their individual trading style.
Educational Resources and Support
Users of the PowerDelta Oscillator benefit from comprehensive educational resources and full access to FxScripts Support. This ensures traders can maximize the potential of the PowerDelta Oscillator and other tools in the Sigma Indicator Suite by learning best practices and gaining insights from an experienced team of traders.

𝑨𝒔𝒕𝒂𝒓 - TyrAstar – Tyr is a dynamic RSI system with adaptive EMA and divergence detection.
@v1.0
Dynamic RSI period adjusts to volatility & market activity
Adaptive EMA smooths RSI with variable length
Optional Gaussian Kernel smoothing for noise reduction
Highlights bullish & bearish divergences automatically
Clean visualization with color coding and fills
Works in real time with no repainting

CandelaCharts - Vertex Oscillator 📝 Overview
The Vertex Oscillator is a proprietary momentum-based oscillator designed to detect periods of deep undervaluation (accumulation) and excessive euphoria (distribution) in markets.
By combining price deviation, volume normalization, and volatility scaling, the indicator identifies extreme conditions and provides actionable signals for both traders and analysts.
📦 Features
Volume-normalized momentum – integrates price deviations with relative volume weighting.
Adaptive volatility scaling – reduces distortion from sudden spikes and low-volume noise.
Z-score normalization – standardizes readings into intuitive zones.
Accumulation & Euphoria detection – highlights market extremes with color-coded zones.
Built-in alerts – instantly notify traders when critical thresholds are crossed.
⚙️ Settings
Source: The input price source.
Lookback: Number of bars used for deviation & volatility calculation.
Smoothing: Smoothing length applied to oscillator.
Colors: Customize bullish, bearish, and neutral oscillator line colors.
Zones: Set shading colors for accumulation (≤ -2) and euphoria (≥ +2).
Line: Choose oscillator line width and color.
⚡️ Showcase
≤ -2 (Green Zone)
Market undervaluation / accumulation opportunities.
≥ +2 (Red Zone)
Market euphoria / overheated conditions.
0 (Neutral Line)
Balanced state.
Divergences
📒 Usage
The Vertex Oscillator is most effective when interpreted through its key zones, helping traders quickly spot undervaluation, euphoria, or neutral market conditions.
Identify Accumulation – When the oscillator drops below -2, markets may be undervalued.
Spot Euphoria – When the oscillator rises above +2, markets may be overheated.
Neutral Zone – Around 0, conditions are balanced with no strong bias.
Best Practice – Use alongside trend, support/resistance, or volume tools to confirm signals.
🚨 Alerts
The Vertex Oscillator includes built-in alerts to help traders react instantly when the market enters extreme conditions. Instead of constantly monitoring the chart, alerts notify you in real time when accumulation or euphoria thresholds are triggered.
Deep Accumulation – triggers when the oscillator crosses below -2, signaling undervaluation.
Euphoria Triggered – triggers when the oscillator crosses above +2, signaling overheated conditions.
⚠️ Disclaimer
These tools are exclusively available on the TradingView platform.
Our charting tools are intended solely for informational and educational purposes and should not be regarded as financial, investment, or trading advice. They are not designed to predict market movements or offer specific recommendations. Users should be aware that past performance is not indicative of future results and should not rely on these tools for financial decisions. By using these charting tools, the purchaser agrees that the seller and creator hold no responsibility for any decisions made based on information provided by the tools. The purchaser assumes full responsibility and liability for any actions taken and their consequences, including potential financial losses or investment outcomes that may result from the use of these products.
By purchasing, the customer acknowledges and accepts that neither the seller nor the creator is liable for any undesired outcomes stemming from the development, sale, or use of these products. Additionally, the purchaser agrees to indemnify the seller from any liability. If invited through the Friends and Family Program, the purchaser understands that any provided discount code applies only to the initial purchase of Candela's subscription. The purchaser is responsible for canceling or requesting cancellation of their subscription if they choose not to continue at the full retail price. In the event the purchaser no longer wishes to use the products, they must unsubscribe from the membership service, if applicable.
We do not offer reimbursements, refunds, or chargebacks. Once these Terms are accepted at the time of purchase, no reimbursements, refunds, or chargebacks will be issued under any circumstances.
By continuing to use these charting tools, the user confirms their understanding and acceptance of these Terms as outlined in this disclaimer.

Moving Average Adaptive RSI [BackQuant]Moving Average Adaptive RSI
What this is
A momentum oscillator that reshapes classic RSI into a zero-centered column plot and makes it adaptive. It builds RSI from two parts:
• A sensitivity window that scans several recent bars to capture the strongest up and down impulses.
• A selectable moving average that smooths those impulses before computing RSI.
The output ranges roughly from −100 to +100 with 0 as the midline, with optional extra smoothing and built-in divergence detection.
How it works
Impulse extraction
• For each bar the script inspects the last rsi_sen bars and collects upward and downward price changes versus the current price.
• It keeps the maximum upward change and maximum downward change from that window, emphasizing true bursts over single-bar noise.
MA-based averaging
• The up and down impulse series are averaged with your chosen MA over rsi_len bars.
• Supported MA types: SMA, EMA, DEMA, WMA, HMA, SMMA (RMA), TEMA.
Zero-centered RSI transform
• RS = UpMA ÷ DownMA, then mapped to a symmetric scale: 100 − 200 ÷ (1 + RS) .
• Above 0 implies positive momentum bias. Below 0 implies negative momentum bias.
Optional extra smoothing
• A second smoothing pass can be applied to the final oscillator using smoothing_len and smooth_type . Toggle with “Use Extra Smoothing”.
Visual encoding
• The oscillator is drawn as columns around the zero line with a gradient that intensifies toward extremes.
• Static bands mark 80 to 100 and −80 to −100 for extreme conditions.
Key inputs and what they change
• Price Source : input series for momentum.
• Calculation Period (rsi_len) : primary averaging window on up and down components. Higher = smoother, slower.
• Sensitivity (rsi_sen) : how many recent bars are scanned to find max impulses. Higher = more responsive to bursts.
• Calculation Type (ma_type) : MA family that shapes the core behavior. HMA or DEMA is faster, SMA or SMMA is slower.
• Smoothing Type and Length : optional second pass to calm noise on the final output.
• UI toggles : show or hide the oscillator, candle painting, and extreme bands.
Reading the oscillator
• Midline cross up (0) : momentum bias turning positive.
• Midline cross down (0) : momentum bias turning negative.
• Positive territory :
– 0 to 40: constructive but not stretched.
– 40 to 80: strong momentum, continuation more likely.
– Above 80: extreme risk of mean reversion grows.
• Negative territory : mirror the same levels for the downside.
Divergence detection
The script plots four divergence types using pivot highs and lows on both price and the oscillator. Lookbacks are set by lbL and lbR .
• Regular bullish : price lower low, oscillator higher low. Possible downside exhaustion.
• Hidden bullish : price higher low, oscillator lower low. Bias to trend continuation up.
• Regular bearish : price higher high, oscillator lower high. Possible upside exhaustion.
• Hidden bearish : price lower high, oscillator higher high. Bias to trend continuation down.
Labels: ℝ for regular, ℍ for hidden. Green for bullish, red for bearish.
Candle coloring
• Optional bar painting: green when the oscillator is above 0, red when below 0. This is for visual scanning only.
Strengths
• Adaptive sensitivity via a rolling impulse window that responds to genuine bursts.
• Configurable MA core so you can match responsiveness to the instrument.
• Zero-centered scale for simple regime reads with 0 as a clear bias line.
• Built-in regular and hidden divergence mapping.
• Flexible across symbols and timeframes once tuned.
Limitations and cautions
• Trends can remain extended. Treat extremes as context rather than automatic reversal signals.
• Divergence quality depends on pivot lookbacks. Short lookbacks give more signals with more noise. Long lookbacks reduce noise but add lag.
• Double smoothing can delay zero-line transitions. Balance smoothness and timeliness.
Practical usage ideas
• Regime filter : only take long setups from your separate method when the oscillator is above 0, shorts when below 0.
• Pullback confirmation : in uptrends, look for dips that hold above 0 or turn up from 0 to 40. Reverse for downtrends.
• Divergence as a heads-up : wait for a zero-line cross or a price trigger before acting on divergence.
• Sensitivity tuning : start with rsi_sen 2 to 5 on faster timeframes, increase slightly on slower charts.
Alerts
• MA-A RSI Long : oscillator crosses above 0.
• MA-A RSI Short : oscillator crosses below 0.
Use these as bias or timing aids, not standalone trade commands.
Settings quick reference
• Calculation : Price Source, Calculation Type, Calculation Period, Sensitivity.
• Smoothing : Smoothing Type, Smoothing Length, Use Extra Smoothing.
• UI : Show Oscillator, Paint Candles, Show Static High and Low Levels.
• Divergences : Pivot Lookback Left and Right, Div Signal Length, Show Detected Divergences.
Final thoughts
This tool reframes RSI by extracting strong short-term impulses and averaging them with a moving-average model of your choice, then presenting a zero-centered output for clear regime reads. Pair it with your structure, risk and execution process, and tune sensitivity and smoothing to the market you trade.

cd_RSI_Divergence_CxGeneral:
The Relative Strength Index (RSI) is a momentum oscillator widely used by traders in price analysis. In addition to showing overbought/oversold zones, divergences between RSI and price are also tracked to identify trading opportunities.
The general consensus is that oscillators alone are not sufficient for entries and should be evaluated together with multiple confirmations.
This oscillator is designed as an additional confirmation/compatible tool for strategies that already use higher time frame (HTF) sweeps and lower time frame (LTF) confirmations such as Change in State Delivery (CISD) or Change of Character (CHOCH).
Features:
While RSI oscillators are commonly displayed in line format (classic), this indicator also offers candlestick-style visualization.
Depending on the selected source, period length, and EMA length, RSI can be displayed as lines and/or candlesticks.
Divergence detection & tracking:
Price and RSI values are monitored on the chosen higher time frame (from the menu) to determine highs and lows. For divergence display, the user can choose between two modes:
1- Alignment with HTF Sweep
2- All
1 - Alignment with HTF Sweep:
First, the price must sweep the previous high/low of the candle on the HTF (i.e., break it) but fail to continue in that direction and return inside (sweep).
If this condition is met, RSI values are checked:
If price makes a high sweep but RSI fails to make a new high → divergence is confirmed.
If price makes a low sweep but RSI fails to make a new low → divergence is confirmed.
Divergence is then displayed on the chart.
2 - All:
In this mode, sweep conditions are ignored. Divergence is confirmed if:
Price makes a new high on HTF but RSI does not.
RSI makes a new high on HTF but price does not.
Price makes a new low on HTF but RSI does not.
RSI makes a new low on HTF but price does not.
Menu & Settings:
RSI visualization (source + period length + EMA period length)
Option to choose classic/candlestick style display
Color customization
Higher time frame selection
Adjustable HTF boxes and table display
Final notes:
This oscillator is designed as an additional confirmation tool for strategies based on HTF sweep + LTF CISD/CHOCH confirmation logic. The chosen HTF in the oscillator should match the time frame where sweeps are expected.
Divergence signals from this oscillator alone will not make you profitable.
For spot trades, monitoring sweeps and divergences on higher time frames is more suitable (e.g., Daily–H1 / Weekly–H4).
My personal usage preferences:
Entry TF: 3m
HTF bias: Daily + H1
Sweep + CISD: 30m / 3m
Market Structure: 3m
RSI divergence: HTF = 30m
If all of them align bullish or bearish ( timeframe alignment ), I try to take the trade.
I’d be glad to hear your feedback and suggestions for improvement.
Happy trading!

Dynamic Value Zone Oscillator (DVZO) - @CRYPTIK1Dynamic Value Zone Oscillator (DVZO) @CRYPTIK1
Introduction: What is the DVZO?
The Dynamic Value Zone Oscillator (DVZO) is a powerful momentum indicator that reframes the classic "overbought" and "oversold" concept. Instead of relying on a fixed lookback period like a standard RSI or Stochastics, the DVZO measures the current price relative to a significant, higher-timeframe Value Zone (e.g., the previous week's entire price range).
This gives you a more contextual and structural understanding of price. The core question it answers is not just "Is the price moving up or down quickly?" but rather, "Where is the current price in relation to its recently established area of value?"
This allows traders to identify true "premium" (overbought) and "discount" (oversold) levels with greater accuracy, leading to higher-probability reversal and trend-following signals.
The Core Concept: Price vs. Value
The market is constantly trying to find equilibrium or "fair value." The DVZO is built on the principle that the high and low of a significant prior period (like the previous day, week, or month) create a powerful area of perceived value.
The Value Zone: The range between the high and low of the selected higher timeframe. The midpoint of this zone is the equilibrium (0 line on the oscillator).
Premium Territory (Distribution Zone): When price breaks above the Value Zone High (+100 line), it is trading at a premium. This is an area where sellers are more likely to become active and buyers may be over-extending.
Discount Territory (Accumulation Zone): When price breaks below the Value Zone Low (-100 line), it is trading at a discount. This is an area where buyers are more likely to see value and sellers may be exhausted.
By anchoring its analysis to these significant structural levels, the DVZO filters out much of the noise from lower-timeframe price fluctuations.
Key Features
The Oscillator:
The main blue line visualizes exactly where the current price is within the context of the Value Zone.
+100: The high of the Value Zone.
0: The midpoint/equilibrium of the Value Zone.
-100: The low of the Value Zone.
Automatic Divergence Detection:
The DVZO automatically identifies and plots bullish and bearish divergences on both the price chart and the oscillator itself.
Bullish Divergence: Price makes a new low, but the DVZO makes a higher low. This is a strong signal that downside momentum is fading and a reversal to the upside is likely.
Bearish Divergence: Price makes a new high, but the DVZO makes a lower high. This indicates that upside momentum is waning and a pullback is probable.
Value Migration Histogram:
The purple histogram in the background visualizes the width of the Value Zone.
Expanding Histogram: Volatility is increasing, and the accepted value range is getting wider.
Contracting Histogram: Volatility is decreasing, and the price is coiling in a tight range, often in anticipation of a major breakout.
How to Use the DVZO: Trading Strategies
1. Reversion Trading
This is the most direct way to use the indicator.
Look for Buys: When the DVZO line drops below -100, the price is in the "Accumulation Zone." Wait for the price to show signs of strength (e.g., a bullish candle pattern) and the DVZO line to start turning back up towards the -100 level. This is a high-probability mean reversion setup.
Look for Sells: When the DVZO line moves above +100, the price is in the "Distribution Zone." Look for signs of weakness (e.g., a bearish engulfing candle) and the DVZO line to start turning back down towards the +100 level.
2. Divergence Trading
Divergences are powerful confirmation signals.
Entry Signal: When a Bullish Divergence appears, it provides a strong entry signal for a long position, especially if it occurs within the Accumulation Zone (below -100).
Exit/Short Signal: When a Bearish Divergence appears, it can serve as a signal to take profit on long positions or to look for a short entry, especially if it occurs in the Distribution Zone (above +100).
3. Best Practices & Settings
Timeframe Synergy: The DVZO is most effective when your chart timeframe is lower than your selected Value Zone Source.
For Day Trading (e.g., 1H, 4H chart): Use the "Previous Day" Value Zone.
For Swing Trading (e.g., 1D, 12H chart): Use the "Previous Week" or "Previous Month" Value Zone.
Confirmation is Key: The DVZO is a powerful tool, but it should not be used in isolation. Always combine its signals with other forms of analysis, such as market structure, support/resistance levels, and candlestick patterns, for confirmation.
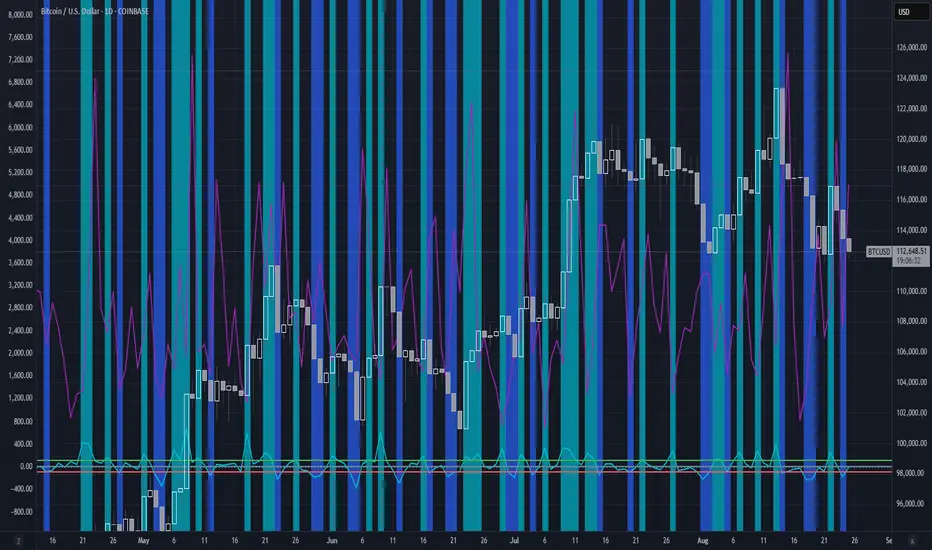
SMT for Time-Based Sessions [ufo]SMT for Time-Based Sessions identifies when one asset breaks a session’s high/low while another correlated asset fails to do so. This imbalance often signals engineered liquidity grabs, reversals, or continuation setups. By focusing on divergences within specific trading sessions (London, New York AM, Lunch, New York PM, Asia, Daily or your own custom windows), the tool filters out noise and pinpoints only the most meaningful SMT divergences across multiple symbols in real-time.
Core Concept:
SMT (Smart Money Technique/Tool/Time) is a concept popularized by Inner Circle Trader (ICT) that suggests that when correlated or inversely correlated instruments fail to confirm each other's price movements (e.g., one breaks a high/low while the other doesn’t), it often indicates:
Liquidity manipulation by institutional players
Potential reversal points in the market
Weakness or strength in the current trend
Stop hunt operations before significant moves
This indicator identifies these divergences by comparing your chart symbol against up to two comparison symbols across different sessions and timeframes.
How Time-Based SMT Works:
Unlike basic divergence tools, this indicator is built specifically for Session-Based and Timeframe-Based SMT tracking. It continuously monitors intraday sessions and higher timeframes, then plots divergences the moment they occur.
Time-Based Session SMT
Session Tracking: Monitors highs and lows during each session
Post-Session Analysis: After a session ends, tracks whether price breaks session levels
Divergence Detection: When the main symbol breaks a high/low but comparison symbols don’t (or vice versa), an SMT signal is triggered
(e.g. Nasdaq traded above London high while S&P500 does not)
Visual Confirmation: Lines connect the session reference to the current extreme, with labels showing the diverging session, high/low, and symbol, this information is also displayed in the Info Panel
This will update if a new high/low extreme is made while the SMT is still valid, if invalidated these will be removed from the chart
Example:
This NQ chart includes ES and YM as comparison symbols. At 03:20 AM New York time, both ES and YM broke the Asia session low (20:00 – 00:00), while NQ did not. This creates a bullish session divergence , which the indicator immediately detects and plots.
Although the chart shows three symbols for illustration, you don’t need to manually monitor comparison charts when using this indicator, the SMT divergence will be plotted automatically as soon as it occurs
Consecutive Candle SMT (CC SMT)
Previous Candle Reference: Uses the previous candle's high/low from the selected timeframe
Real-Time Comparison: Monitors if current price breaks these levels across all symbols
Instant Detection: Triggers SMT immediately when divergence occurs
Dynamic Updates: Lines and labels update in real-time as new extremes form and are automatically removed if invalidated
Example:
Here I configured CC SMT Timeframe 1 to monitor the previous 4-hour candle’s high/low. On this NQ chart with ES as a comparison symbol, ES broke above the prior 4-hour high at 14:00 New York time, while NQ did not, showing relative weakness creating a bearish CC SMT divergence
This chart is just an illustration. The indicator will automatically plot SMT divergences on your main chart, regardless of the timeframe you’re viewing
How To Use:
This indicator is not a buy/sell signal on its own. Instead, it is designed to highlight Time-Based SMT divergences so you can combine them with your existing trading strategy or model. It should be used as an extra layer of confluence, helping you confirm trade ideas.
Select your comparison symbols
For example:
Futures: NQ vs ES/YM
Forex: EURUSD vs GBPUSD/DXY(inversely)
Crypto: BTC vs ETH
Commodities: Gold vs Silver
Choose which sessions or candle timeframes you want the indicator to monitor
Watch for divergences the indicator plots when one symbol breaks a high/low while the other does not
Use these divergences as confluence, alongside your own strategy and risk management rules
Key Features:
Multiple Comparison Symbols
Symbol 1 & Symbol 2: Compare your main chart against up to 2 correlated instruments
Symbol Inversion: Perfect for inversely correlated pairs (e.g., EURUSD vs DXY)
Session-Based SMT Tracking
Monitors 7 fully customizable trading sessions with the default being:
London Session (2:00-5:00 NY time)
NY AM Session (9:30-12:00 NY time)
Lunch Session (12:00-13:00 NY time)
NY PM Session (13:00-16:00 NY time)
Asia Session (20:00-00:00 NY time)
Custom Session 6 (if you want to add an extra session)
Daily Session (18:00-18:00 NY time)
Fully customizable session times and names
Automatically detects when the main symbol breaks a session high/low while comparison symbols don't (and vice versa)
Consecutive Candle SMT (CC SMT)
Monitors 3 customizable timeframes
Tracking of divergences based on specific timeframe candles (15min, 60min, 4 hour, weekly, etc.)
Identifies when the current price breaks the previous candle's high/low differently than comparison symbols
Maintains history of past SMTs (configurable)
Timeframe 3 supports custom time shifts for non-standard candle boundaries
Example: 90min timeframe with a +60 shift changes the candle range from:
00:00-01:30, 01:30-03:00 etc
to:
01:00-02:30, 02:30-04:00 etc
Visual Customization
Line Styles: Customize the line styles for different symbols
Colors: Unique color schemes for instant session identification
Adjustable Offsets: Fine-tune label positions with multiplier settings
Show/Hide Controls: Complete control over visual elements
Custom Labels: Customize the SMT labels for highs and lows
Information Panel
Active SMT Conditions: Live tracking of all current divergences
Session Names: Clear identification of which session created the SMT
Symbol Information: Shows which comparison symbol is diverging
Timestamps: Optional time display showing when SMT was first detected
Flexible Positioning: 8 different panel positions
Smart Display Modes: Options to hide inactive sessions/timeframes
Alert System
Configurable alerts for specific sessions or timeframes
Get notified when new divergences appear instantly
Clear, informative alert descriptions
How To Setup Alerts:
Enable the "Enable Alerts" in the settings
Choose which sessions/timeframes to receive alerts for by choosing it in the setting below
(If you select "All Sessions" you will only be alerted for all the sessions you have enabled in the indicator settings)
Create an alert (ALT+A shortcut) or click the the 3 dots on the indicator "Add alert on Session SMT "
- Condition = Session SMT
- Function = Any alert() function call
- Alert name (Message) = Anything you prefer (e.g. SMT Alert)
If you want to create another alert for different settings, first input the new settings in the indicator, then create a new alert.
Note: Previous alerts will continue to notify you based on the settings they were originally set for, even if you change the indicator setting.
How This Helps Your Trading:
This tool automates the heavy lifting of tracking divergences across multiple markets and sessions, continuously monitoring highs and lows in real time and plotting only the most meaningful SMT signals so you can focus on execution, not chart-watching.