Divergence Detector [TradingFinder] RSI + MACD + AO Oscillator 🔵 Introduction
🟣 Understanding Divergence
As mentioned, divergence occurs in technical analysis when a stock's price behaves contrary to indicators on the price chart. Divergence can signify either a reversal of the stock's trend or a continuation of the previous trend correction.
Divergences can act as reversal patterns or continuation patterns. Moreover, divergences can be utilized to identify potential support and resistance levels.
For instance, when an indicator is trending upwards and positive, but the price is declining and trending downwards, divergence occurs. Divergence in a stock indicates trader indecision in buying and selling and warns traders to reconsider their decisions regarding buying or holding the stock.
Divergence aids analysts in identifying critical price points. In indicator divergences, it serves as a potent signal in the realm of technical analysis.
🟣 Types of Divergence
1.Regular Divergence
o Positive Regular Divergence (RD+)
o Negative Regular Divergence (RD-)
2.Hidden Divergence
o Positive Hidden Divergence (HD+)
o Negative Hidden Divergence (HD-)
3.Time Divergence
Key Note : This indicator is specifically designed to identify "Regular Divergence" only. Therefore, the following explanation pertains to this type of divergence.
🔵 Regular Divergence/Convergence
Regular Divergence(Convergence) occurs due to conflicting behavior between the indicator and the price chart, typically at the end of a trend. Recognizing Regular Divergence suggests an anticipation of a trend reversal or a pattern resembling a reversal.
🟣 Positive Regular Divergence (RD+)
In contrast to negative divergence, positive Regular Divergence occurs at the end of a downtrend and between two price lows. It manifests when the price forms a new low on the price chart, but the indicator fails to recognize it.
Positive Regular Divergence indicates strong buying pressure and weak selling pressure. Following the identification of positive divergence on the chart, one can anticipate a price increase for the examined stock.
🟣 Negative Regular Divergence (RD-)
This type of Regular Divergence emerges between two price highs during an uptrend. A new high is formed on the price chart, but the indicator fails to acknowledge it. This scenario indicates negative Regular Divergence.
The likelihood of a subsequent market downturn is high. Negative divergence signifies strong selling pressure and weak buying pressure, suggesting an unfavorable future for the stock.
🔵 How to use
By utilizing the "Fractal Period" input, you can specify your desired periods for identifying divergences.
Additionally, through the "Divergence Detect Method" feature, you can choose which oscillators (MACD, RSI, or AO) to base divergence identification on.
Divergence in MACD Oscillator :
Divergence in the MACD indicator occurs when the price chart and the MACD line form a noticeable opposing pattern, meaning the price moves contrary to the MACD line. In this scenario, one expects a reversal in price direction.
Divergence in RSI Oscillator :
If divergence occurs during a downtrend on the price chart (two consecutive lows, with the second low being lower) and on the corresponding RSI point (two consecutive lows, with the second low being higher), it signifies positive Regular Divergence and implies a buying signal.
Conversely, if divergence occurs during an uptrend on the price chart (two consecutive highs, with the second high being higher) and on the corresponding RSI point (two consecutive highs, with the second high being lower), it indicates negative Regular Divergence, signaling a selling opportunity.
Divergence in AO Oscillator :
The AO indicator calculates histograms similar to the AO base. It calculates the difference between the simple moving averages of 5 and 34 periods based on the median of each bar. Then, it plots the bars based on the difference.
It then compares the histograms to detect peaks and troughs in the AO histograms and compares the identified peaks and troughs to the price. Whenever divergence is detected, it plots lines and arrows.
🔵 Table
The table contains information on the functional features of this oscillator that you can utilize. Four categories of information are presented in the table: "Exist," "Consecutive," "Divergence Quality," and "Change Phase Indicator."
Exist :
If divergence exists, you'll see "+" in this row.
Consecutive :
Divergences may occur consecutively. If same-type divergences form within short intervals, you can observe the count in this row.
Divergence Quality : Based on the number of consecutive divergences, their quality can be evaluated. If one divergence exists, its quality is considered "Normal." If two divergences exist, the quality is "Good," and if three or more divergences exist, the quality is considered "Strong."
Change Phase Indicator : If a phase change occurs between two oscillation peaks formed based on divergence, this change is identified and displayed in this row.
背離

Pro Divergence Adaptive [regular + hidden] by TradingClue🔴 Overview 🔴
ProDivergence Adaptive is a versatile tool designed to identify regular and hidden divergences , including regular divergences from higher timeframes , on any given chart.
This indicator combines two major approaches of identifying divergences:
- Using price-action , identification of higher-highs, higher-lows etc.
- Using a statistical model (linear regression) to determine the direction of movements
To be more sensitive to the current market conditions, both were implemented in an adaptive way.
🔴 How the mechanics and calculations work 🔴
✅ short recap on what divergences are
Regular divergences occur when the price moves opposite to a selected oscillator, signaling potential trend reversals. They can be spotted on higher timeframes, providing stronger confirmation for potential reversals when aligned with signals on the current timeframe.
Hidden divergences indicate trend continuation. Combining these on various timeframes provides a more comprehensive analysis for traders to identify entry or exit points in the market
✅ Price Action
A regular bullish divergence happens when the price of an asset is forming lower lows, while the oscillator is forming higher lows.
A regular bearish divergence occurs when the price of an asset is forming higher highs, while the oscillator is forming lower highs
A hidden bullish divergence happens when the price of an asset is making higher lows during an uptrend, but the oscillator is making lower lows.
A hidden bearish divergence occurs when the price of an asset is making lower highs during a downtrend, but the oscillator is making higher highs.
"Lows" are signaled by a minimum value that is surrounded by higher low values.
"Highs" are signaled by a maximum value that is surrounded by lower high values.
Since there is no smoothing involved, there is only minimal lag.
✅ Statistical Model
When using linear regression to identify divergences between the price of an asset and an oscillator, we apply a statistical approach to find trends in the data. This method allows for a more nuanced detection of divergences, as it considers the overall direction of price points and oscillator values rather than individual highs and lows.
Regular Bullish Divergence: Occurs when the linear regression of the asset's price shows a downward trend while the linear regression of the oscillator indicates an upward trend.
Regular Bearish Divergence: Happens when the linear regression of the asset's price is upward but the linear regression of the oscillator is downward.
Hidden Bullish Divergence: Identified when, during an uptrend, the linear regression of the price is upward, but the linear regression of the oscillator trends downward.
Hidden Bearish Divergence: Occurs when, during a downtrend, the linear regression of the price trends downward, but the linear regression of the oscillator is upward.
Using linear regression smooths out fluctuations and focuses on the overall trend direction of both price and oscillator, reducing the impact of short-term volatility and providing a clearer view of the market's momentum.
✅ Adaptive Approach
Traditional oscillator settings do not account for changes in market volatility, leading to potential misalignment with current market conditions. This can result in either too many false signals during high volatility periods or missed opportunities in lower volatility settings due to the oscillator's static nature.
The adaptive approach adjusts the oscillator's settings based on the Average True Range (ATR), a measure of market volatility. By dynamically altering the oscillator length in relation to the current ATR value compared to its historical range, the settings become responsive to the market's volatility.
This adaptive method enhances the detection of meaningful divergences between price and oscillator movements by ensuring the oscillator is finely tuned to the current market environment. It results in a more accurate identification of potential reversal points, crucial for the success of divergence-based trading strategies.
🔴 Key Features 🔴
Identifies regular and hidden divergences
Multi-Timeframe Analysis
Adaptive Oscillator Configuration, level of adaptiveness can be adjusted
Supported Oscillators: CCI, Momentum, RSI
Boundaries for the dynamic length of the oscillator can be applied
Works for all kinds of assets (Forex, Stocks, Crypto, Commodities, Futures, ...)
Works on all timeframes
🔴 Examples 🔴
✅ Canadian Dollar / Japanese Yen, 4H Chart, FX:CADJPY
Divergences of Price vs CCI. The adaptive/ dynamic length of the CCI can range between 5 and 12.
✅ Bitcoin / U.S. Dollar, 2H Chart BITSTAMP:BTCUSD
Divergences of Price vs Momentum. The adaptive/ dynamic length of the Momentum can range between 4 and 13.
Caution: Trading carries a significant risk of financial loss, and past performance does not guarantee future results. Signals may be conflicting or ambiguous. Employ risk reduction techniques, such as setting stop losses, to mitigate potential losses.

Multi-Spectral RSI Deviations [AlgoAlpha]🌌 Multi-Spectral RSI Deviations by AlgoAlpha - Dive into Market Dynamics! 🌠
Dive deep into the essence of market trends with our 🚀 Multi-Spectral RSI Deviations indicator, a comprehensive tool designed by AlgoAlpha to enhance your trading strategy. By harnessing the power of multiple RSI lengths and innovative smoothing techniques, this indicator offers a unique perspective on market momentum and potential reversals.
🔍 Key Features:
🎨 Customizable up and down colors for immediate trend recognition.
🔢 Three RSI lengths for multi-layered market analysis.
🔄 Various Moving Average (MA) types including SMA, EMA, and more for tailored smoothing.
✅ Bullish and Bearish divergence plotting for spotting potential reversals.
🕵️♂️ Adjustable divergence sensitivity settings to fine-tune signal detection.
🔔 Built-in alerts for trend shifts and reversal conditions, ensuring you never miss a trading opportunity.
🚀 Quick Guide to Using the Multi-Spectral RSI Deviations Indicator
🛠 Add the Indicator: Search for "Multi-Spectral RSI Deviations" in TradingView's Indicators & Strategies. Adjust the RSI lengths and MA settings to suit your trading strategy.
🔍 Market Analysis: Keep an eye on the color changes for trend direction and use divergence plots to anticipate potential market reversals.
🔔 Alerts Setup: Activate the built-in alerts for trend shifts and reversals to stay ahead of the game without having to constantly monitor the charts.
🧠 How It Works:
At the core of the Multi-Spectral RSI Deviations indicator is its ability to analyze the market through various RSI lengths, providing a comprehensive view of momentum. The indicator calculates the Relative Strength Index (RSI) over three different periods, creating a spectrum of momentum insights. These RSI values are then compared to each other to identify the momentum shifts within the market.
To refine these insights, the differences between these RSI values are smoothed using a selected Moving Average type, such as SMA, EMA, etc., based on user preference. This smoothing process helps in highlighting the overall trend direction and potential reversal points with greater clarity.
Furthermore, the indicator employs a color-coding system, where the plotted line changes color based on the momentum's direction—shifting to an up color for positive momentum and a down color for negative momentum. This visual cue enables traders to quickly discern the market trend at a glance.
Divergences between the price action and the indicator's values are another cornerstone of this tool. By plotting potential bullish and bearish divergences, the indicator provides early signals of possible trend reversals, offering traders a strategic advantage.
Embrace the power of our 🌌 Multi-Spectral RSI Deviations and elevate your trading to stellar heights! 🌠✨

Divergence Signal [TradingFinder] RSI & MACD Reversal On Swing🔵 Introduction
Sometimes in analyzing price charts using indicators, you may observe a discrepancy. For instance, while the price of stocks, currencies, or commodities is increasing, the indicator shows a decrease. Such a phenomenon in technical analysis is termed "divergence." Divergences are categorized into three types based on their formation and the prediction they make about the continuation of the price trend: "Regular Divergence," "Hidden Divergence," and "Time Divergence."
🟣 Important :
• This indicator exclusively identifies regular divergences since its primary function is to detect reversal points.
• This indicator identifies divergences using three indicators: "Moving Average Convergence Divergence" (MACD), "Relative Strength Index" (RSI), and "Awesome Oscillator" (AO). The user can choose each of these indicators in the settings using the "Divergence Detection Method" dropdown menu for identifying divergences. These settings are by default set to the MACD mode.
🔵Types of Divergence
Divergences, as mentioned, offer different predictions about the continuation of price trends. Hence, they have various types. We will focus on explaining regular divergences based on this indicator.
🟣 Regular Divergence(RD) :
Regular divergence is a situation arising from contradictory behavior between the indicator and the price chart at the end of a trend. By identifying regular divergences, we anticipate a change in trend direction resembling a reversal pattern.
Regular divergence has two types based on the trend and prediction:
Negative Regular Divergence (RD-) :
This type occurs between two price peaks at the end of an uptrend. Despite forming a new high, the indicator fails to recognize it, indicating a negative regular divergence. The likelihood of a subsequent downtrend is high. Negative divergence suggests strong selling pressure and weak buying power, portraying an unfavorable future for the stock.
Positive Regular Divergence (RD+) :
In contrast, positive regular divergence happens at the end of a downtrend and between two price troughs. As depicted in the chart, although the price forms a new low, the indicator doesn't acknowledge it. Positive regular divergence indicates robust buying pressure and weak selling power. Upon identifying positive divergence in the chart, we expect a price increase for the stock under review
🔵 How to Use
Information from the indicator is displayed in two ways: Table and Label.
🟣 Table : The table displays information about the latest divergence. This includes the type of divergence, existence or absence of divergence, consecutive divergences, divergence quality, and change in indicator phase.
Type Divergence : Indicates the type of divergence, which can be either "Bullish Divergence" or "Bearish Divergence."
Exist : Indicates the presence of divergence with a "+" sign and absence with a "-" sign. A green color is used for bullish divergence and red for bearish divergence.
Consecutive : Shows the number of consecutive divergences. For example, if there are 3 consecutive divergences, the number 3 is displayed.
Divergence Quality : Displays the quality of the divergence based on the number of consecutive divergences. If there is 1 divergence, the quality is "Normal"; for 2 divergences, it's "Good"; and for 3 or more divergences, it's "Strong."
Change Phase Indicator : Indicates whether a phase change in the indicator has occurred with "+" for yes and "-" for no.
🟣 Label : Unlike the table, which only shows information about the latest divergence, labels display information about each divergence at the point where it occurs. The information includes the type of divergence, detection method, divergence quality, consecutive divergences, and change in phase indicator. The selected method of detection is also displayed. For example, if the chosen method is the "AO" indicator, the label will show "Method: AO."
🔵 Settings
Fractal Period : Determines the period of swings. The minimum and default value is 2.
Divergence Detect Method : Selects the indicator (MACD, RSI, or AO) used for detecting divergences. The default indicator is MACD.
Show Fractal : Chooses whether to display fractals or not. The default is "No."
Show Table : Determines whether to display the table or not. The default is "Yes."
Show Label : Chooses whether to display labels or not. The default is "Yes."
Label Size : Adjusts the size of the labels from "Tiny" to "Large."

U-Oscillator Pro [UAlgo]The U-Oscillator Pro is a comprehensive technical analysis tool designed to assist traders in making informed decisions in financial markets. This indicator integrates various features including oscillator, bands, trend clouds divergences, and confluence signals to provide a comprehensive view of market dynamics.
🔶 Oscillator :
U-Oscillator uses an amalgamation of price, momentum, and volatility elements to provide a comprehensive market view. It provides a common output about the market and is easy to use.
Oscillator Features :
Customizable Oscillator Length : This parameter sets the length of the oscillator.
Use Machine Learning On Oscillator Calculation : By evaluating the output of the oscillator, this data set calculates a weighted average of the data set by taking each point with a certain weight and using these weights. This is often used in situations where some data points are more important or need to have more impact than others. A weight for each point that the oscillator calculates may represent the importance or impact of that point. By including all these calculations in the oscillator, it provides a result.
Reversal Signals : Determines whether to display reversal signals on the chart. When set to true, it enables the plotting of reversal signals based on certain conditions for both long (buy) and short (sell) signals. These signals can be interpreted as "potential" turning points of the market. Signals are represented by small shapes on the chart, with green indicating short (sell) signals and red indicating long (buy) signals.
🔶 Extreme Bands:
These regions can be described as the possible reversal regions of the price and obtained by deviations of oscillator values.
Extreme Bands Features:
Band Length : Determines the length of the bands.
Show Extreme Bands : Option to display the extreme bands.
Show Middle Line : Option to show the middle line.
Transparency Mode : Adjust the transparency level of the bands.
It would not be wrong to consider it as potential overbought and oversold regions.
Example:
🔶 Divergences :
The divergence calculation in this script identifies potential reversals by analyzing pivot points in the oscillator. Here's how it works:
Divergence Features :
Pivot Length: The user specifies the length of the divergence calculation (pivotLength), which determines the number of bars to consider for pivot analysis.
Pivot Identification: The script searches for pivot highs and lows within the specified length. These pivots indicate potential turning points in the oscillator.
Divergence Conditions: Different conditions are evaluated based on the identified pivots to determine the presence of bullish or bearish divergences:
Regular Bullish Divergence: Occurs when the oscillator makes a lower low while the price makes a higher low.
Hidden Bullish Divergence: Occurs when the oscillator makes a higher low while the price makes a lower low.
Regular Bearish Divergence: Occurs when the oscillator makes a higher high while the price makes a lower high.
Hidden Bearish Divergence: Occurs when the oscillator makes a lower high while the price makes a higher high.
Visualization: Detected divergences are plotted on the chart using shapes and lines, indicating potential reversal points. Users can choose which types of divergences to display using input options.
🔶 Trend Cloud :
This section can provide information about the long-term direction of the price and the current status of the trend. The increase in the visibility of the cloud can provide information about the strength of the trend.
Trend Cloud Features :
Show Trend Cloud: This setting allows you to choose whether the trend cloud is displayed on the chart or not.
Fast Trend Cloud Mode: This feature can be used to provide information about the cloud's shorter-term trend and its strength.
Classic Mode of Trend Cloud :
Fast Mode of Trend Cloud :
🔶 Confluence :
This section of the script aims to identify potential reversal confluences based on the deviation between the price and a combination of oscillator values. The confluence signals are categorized into light and heavy, representing different levels of potential reversal strength.
Confluence Features :
Show Light/Heavy Reversal Confluences: This setting allows users to control the visibility of the confluence signals on the chart.
Confluence Term: Users can select the term for calculating the confluence, which in turn affects the sensitivity of the confluence signals. The available options are Short, Medium, and Long.
Confluence Signal Conditions:
Light Bearish Reversal Confluence: This type of confluence occurs when there is a moderate deviation between the price and the oscillator values, indicating a potential shift towards a bearish reversal in the market sentiment.
Heavy Bearish Reversal Confluence: In contrast, a heavy bearish reversal confluence signifies a significant deviation between the price and the oscillator values, suggesting a strong indication of a bearish reversal in the market sentiment.
Light Bullish Reversal Confluence: Similar to light bearish reversal confluence, light bullish reversal confluence occurs with a moderate deviation between the price andthe oscillator values, indicating a potential shift towards a bullish reversal in the market sentiment.
Heavy Bullish Reversal Confluence: On the other hand, heavy bullish reversal confluence indicates a substantial deviation between the price andthe oscillator values, suggesting a strong indication of a bullish reversal in the market sentiment.
Plotting Confluence Signals: Shapes (triangles) are plotted on the chart to indicate the presence of confluence signals. Red triangles denote bearish signals, while green triangles denote bullish signals.
This confluence analysis provides traders with additional insights into potential reversal points or helping them make more informed trading decisions.
Example For Confluence :
🔶 Disclaimer:
Use with Caution: This indicator is provided for educational and informational purposes only and should not be considered as financial advice. Users should exercise caution and perform their own analysis before making trading decisions based on the indicator's signals.
Not Financial Advice: The information provided by this indicator does not constitute financial advice, and the creator (UAlgo) shall not be held responsible for any trading losses incurred as a result of using this indicator.
Backtesting Recommended: Traders are encouraged to backtest the indicator thoroughly on historical data before using it in live trading to assess its performance and suitability for their trading strategies.
Risk Management: Trading involves inherent risks, and users should implement proper risk management strategies, including but not limited to stop-loss orders and position sizing, to mitigate potential losses.
No Guarantees: The accuracy and reliability of the indicator's signals cannot be guaranteed, as they are based on historical price data and past performance may not be indicative of future results.

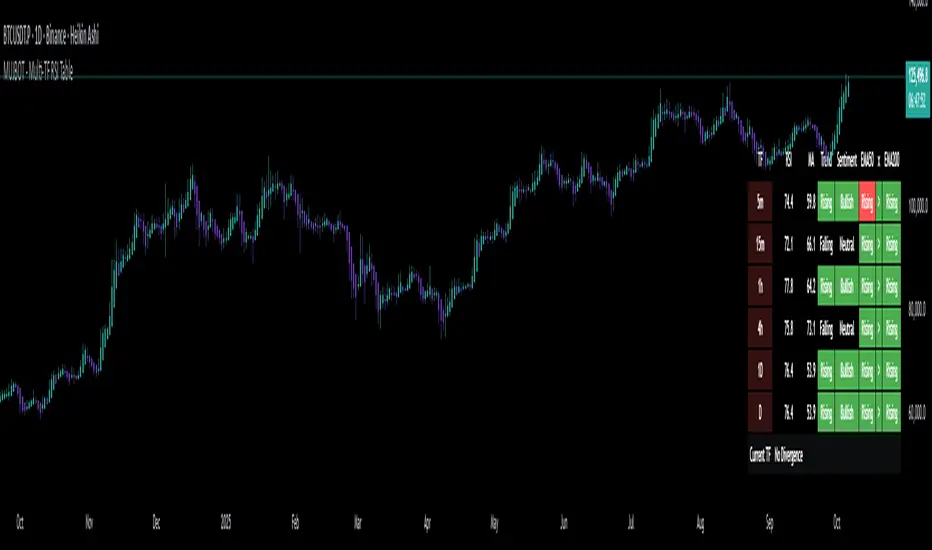
MUJBOT - Multi-TF RSI Table
The "Multi-TF RSI Table" indicator is a comprehensive tool designed to present traders with a quick visual summary of the Relative Strength Index (RSI) across multiple timeframes, all within a single glance. It is crafted for traders who incorporate multi-timeframe analysis into their trading strategy, aiming to enhance decision-making by identifying overall market sentiment and trend direction. Here's a rundown of its features:
User Inputs: The indicator includes customizable inputs for the RSI and Moving Average (MA) lengths, allowing users to tailor the calculations to their specific trading needs. Additionally, there is an option to display or hide the RSI & MA table as well as to position it in various places on the chart for optimal visibility.
Multi-Timeframe RSI & MA Calculations: It fetches RSI and MA values from different timeframes, such as 1 minute (1m), 5 minutes (5m), 15 minutes (15m), 1 hour (1h), 4 hours (4h), and 1 day (1D). This multi-timeframe approach provides a thorough perspective of the momentum and trend across different market phases.
Trend and Sentiment Analysis: For each timeframe, the script determines whether the average RSI is above or below the MA, categorizing the trend as "Rising", "Falling", or "Neutral". Moreover, it infers market sentiment as "Bullish" or "Bearish", based on the relationship between the RSI and its MA.
Dynamic Color-Coding: The indicator uses color-coding to convey information quickly. It highlights the trend and sentiment cells in the table with green for "Bullish" and red for "Bearish" conditions. It also shades the timeframe cells based on the RSI value, with varying intensities of green for "Oversold" conditions and red for "Overbought" conditions, providing an immediate visual cue of extreme market conditions.
Customization and Adaptability: The script is designed with customization in mind, enabling users to adjust the RSI and MA lengths according to their trading strategy. Its adaptable interface, which offers the option to display or hide the RSI & MA table, ensures that the tool fits into different trading setups without cluttering the chart.
Ease of Use: By consolidating critical information into a simple table, the "Multi-TF RSI Table" indicator saves time and simplifies the analysis process for traders. It eliminates the need to switch between multiple charts or timeframes, thus streamlining the trading workflow.
In essence, the "Multi-TF RSI Table" is a powerful indicator for Pine Script users on TradingView, offering a multi-dimensional view of market dynamics. It is ideal for both novice and experienced traders who seek to enhance their technical analysis with an at-a-glance summary of RSI trends and market sentiment across various timeframes.
ATR Divergences [UAlgo]Divergence is a concept in financial markets that highlights inconsistencies between the price of an asset and a given indicator. This script focuses on identifying divergences using the Average True Range (ATR). Divergence occurs when there is a disparity between the direction of the price and the oscillator, providing valuable insights for traders anticipating potential trend reversals.
This script employs pivot points (with using High-Low values of the candles) to identify potential divergences between the oscillator (ATR) and price movements. Here's how each type of divergence is determined:
Key Features:
Regular Bullish Divergence:
Oscillator registers a higher low.
Price records a lower low.
Indicative of potential upward reversal.
Hidden Bullish Divergence:
Oscillator indicates a lower low.
Price exhibits a higher low.
Signals a concealed bullish continuation pattern.
Regular Bearish Divergence:
Oscillator shows a lower high.
Price marks a higher high.
Suggests a possible downward reversal.
Hidden Bearish Divergence:
Oscillator reflects a higher high.
Price displays a lower high.
Indicates a hidden bearish continuation pattern.
Usage and Customization:
ATR Length: Adjustable parameter for customizing the Average True Range calculation period.
Plot Options: Choose to display Regular Bullish, Hidden Bullish, Regular Bearish, and/or Hidden Bearish divergences.
Wait for Candle Close: Option to wait for candle closure before plotting signals.
How to Interpret:
Regular divergences may indicate potential trend reversals, while hidden divergences suggest a continuation of the current trend. Traders can leverage these signals to make informed decisions in their trading strategies.
Feel free to customize the parameters based on your trading preferences. Happy Trading!

Divergence AnalyzerUnlock the potential of your trading strategy with the Divergence Analyzer, a sophisticated indicator designed to identify divergence patterns between two financial instruments. Whether you're a seasoned trader or just starting, this tool provides valuable insights into market trends and potential trading opportunities.
Key Features:
1. Versatility in Symbol Selection:
- Choose from a wide range of symbols for comparison, including popular indices like XAUUSD and SPX.
- Seamlessly toggle between symbols to analyze divergences and make informed trading decisions.
2. Flexible Calculation Options:
- Customizable options allow you to use a different symbol for calculation instead of the chart symbol.
- Fine-tune your analysis by selecting specific symbols for comparison based on your trading preferences.
3. Logarithmic Scale Analysis:
- Utilizes logarithmic scales for accurate representation of price movements.
- Linear regression coefficients are calculated on the logarithmic scale, providing a comprehensive view of trend strength.
4. Dynamic Length and Smoothing:
- Adjust the length parameter to adapt the indicator to different market conditions.
- Smoothed linear regression with exponential moving averages enhances clarity and reduces noise.
5. Standard Deviation Normalization:
- Normalizes standard deviations over 200 periods, offering a standardized view of price volatility.
- Easily compare volatility levels across different symbols for effective divergence analysis.
6. Color-Coded Divergence Visualization:
- Clearly distinguish positive and negative divergences with customizable color options.
- Visualize divergence deltas with an intuitive color scheme for quick and effective interpretation.
7. Symbol Information Table:
- An included table provides at-a-glance information about the selected symbols.
- Identify Symbol 1 and Symbol 2, along with their corresponding positive and negative divergence colors.
How to Use:
1. Select symbols for analysis using the user-friendly inputs.
2. Customize calculation options based on your preferences.
3. Analyze the divergence delta plot for clear visual indications.
4. Refer to the symbol information table for a quick overview of selected instruments.
Empower your trading strategy with the Divergence Analyzer and gain a competitive edge in the dynamic world of financial markets. Start making more informed decisions today!

TrendPivotsLibrary "TrendPivots"
This library provides functions to search for bullish and bearish divergences between pivots and indicators. Functions search for higher highs and lower lows, automating lines, labels and signals for technical analysis and strategies.
method maxBeforeLast(id)
Method function to get the maximum price before the last, stored in an array pivotPoint.
Namespace types: pivotPoint
Parameters:
id (pivotPoint ) : (array pivotPoint) The pivotPoint array to inspect.
Returns: pivotPoint
method minBeforeLast(id)
Method function to get the minimum price before the last, stored in an array pivotPoint.
Namespace types: pivotPoint
Parameters:
id (pivotPoint ) : (array pivotPoint) The pivotPoint array to inspect.
Returns: pivotPoint
method pivotLine(id, a, b, color)
Sets the coordinates of a given line using two pivotPoint variables.
Namespace types: series line
Parameters:
id (line) : (line) Existing line
a (pivotPoint) : (pivotPoint) First pivotPoint.
b (pivotPoint) : (pivotPoint) Second pivotPoint.
color (color) : (color) The desired color. Default is red.
Returns: void
bearishDivergence(pivotArray)
Look for bearish divergence in a pivotPoint array cointaining pivot highs.
Parameters:
pivotArray (pivotPoint ) : (array pivotPoint) The pivotPoint array to inspect.
Returns: bool True if bearish divergence was found.
bullishDivergence(pivotArray)
Look for bullish divergence in a pivotPoint array cointaining pivot lows.
Parameters:
pivotArray (pivotPoint ) : (array pivotPoint) The pivotPoint array to inspect.
Returns: bool True if bullish divergence was found.
uptrendPivot(leftBars, rightBars, indicator, reset, plotLabel, plotLine)
Detects higher highs, higher lows and bearish divergence in an uptrend. Creates a line when bearish divergence is found, and labels.
Parameters:
leftBars (int) : (int)
rightBars (int) : (int)
indicator (float) : (float) RSI, MACD or other value.
reset (bool) : (bool) A bool variable to reinitiates the pivot computation, such as time changes, crossovers, or another.
plotLabel (bool) : (bool) If true (default), plots labels to higher highs and for each pivot low. Default = true.
plotLine (bool) : (bool) If true (default), plots a line linking the lower lows with divergence. Default = true.
Returns:
downtrendPivot(leftBars, rightBars, indicator, reset, plotLabel, plotLine)
Detects lower lows, lower highs, and bullish divergence in a downtrend. Creates a line when bullish divergence is found, and labels.
Parameters:
leftBars (int) : (int)
rightBars (int) : (int)
indicator (float) : (float) RSI, MACD or other value.
reset (bool) : (bool) A bool variable to reinitiates the pivot computation, such as time changes, crossovers, or another.
plotLabel (bool) : (bool) If true (default), plots labels to lower lows, and for each pivot low.
plotLine (bool) : (bool) If true (default), plots a line linking the lower lows with divergence. Default = true.
Returns:
pivotPoint
The coordinates of a pivot point and corresponding indicator value.
Fields:
x (series int) : (int) Time.
y (series float) : (float) Price.
indicator (series float) : (float) Indicator value.

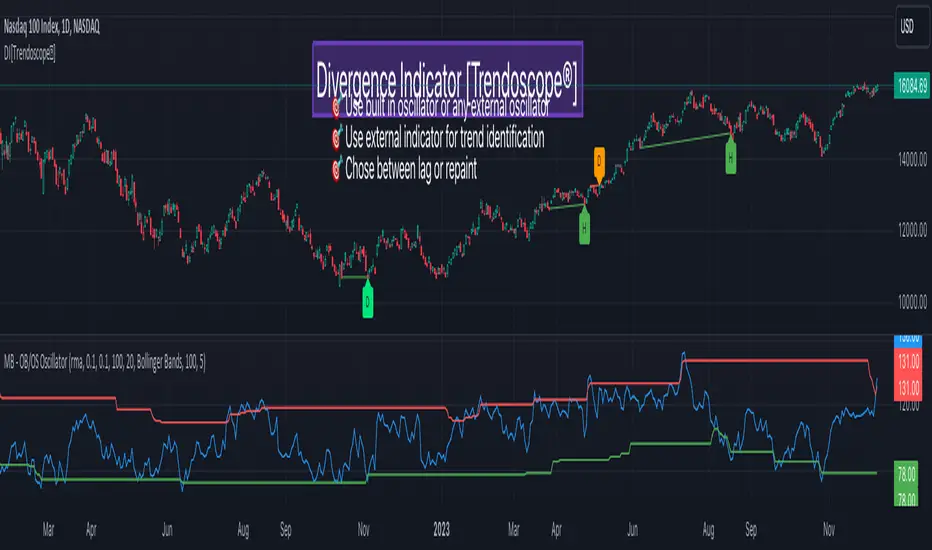
Divergence Indicator [Trendoscope®]🎲 New Divergence Indicator by Trendoscope
Our latest Divergence Indicator revolutionizes the way traders identify market trends and potential reversals. Built upon the robust foundation of the Zigzag Trend Divergence Detector and inline with our recent implementation of the Divergence Goggles indicator, this tool is designed to be intuitive yet powerful, making it an essential addition to any trader's toolkit.
We received several queries on extending the Divergence Goggles to last N bars instead of using an interactive widget. Though it is possible, we thought the better approach is to enable the indicator to use any oscillator and trend indicator in order to define the divergence.
🎯 Key Features
Flexible Oscillator Integration : Choose from a wide range of built-in oscillators or import your own, including options like the innovative Multiband Oscillator. This versatility extends to using volume indicators like OBV for divergence calculations, broadening the scope of analysis.
Trend Identification Versatility : Utilize built-in methods like Zigzag and MA Difference, or integrate external trend indicators. Our system adapts to various methods, ensuring you have the right tools for precise trend identification.
Customizable Zigzag Sensitivity : Adjust the Zigzag based on your chosen oscillator's sensitivity to ensure divergence lines are accurate and visually coherent.
Repainting vs. Delayed Signals : Tailor the indicator to your strategy by choosing between immediate repainting signals and slightly delayed but more stable signals.
🎯 Understanding Divergence: Key Rules
Bullish Divergence
Happens only in downtrend
Observed on Pivot Lows
Price makes lower low whereas oscillator makes higher low, indicating weakness and possible reversal
Bearish Divergence
Happens only in uptrend
Observed on Pivot Highs
Price makes higher high whereas oscillator makes lower high, indicating weakness and possible reversal
Bullish Hidden Divergence
Happens only in uptrend
Observed on Pivot Lows
Price makes higher low, whereas indicator makes lower low due to price consolidation. In bullish trend, this is considered as bullish as the price gets a breather and get ready to surge further.
Bearish Hidden Divergence
Happens only in downtrend
Observed on Pivot Highs
Price makes lower high whereas oscillator makes higher high due to price consolidation. In bearish trend, this is considered as bearish as the price gets a breather and get ready to fall further.
🎯 Visual Insights: Divergence and Hidden Divergence
For a clearer understanding, refer to our visual guides:
🎲 Using the Divergence Indicator: A Step-by-Step Guide
🎯 Step 1 - Selecting the Oscillator
Customize your analysis by choosing from a variety of oscillators or importing your preferred one. Options are available to select a range of built-in oscillators and the loopback length. However, if the oscillator that user want to use is not in the list, they can simply load the oscillator from the indicator library and use it as an external signal.
In our current example, we are using a custom oscillator called - Multiband Oscillator
This also means, the indicator option is not limited to oscillators. Users can even make use of volume indicators such as OBV for the calculation of divergence.
🎯 Step 2 - Choosing the Trend Identification Method
Select from our built-in methods or integrate an external indicator to accurately identify market trends. Trend is one of the key parameters of divergence type identification. Trend can be identified mathematically by various methods. Some of them are as simple as above or below 200 moving average and some can follow trend based indicators such as supertrend and others can be very complex.
To cater for a wider audience, here too we have provided the option to use an external trend indicator. The simple condition for the external trend indicator is that it should return positive value for uptrend and negative value for downtrend.
Other than that, we also have 2 built in trend identification methods.
Zigzag - The trend is defined by the starting pivot of divergence line. If the starting pivot is Higher High or Higher Low, then it is considered uptrend. And if the starting pivot is either Lower Low or Lower High, then we consider it as downtrend.
MA Difference - In this case, the difference between the moving average of pivots joining the divergence line will determine the trend. It is considered uptrend if the moving average increased from starting pivot to ending pivot of the divergence line, and it is considered downtrend if the moving average decreased from starting pivot to the ending pivot of the divergence line.
🎯 Step 3 - Adjusting Zigzag Sensitivity
Fine-tune the Zigzag to match the oscillator's sensitivity, ensuring divergence lines are accurate and visually coherent.
🎯 Step 4 - Managing Repainting
Understand the implications of repainting in the last pivot of the Zigzag and choose between immediate or delayed signals based on your trading strategy. The last pivot of the zigzag repaint by design. This is not necessarily a bad thing. Users can just choose not to use the last pivot, but instead use the last but one for all the calculations. But, this also means, the signals will be delayed.
Indicator provides option to use repainting signal vs delayed signal. If you select the repaint option, the signals are shown immediately as and when they occur. But, there is a possibility that these signals change when the new price candles change zigzag pivot.
If you chose not to select the repaint option, then the divergence signals may lag by a few bars.
RSI-Divergence Goggles [Trendoscope®]🎲 Introducing the RSI-Divergence Goggle
🎯 Revolutionizing Divergence Analysis in Trading
While the concept of divergence plays a crucial role in technical analysis, existing indicators in the community library have faced limitations, particularly in simultaneously displaying divergence lines on both price and oscillator graphs. This challenge stems from the fact that RSI and other oscillators are typically plotted in a separate pane from the price chart. Traditional Pine Script® indicators are confined to a single pane, thus restricting comprehensive divergence analysis.
🎯 Our Innovative Solution: RSI on the Price Pane
The RSI-Divergence Goggle breaks through these limitations. Our innovative approach involves plotting the RSI directly onto the price pane within a movable and resizable widget. This groundbreaking feature allows for the simultaneous drawing of zigzag patterns on both price and the oscillator, enabling the effective calculation and visualization of divergence lines on both.
🎯 The Foundation: Our Divergence Research and Rules
Our journey into divergence research began three years ago with the launch of the "Zigzag Trend Divergence Detector." The foundational rules established with this script remain pertinent and form the basis of all our subsequent divergence-based indicators.
🎯 Understanding Divergence: Key Concepts
Divergence Varieties : We identify two main types - Bullish Divergence (and its hidden counterpart) occurs at pivot lows, while Bearish Divergence (and its hidden version) appears at pivot highs.
Contextual Occurrence : Bullish divergence is a phenomenon of downtrends, whereas bearish divergence is unique to uptrend. Conversely, hidden bullish divergence arises in uptrends, and hidden bearish divergence in downtrends.
Oscillator Behavior : In standard divergence scenarios, the oscillator lags behind price, signaling potential reversals. In hidden divergence cases, the oscillator leads, suggesting trend continuation.
🎯 Visual Insights: Divergence and Hidden Divergence
For a clearer understanding, refer to our visual guides:
🎯 A Word of Caution
While divergence is a powerful tool, it's not a standalone guarantee of trend reversals or continuations. We recommend using these patterns in conjunction with support and resistance levels, as demonstrated in our "Divergence Based Support Resistance" implementation.
🎯 Using the RSI-Divergence Goggles
Upon applying the indicator to your chart, you'll be prompted to select two corner points, defining the widget's placement and size. This widget is the stage for your RSI plotting and divergence calculations. Choose these points carefully to ensure they encompass your area of interest without overlapping important price bars.
An example as below.
🎯 Innovative Features:
Plotting RSI: RSI values are scaled from 0 to 100 within the widget. This unique plotting may not align with individual bar values, but pivot labels and tooltips provide detailed RSI and retracement ratio information.
Zigzag and Pivots: Our adjusted RSI plots determine the zigzag pivot highs and lows, which may not always correspond with visible price pivots. However, calculations based on close prices ensure minimal deviation.
Divergence Display: Divergence types are identified following our established rules, with a simple moving average employed to discern the prevailing trend.
🎯 Trend Detection Mechanism
A simple moving average is used as base for determining the trend. If the difference between moving averages of the alternate pivots is positive, then the sentiment is considered to be uptrend. Else, we consider the sentiment to be in downtrend.
This is a simple method to identify trend, implemented via this indicator. The indicator does not provide alternative methods to identify trend. This is something that we can explore in the future.
🎯 Interactive and Customizable
The RSI-Divergence Goggle isn't just a static tool; it's an interactive feature on your chart. You can move or resize the widget, allowing for dynamic analysis and focused study on different chart segments.

BUY/SELL RSI FLIUX v1.0The "BUY/SELL RSI FLUX v1.0" indicator is designed to provide buy and sell signals based on the RSI (Relative Strength Index) and price action in relation to support and resistance levels. It overlays directly on the price chart and includes the following components:
- Support and Resistance Levels: Determined over a specified number of bars (lengthSR), these levels represent potential barriers where price action may stall or reverse.
- ATR (Average True Range): Used to measure market volatility. While it's calculated in the script, it's not visualized on the chart as per the latest modification.
- RSI: The RSI is calculated over a defined period (lengthRSI) and is used to identify overbought or oversold conditions. Buy signals are generated when the RSI is below the oversold threshold (rsiOversold) and the price is above the support level. Conversely, sell signals occur when the RSI is above the overbought threshold (rsiOverbought), the price is below the resistance level, and additionally, the price is below a long-term moving average, which acts as a trend filter.
- Long-Term Moving Average: This moving average is plotted to help identify the prevailing market trend. Sell signals are filtered based on the price's position in relation to this moving average.
- Buy/Sell Signals: Visual representations in the form of shapes are plotted below (for buy) or above (for sell) the price bars to indicate potential entry points.
By combining these elements, the indicator aims to provide high-probability trading signals that align with both the market's momentum and trend.

Fisher+ [OSC]The Fisher Transform Indicator is classified as an oscillator, meaning that its value swings above and below a central point. This characteristic allows traders to identify overbought and oversold conditions, providing potential clues about market reversals. As mentioned previously, it is an oscillator so the strength of the move is displayed by how long the fisher line stays above/below zero. Indicator can be used to aid in confluence near supply/demand zones.
White Line = Fisher
Red/Blue Line = Moving Average
--Changes color whether fisher line is above/below the MA
Red/Blue Shaded Line = Moving Average
--Changes color based on a smoothing factor
Red/Blue Shaded Fill = Asset in Overbought/Oversold Conditions
Red/Blue Circles = Asset in Extreme Overbought/Oversold Conditions
Red/Blue Triangles = MACD Signals Below/Above "0"
Divergence Labels = Asset Signaling Divergence
The moving average line will turn red/blue as long as the fisher line is below/above the moving average. The shaded MA line will switch colors based on if it is moving in an up/down trend. The MA can also be used as a signal and treated similar to an oscillator. Market trending conditions will either keep the MA below/above the dashed zero line.
MACD code credited to LazyBear's MACD Leader indicator. It is used to filter out/confirm any signals such as divergences. As long as the MACD Leader line is above both the MACD line and signal lines then it'll signal with with a triangle. MACD divergences will be added at a later time.

MAutoFloorCeiling* MAutoFloorCeiling Indicator *
The MAutoFloorCeiling indicator is a powerful algorithm utilizing Wyckoffian concepts of Supply, Demand, and Volume Climaxes to determine and draw Support / Resistance levels automatically. It is the culmination of over 2 years of research. Drawing Support / Resistance lines automatically is a tremendous benefit to the trader as this provides structure to price and exposes market movement as well as which areas price is likely to respect or break out of.
* WHAT THE SCRIPT DOES *
The MAutoFloorCeiling algorithm draws Floor and Ceiling lines automatically. The price points at which these lines are drawn at are areas of increasing Supply, Demand, or Volume Climax respective to their Price Levels. Areas of Volume Climaxes are often respected by price, since price tends to return to them or break out of them, and hence form powerful Support / Resistance levels.
* HOW TO USE IT *
Floor and Ceiling lines correspond to Support and Resistance lines. When a line is draw consider the following questions
Is it a top / bottom?
Is it support / resistance?
Is it a breakout / breakdown?
Is it a pullback?
* HOW IT WORKS *
1. There are 2 types of lines: Floors and Ceilings
2. A Floor Line is drawn when there is a "Selling Volume Bias" (Volume Climaxes on downward price movement)
More Floor Lines get drawn if market continues to go lower combined with a "Selling Volume Bias"
3. A ceiling line is drawn when there is a "Buying Volume Bias" (Volume Climaxes on upward price movement)
More ceiling lines get drawn if market continues to go higher combined with a "Buying Volume Bias"
4. There is a 1 bar delay to confirm the creation of a new floor / ceiling line.
Once the new floor / ceiling is created, it draws forward with no delay.
* EXAMPLE AND USE CASES *
MAutoFloorCeiling draws lines that can be used as effective Support / Resistance Levels, Breakout Lines, and Pullback areas. Studying the Volume at these levels can provide insight as to where price is likely to go.
You can scan for Trend Like behavior such as
More Demand on Higher High = Increase in Volume on a Higher Ceiling
More Supply on Lower Low = Increase in Volume on a Lower Floor
You can scan for divergences such as
Less Demand on Higher High = Lower volume on a Higher Ceiling
Less Supply on on Lower Low = Lower volume on a Lower Floor
Pullbacks
A lower ceiling is representative of a pullback when price is going down.
A higher floor is representative of a pullback when price is going up.
You can inspect instances where the thrust of price is shortened, which means the distance between Ceiling or Floor lines becomes less as price struggles to continue in the direction it was moving. Or conversely the thrust of price as shown by the Floor / Ceiling lines can expand, which is indicative of a trend forming.
* AUTHOR *
This script is published by MBoxWave LLC

YD_Divergence_RSI+CMFThe ‘YD_Divergence_RSI+CMF’ indicator can find divergence using RSI (Relative Strength Index) and CMF (Chaikin Money Flow) indicators.
📌 Key functions
1. Search pivot high and pivot low points in a certain length of price.
2. Connect pivot high to pivot high , pivot low to pivot low , forming two standards for divergence in result.
The marker then plots only the higher high, lower low lines.
(higher low and lower high in prices are referred to hidden divergence, which are not considered in this indicator)
3. Compare the two standards with RSI and CMF indicators, send an alert if there is a divergence. As a result, the indicator will find four combination of divergence.
A. Higher high price / Lower RSI (Bearish RSI Divergence)
B. Lower low price / Higher RSI (Bullish RSI Divergence)
C. Higher high price / Lower CMF (Bearish CMF Divergence)
D. Lower low price / Higher CMF (Bullish CMF Divergence)
📌 Details
Developing the indicators, we put a lot of effort in making a customizable and user-friendly interface.
#1. Pivot Setting
Users can set the length to find the pivot high / pivot low in ‘Pivot Settings – Pivot Length.’
Increased pivot Length takes more candles to interpret the chart but reduce false signals since the it uses only the most certain pivot high / pivot low values. Obviously, decreased pivot length will act the opposite.
Users can choose whether to use ‘High/Low’ or ‘Close’ in ‘Pivot Reference’ to set the swing point of prices.
Users can also choose whether to display the pivot high / pivot low marker on the chart.
#2 RSI & CMF Settings
Users can adjust the length of RSI & CMF separately. (The default values are set to 14 and 20 each.)
#3 Label Setting
Users can adjust the text displayed on the chart label. (The default values is set to ‘Bullish / Bearish’, ‘RSI/CMF’, ‘Divergence’.)
Users can reduce the length of text label or simply turn the label off. Just click the ‘Bull/Bear’ or ‘None’ button. ‘Divergence’ works the same.
Users can decide whether to display the ‘Divergence Line and Label’, set custom settings for the label and line. (color, thickness, style, etc)
📌 Alert
Alert are provided as a combination of the chart's symbol and the set label text. For example,
‘BINANCE:BTCUSDT.P, Bullish RSI Divergence’
====================================================
"YD_Divergence_RSI+CMF" 지표 는 RSI와 CMF 지표를 이용해서 Divergence 를 찾아낼 수 있습니다.
📌 주요 기능
1. 정해진 가격 움직임 안에서 pivot high와 pivot low 포인트 를 찾아냅니다.
2. Pivot high로만 이어진 라인과, Pivot low로만 이어진 두 라인을 작도한 뒤 divergence의 기준으로 삼습니다.
이 지표에서는 normal divergence만 사용하기 때문에 차트에 higher high와 lower low만 표기 합니다.
(higher low와 lower high는 hidden divergence로 정의되며, 이 지표에서는 다루지 않습니다.
3. 두 기준선과 RSI, CMF 지표를 각각 비교하고, 결과적으로 4개의 조합을 구할 수 있습니다.
A. Higher high price / Lower RSI (Bearish RSI Divergence)
B. Lower low price / Higher RSI (Bullish RSI Divergence)
C. Higher high price / Lower CMF (Bearish CMF Divergence)
D. Lower low price / Higher CMF (Bullish CMF Divergence)
📌 세부 사항
지표를 개발하며 사용자들이 원하는 방향으로 지표를 설정할 수 있게 작업에 많은 공을 들였습니다. 굉장히 다양한 옵션을 선택할 수 있으며, 원하는 방식으로 지표를 사용할 수 있습니다.
#1 Pivot Setting
Pivot setting에서는 Pivot Length를 변경할 수 있습니다.
Pivot Length를 늘릴 경우, 보다 확실한 Swing High와 Swing Low만을 사용하게 되므로, False signal이 줄어들 수 있습니다. 하지만 Swing High/ Low를 판정하는 데에 더 긴 시간이 걸리게 되므로, Signal이 다소 늦게 발생하는 단점이 생기게 됩니다.
Pivot Length를 줄일 경우, 반대로 Swing High/Low의 판정이 더 빨리 일어나기 때문에, Signal을 거래에 이용하기는 좋을 수 있습니다. 다만, Swing High와 Low가 훨씬 더 잦은 빈도로 발생하기 때문에 False Signal을 줄 가능성이 높아집니다.
Pivot Reference에서는 가격의 Swing Point를 설정함에 있어, High/Low(고가/저가)를 이용할 지 Close (종가)를 이용할 지 선택할 수 있습니다.
Pivot High/Low Marker를 선택할 경우 Pivot High/ Low에 Marker가 찍히게 됩니다.
#2 RSI와 CMF Setting
RSI와 CMF Setting에서는 RSI와 CMF의 길이를 각각 설정할 수 있습니다. 기본값은 14와 20으로 설정되어 있습니다.
#3 Label Setting
Label Setting에서는 Label에 표시되는 글자를 선택할 수 있습니다.
기본값은 "Bullish / Bearish", "RSI/CMF", "Divergence"로 선택되어 있으며, 너무 길다고 느껴질 경우 "Bull/Bear" 혹은 "None"을 클릭하여 길이를 줄일 수 있습니다. 마찬가지로 Divergence의 경우도 생략이 가능합니다.
하단에서는 Divergence Line과 Label을 켜고 끌 수 있으며, 선의 색깔, 굵기, 종류, 그리고 Label의 색깔, 크기, 종류를 선택할 수 있습니다. Label의 Text 색 역시 변경이 가능합니다.
📌 얼러트
얼러트는 자신이 설정한 차트의 심볼과 Label의 문구의 조합으로 제공되며 예를 들면 다음과 같습니다.
"BINANCE:BTCUSDT.P, Bullish RSI Divergence"

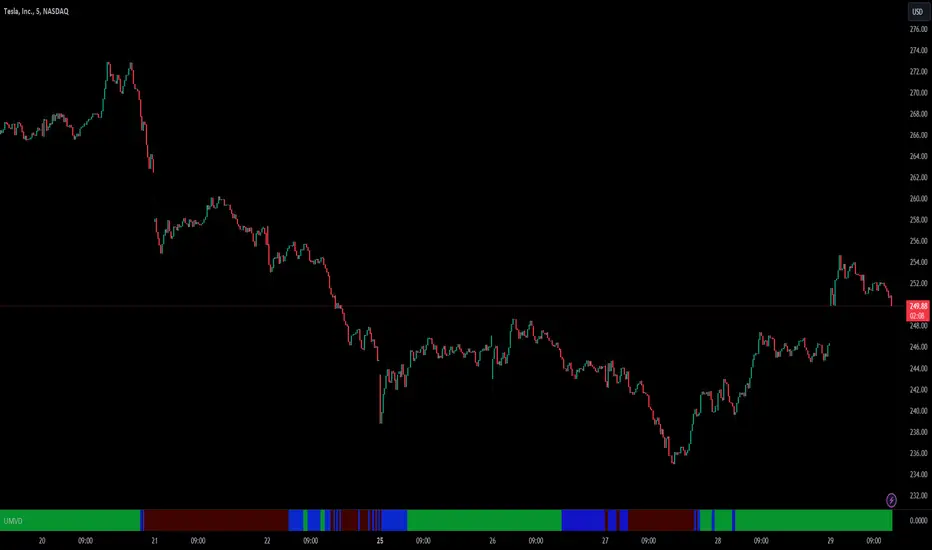
Unusual Market Volume DetectorIntroduction
Price usually moves in lockstep with the volume trends i.e. price goes higher when there is buying and it goes down when there is selling in the market. But sometimes, the market behaves unusually i.e. Price and volume move in opposite directions. This indicator identifies precisely this divergent behavior in the market!
This script analyses the volume trends by utilizing changes in On Balance Volume (OBV) for the instrument and compares it with the price trend to color the lower panel on your chart window. The color changes as the direction of the OBV trend changes from Up to Down or vice versa. If there is a divergence between the price trend and volume trend, the color will switch to Purple.
Divergence in volume and price trends typically indicate a battle between supply and demand. This may coincide with a change in market direction as well. It is important to know which side won after this battle, as the market will follow that side.
This tool will alert traders of unusual market volume behavior and when both price & volume trends are in sync.
Features
A Purple color in the lower panel indicates that the Volume and Price trends are diverging and are moving in the opposite direction
A Green color in the lower panel indicates that the Volume is trending higher supporting bullish price action
A Red color in the lower panel indicates that the Volume is trending lower supporting bearish price action
How to use the Indicator while Trading?
When the Volume trend matches the price action ( Trend ), you have confirmation of your trade bias. Therefore when you are taking Long trades, you would want to see a Green color in the lower panel and a Red color when you are going Short.
When a Divergence is identified by the tool, as Purple color in the lower panel, Trader can take the following steps:
Take profit or partially close the position if you are in a Trade as this divergence presents
uncertainty
Watch for which color comes up after divergence, that side of the market has a higher
probability of prevailing. For example, a Red color indicates Selling in the market and vice
versa.
Divergence usually precedes a market direction change and therefore Trader can take this
into account when planning Trade bias and position size. Please note a divergence does
not always precede a reversal in the market and can be a temporary phenomenon with no
effect on the price action.
Basic Set-Up
Add the Indicator to the chart
You can change the default colors for Buying Volume, Selling Volume, and Divergence
Use the “Regular Trading Hours” Session in the Chart Settings for the most effective analysis
Please note : On-Balance Volume is a leading indicator but it doesn't provide specific information on exactly what happened or why. Also, a large spike in a single day may throw off the On Balance Volume for a while. Therefore we are focusing on its trend and comparing it with Price Trends for better effectiveness.
Volumetric Toolkit [LuxAlgo]The Volumetric Toolkit is a complete and comprehensive set of tools that display price action-related analysis methods from volume data.
A total of 4 features are included within the toolkit. Symbols that do not include volume data will not be supported by the script.
🔶 USAGE
The volumetric toolkit puts a heavy focus on price action, returning support/resistance levels, ranges, volume divergences...etc.
The main premise between each feature is that volume has a direct relationship with market participants level of interest over a specific symbol, and that this interest is not constant over time.
Each individual feature is detailed below.
🔹 Ranges Of Interest
The Ranges Of Interest construct a range from a surge of high liquidity in the market. This range is constructed from the price high and price low of the candle with the associated significant liquidity.
The returned extremities can be used as support and resistance, with breakouts often being accompanied by significant liquidity as well, suggesting potential trend continuations.
The length setting associated with this feature determines how sensitive the range detection algorithm is to volume, with higher values requiring more significant volume in order to display a new range.
🔹 Impulses
Impulses highlight times when volume makes a new higher high while the price makes a new higher high or lower low, suggesting increased market participation.
When this occurs when the price makes a new higher high the impulse is considered bullish (green), if the price makes a new lower low the impulse is bearish (red).
Impulses occurring within an established trend opposite to it (e.g a bearish impulse on an uptrend) might be indicative of reversals.
The length setting works similarly to the previously described ranges of interest, with higher values requiring longer-term volume higher high and price higher high/lower low, highlighting more significant impulse and potentially longer-term reversals.
🔹 Levels Of Interest
Levels of interest display price levels of significant trading activity, contrary to the range of interest only the closing price is taken into account, also volume peaks are used to detect significant trading activity.
Note that this feature is subject to backpainting, that is lines are set retrospectively.
Users can determine the amount of most recent levels to display on the chart. These can be used as classical support/resistances.
🔹 Volume Divergence
We define volume divergence as a decreased market participation while a trend is still developing.
More precisely volume divergences are highlighted if volume makes a lower high while price is making a new higher high/lower low.
This can be indicative of a lack of further participation in the current trend, indicating a potential reversal.
Using higher length values will return longer-term divergences.
Note that this feature is subject to backpainting, that is lines are set retrospectively.
🔶 SETTINGS
🔹 Ranges Of Interest
Show Ranges Of Interest: Display Ranges Of Interest.
Length: Ranges Of Interest sensitivity to volume.
🔹 Impulses
Show Impulses: Display Ranges Of Interest.
Length: Impulses sensitivity to volume.
🔹 Levels Of Interest
Show: Determine if Levels Of Interest are displayed, and how many from the most recent.
Length: Level detection sensitivity to volume.
🔹 Volume Divergences
Show Divergences: Determine if Volume Divergences are displayed.
Length: Period for the detection of price tops/bottoms and volume peaks.

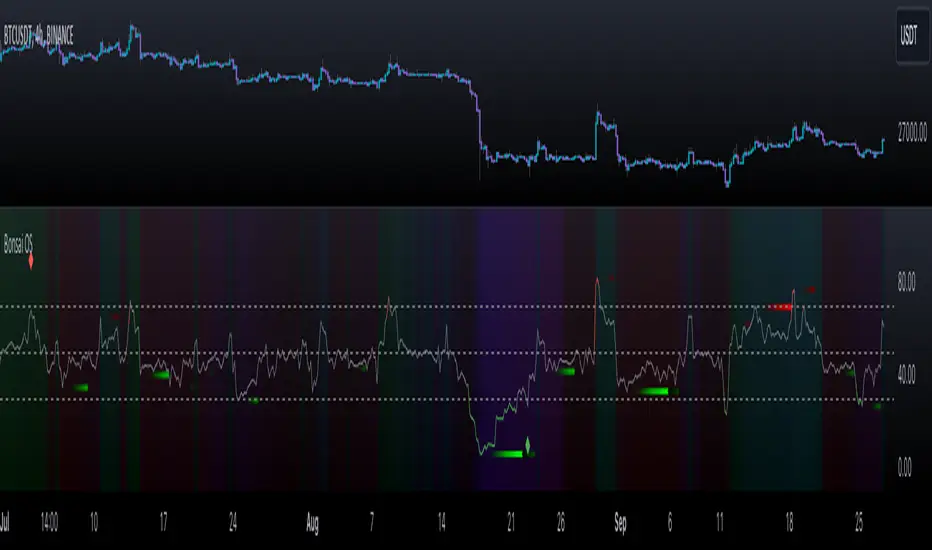
Bonsai OS (Oscillators)Bonsai OS combines four oscillators (RSI, CCI, Stochastic, MACD) in one interface. Features divergence detection, color-intensity, and insights into divergences. Assists traders in spotting potential pivot points.
═════════════════════════════════════════════════════════════════════════
🌳 Bonsai OS 🌳 Advanced Oscillator Suite
📘 Overview
Bonsai OS is a tool tailored for traders focusing on reversal strategies and those keen on identifying market divergences. Combining multiple oscillators into one unified interface, it aids traders in pinpointing potential pivot reversal points.
📌 Algorithm Logic
• Multi-Oscillator Integration: Bonsai OS calculates and integrates the values from four standard oscillators: RSI, CCI, Stochastic, and MACD. Each oscillator's value is derived from its respective mathematical formula, analyzing historical data points.
• Divergence Detection: The tool runs a series of comparisons between price action and oscillator values. When discrepancies (divergences) are observed, they are highlighted, suggesting potential market reversals.
• Price Strength Visualization: A gradient background that is determined by an average of the oscillator values in relation to their historical norms, thereby providing a visual cue about the current price strength, whether it is strong or weak.
• Alerts: Users can set up notifications based on specific divergence insights. Once set criteria are met, alerts are triggered.
🎯 Purpose
• For Professionals: Bonsai OS offers integrated oscillator readings, allowing a more in-depth market analysis.
• For Beginners: Simplified readings and visual cues make it easier for newcomers to understand oscillator indicators and market conditions.
🛠 Distinctive Elements
• Oscillator Fusion: Bonsai OS goes beyond just grouping oscillators. It looks for matching divergences across them, aiming to find stronger signals for market reversals.
• Divergence Indicators: Bonsai OS identifies divergence patterns between price trends and oscillator readings, highlighting their intensity with color variations.
• Insight into Failed Divergences: Recognizing not all divergences lead to reversals, Bonsai OS provides markers for potential false signals, helping traders exercise caution and fine-tune their strategies.
Getting Bullish/Bearish and Divergences
📊 Features
• Data Source Customization: Users have the flexibility to choose between default data inputs or adjust to their preferred price points (like High & Low).
• Combined Divergence Signals: Beyond individual oscillator divergences, Bonsai OS identifies instances when several oscillators indicate divergence at the same time.
• Adaptable Outputs: Outputs like 'Bullish Divergence ▲', 'Getting Bullish ▲', 'Getting Bearish ▼' and 'Bearish Divergence ▼' are plotted as non-displayable 1 or 0 for seamless integration into other custom indicators, ensuring a harmonious integration.
Here's an example of a custom indicator that can be used for inputting data from external sources:
//@version=5
indicator("My Script Template", overlay = true)
group_name = "External Source"
external = input.source(title = "Source", defval = close, inline = "external", group = group_name)
val = input.int(title = ">", defval = 0, inline = "external", group = group_name)
// Your logic follows here...
Bonsai OS as External Source
🎛 How To Use Bonsai OS
1. Select the desired oscillator.
2. Monitor the color changes for market condition insights.
3. Look out for divergence markers to anticipate potential market shifts.
4. If required, set up alerts for real-time updates.
Indicator Settings Menu
📜 Feedback & Continual Development
We welcome your feedback. It's essential for the continuous improvement of Bonsai OS and to better serve the TradingView community.
❗️ Disclaimer
Trading involves risks. Bonsai OS aims to provide an analytical tool to support traders, but it's essential to complement its insights with other research. Always seek advice from financial professionals and trade responsibly.
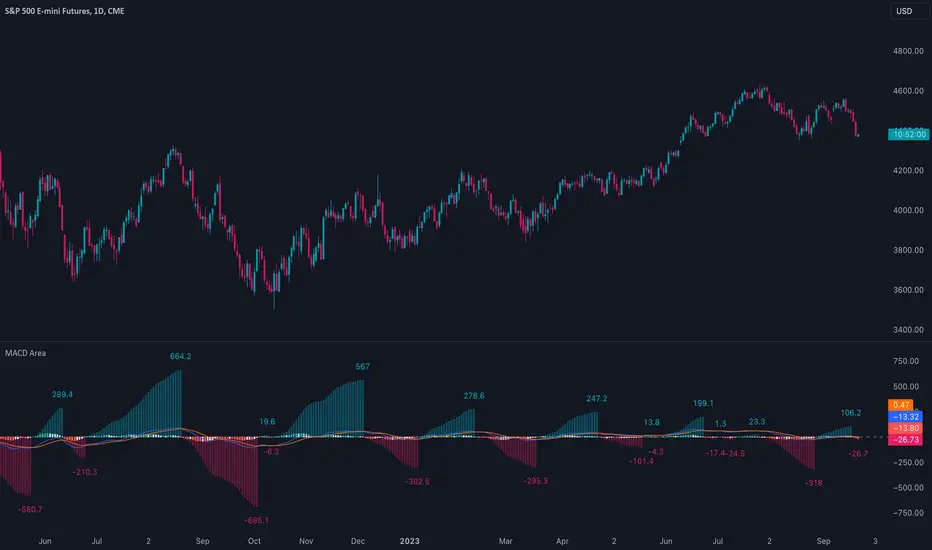
MACD AreaThis indicator calculates and displays the cumulative area for each region above and below the zero line in the MACD histogram. This area measurement serves as a momentum metric, where larger cumulative areas indicate stronger momentum. Divergences between the area and price can also potentially indicate an impending reversal. For example, when the stock price makes a higher high but the area makes a lower high, the current momentum may be unsustainable.
VWAP Divergence | Flux ChartsThe VWAP Divergence indicator aims to find divergences between price action and the VWAP indicator. It uses filters to filter out many of the false divergences and alert high quality, accurate signals.
Red dots above the candle represent bearish divergences, while green dots below the candle represent bullish divergences.
The main filter for divergences focuses on ATR and the price movement in the past candles up to the lookback period. Divergences are determined when a price movement over the lookback period is sharp enough to be greater/less than the ATR multiplier multiplied by the ATR.
Settings
Under "Divergence Settings", both the lookback period and ATR multiplier can be adjusted.
Due to the nature of the calculations, the ATR multiplier and the lookback period should be set lower on higher time frames. As price movements become more averaged, for example on the 15 minute chart, sharp price movements happen less frequently and are often contained in fewer candles as they happen on lower time frames. Less volatile stocks such as KO, CL, or BAC should also use lower ATR multipliers and lower lookback periods.
Under "Visual Settings", you can change the color of the VWAP line, show alternating VWAP colors, adjust divergence signal size, and show the VWAP line.

Investor Satisfaction/Price Divergence Pro [Ox_kali]The "Investor Satisfaction/Price Divergence" is an indicator designed to quantify and juxtapose the satisfaction of a group of investors with potential price divergences of the asset.
The primary goal of this indicator is to provide a reliable tool for gauging investor sentiment and identifying price divergences. These insights can be instrumental in predicting possible market trend reversals.
Key Features
Calculation of the highest and lowest prices over a user-defined period.
Computation of the average satisfaction of investors who have invested over a user-defined period.
Normalization of average satisfaction between 0 and 1 to provide a standardized measure of investor sentiment.
Identification of price divergence between the normalized satisfaction and the actual asset price.
Detection of anomalies in satisfaction change, which can suggest unusual market conditions.
Plotting histogram display of the difference between normalized satisfaction and price divergence.
Functionality Analysis:
This indicator begins by identifying the highest and lowest prices over a period defined by the user. It then calculates the average investor satisfaction based on the change in the closing price from the investment point to the current price, relative to the range between the highest and lowest prices.
This satisfaction measure is then normalized between 0 and 1, providing a uniform measure of investor sentiment. The indicator also identifies potential price divergence by comparing the normalized satisfaction with the normalized price. This divergence is then plotted as a histogram, with the color of the histogram bars indicating whether the market is oversold, overbought, or in a normal state. Anomalies in satisfaction change are highlighted in yellow, helping traders to spot unusual market behavior.
Trading Application
The "Investor Satisfaction & Price Divergence" indicator can be incorporated into a variety of trading strategies. A significant divergence between normalized satisfaction and the asset price can signal a potential market reversal. Additionally, a sudden drop or rise in investor satisfaction could indicate a sell-off or a buying spree, respectively. Additionally, the capability to spot irregularities in satisfaction change may be useful in recognizing unusual market conditions, possibly providing early indications of noteworthy market events
Please note that the investor Satisfaction/Price Divergence by Ox_kali is provided for educational purposes only and is not meant to constitute financial advice. This indicator is not a guarantee of future market performance and should be used in conjunction with proper risk management. Always ensure that you have a thorough understanding of the indicator’s methodology and its limitations before making any investment decisions. Additionally, past performance is not indicative of future results.
RSI + Divergences + Alerts [MisterMoTA]The indicator RSI + Divergences + Alerts by MisterMoTA is an RSI indicator that fills the RSI and RSI moving average with 4 different colors (growing up, falling up, falling down and rising down colors), users can customize colors from dashboard , also can be disabled the fill if the user want a standard RSI.
The dafault value of RSI is 14 and value of the moving average is 50 ( a dynamic 50 rsi line is better for trend identification than a standard 50 line) and users can change the values from indicator settings.
For detecting the divergences displayed in the indicator, I integrated in our script the default Divergences indicator from Tradingview, users can display, hide and change colors for regular and hidden divergences.
RSI indicator display also trend conditions for RSI and RSI MA, the RSI MA angle is calculated using ATR value, the slope of the RSI Noving Average can help to identify trend conditions too.
The script comes with 12 different alerts, if need different alerts please let me know in the comments and will update the script with your request:
Alert for Regular Bullish Divergence
Alert for Regular Bearish Divergence
Alert for Hidden Bullish Divergence
Alert for Hidden Bearish Divergence
Alert for RSI Overbought
Alert for RSI Extreme Overbought
"Alert for RSI Oversold
Alert for RSI Extreme Oversold
Alert for RSI Crossing Above RSI MA
Alert for RSI Crossing Bellow RSI MA
Alert for RSI Crossing Above 50
Alert for RSI Crossing Bellow 50
Please follow me for other script like this one.
Kind regards,
MisterMoTA

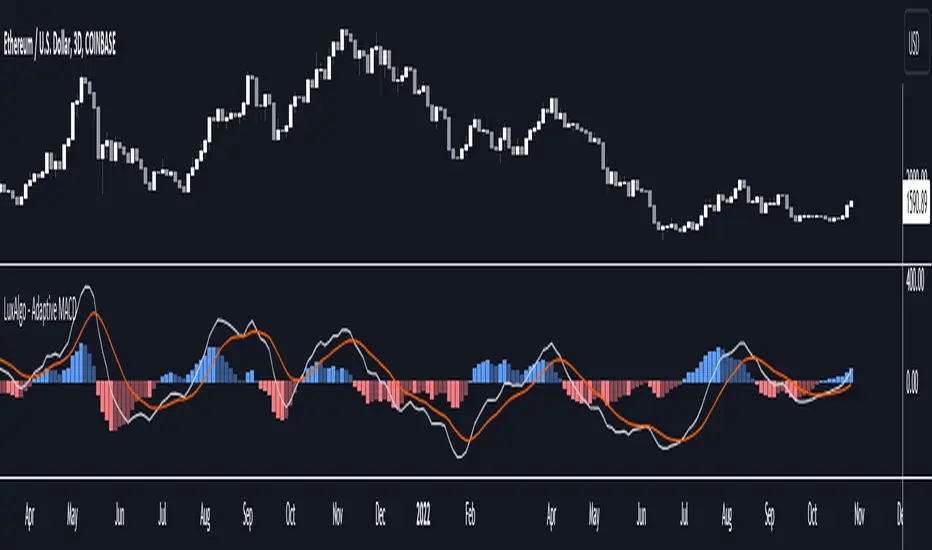
Adaptive MACD [LuxAlgo]The Adaptive MACD indicator is an adaptive version of the popular Moving Average Convergence Divergence (MACD) oscillator, returning longer-term variations during trending markets and cyclic variations during ranging markets while filtering out noisy variations.
🔶 USAGE
The proposed oscillator contains all the elements within a regular MACD, such as a signal line and histogram. A MACD value above 0 would indicate up-trending variations, while a value under 0 would be indicating down-trending variations.
Just like most oscillators, our proposed Adaptive MACD is able to return divergences with the price.
As we can see in the image above ranging markets will make the Adaptive MACD more conservative toward more cyclical conservations, filtering out both noise and longer-term variations. However, when longer-term variations (such as in a trending market) are prominent the oscillator will conserve longer-term variations.
The R2 Period setting determines when trending/ranging markets are detected, with higher values returning indications for longer intervals.
The fast and slow settings will act similarly to the regular MACD, however, closer values will return more cyclical outputs.
The image above compares our proposed MACD (top) with a regular MACD (bottom), both using fast = 19 and slow = 20 .
🔶 DETAILS
It is common to be solely interested in the trend component when the market is trending, however, during a ranging market it is more common to observe a more prominent cyclical/noise component. We want to be able to preserve one of the components at the appropriate market conditions, however, the regular MACD lack the ability to preserve cyclical component with high accuracy.
The MACD is an IIR bandpass filter. In order to obtain a lower passband bandwidth and a more symmetrical magnitude response (which would allow to conserve more precise cyclical variations) we can directly change the system calculation:
y = (price - price ) × g + ((1 - a1) + (1 - a2)) × y - (1 - a1) × (1 - a2) × y
where:
a1 = 2/(fast + 1)
a2 = 2/(slow + 1)
g = a1 - a2
Using division instead of multiplication on the second feedback weight allows further weighting the 2 samples lagged output, returning a more desirable magnitude response with a higher degree of filtering on both ends of the spectrum as shown in the image below:
We are interested in conserving cycles during ranging markets, and longer-term variations during trending markets, we can do this by interpolating between our two filter coefficients:
α × + (1 - α) ×
where 1 > α > 0 . α is measuring if the market is trending or ranging, with values closer to 1 indicating a trending market. We see that for higher values of α the original coefficient of the MACD is used. The image below shows various magnitude responses given multiple values of α :
We use a rolling R-Squared as α , this measurement has the benefit of indicating if the market is trending or ranging, as well as being constrained within range (0, 1), and having a U-shaped distribution.
If you are interested to learn more about the MACD see:
🔶 SETTINGS
R2 Period: Calculation window of the R-Squared.
Fast: Fast period for the calculation of the Adaptive MACD, lower values will return more noisy results.
Slow: Slow period for the calculation of the Adaptive MACD, higher values will return result with longer-term conserved variations.
Signal: Period of the EMA applied to the Adaptive MACD.