XABCD Harmonic Pattern Custom Range Interactive█ OVERVIEW
This indicator was designed based on Harmonic Pattern Book written by Scott Carney. It was simplified to user who may always used tools such as XABCD Pattern and Long Position / Short Position, which consume a lot of time, recommended for both beginner and expert of Harmonic Pattern Traders. XABCD Pattern require tool usage of Magnet tool either Strong Magnet, Week Magnet or none, which cause error or human mistake especially daily practice.
Simplified Guideline by sequence for Harmonic Pattern if using manual tools :
Step 1 : Trade Identification - XABCD Pattern
Step 2 : Trade Execution - Any manual tools of your choice
Step 3 : Trade Management - Position / Short Position
█ INSPIRATION
Inspired by design, code and usage of CAGR. Basic usage of custom range / interactive, pretty much explained here . Credits to TradingView.
I use a lot of XABCD Pattern and Long Position / Short Position, require 5 to 10 minutes on average, upon determine the validity of harmonic pattern.
Upon creating this indicator, I believed that time can be reduced, gain more confidence, reduce error during drawing XABCD, which helps most of harmonic pattern users.
█ FEATURES
Table can positioned by any postion and font size can be resized.
Table can be display through optimized display or manual control.
Validility of harmonic pattern depends on BC ratio.
Harmonic pattern can be displayed fully or optimized while showing BC ratio validity.
Trade Execution at point D can be displayed on / off.
Stop Loss and Take Profit can be calculated automatically or manually.
Optimized table display based extend line setup and profit and loss setup.
Execution zone can be offset to Point C, by default using Point D.
Currency can be show or hide.
Profit and Loss can be displayed on axis once line is extended.
█ HOW TO USE
Step 1 : Trade Identification - Draw points from Point X to Point C. Dont worry about magnet, point will attached depends on High or Low of the candle.
Step 2 : Trade Execution - Check the validity of BC to determine the validity of harmonic pattern generated. Pattern only generate 1 pattern upon success. Otherwise, redraw to other points.
Step 3 : Trade Management - Determine the current candle either reach Point D or Potential Reversal Zone (PRZ). Check for Profit & Loss once reach PRZ.
█ USAGE LIMITATIONS
Harmonic Patterns only limits to patterns mentioned in Harmonic Trading Volume 3 due to other pattern may have other or different philosophy.
Only can be used for Daily timeframe and below due to bar_time is based on minutes by default.
Not recommended for Weekly and Monthly timeframe.
If Point X, A, B, C and D is next to each other, it is recommend to use lower timeframe.
Automated alert is not supported for this release. However, alert can be done manually. Alert will updated on the version.
█ PINE SCRIPT LIMITATIONS
Known bug for when calculate time in array, causing label may not appeared or offset.
Unable to convert to library due to usage of array.get(). I prefer usage for a combination of array.get(id, 0), array.get(id, 1), array.get(id, 2) into custom function, however I faced this issue during make arrays of label. Index can be simply refered as int, for id, i not sure, already try id refered as simple, nothing happens.
linefill.new() will appeared as diamond box if overused.
Text in box.new() unable to use ternary condition or switch to change color. Bgcolor also affected.
Label display is larger than XABCD tool. Hopefully in future, have function to resize label similar to XABCD tools.
█ IMPORTANTS
Trade Management (Profit & Loss) is calculated from Point A to D.
Take Profit is calculated based on ratio 0.382 and 0.618 of Point A to D.
Always check BC validity before proceed to Trade Management.
Length of XABCD is equal to XAB plus BCD, where XAB and BCD are one to one ratio. Length is measured in time.
Use other oscillator to countercheck. Normally use built-in Relative Strength Index (RSI) and Divergence Indicator to determine starting point of Point X and A.
█ HARMONIC PATTERNS SUPPORTED
// Credits to Scott M Carney, author of Harmonic Trading Volume 3: Reaction vs. Reversal
Alt Bat - Page 101
Bat - Page 98
Crab - Page 104
Gartley - Page 92
Butterfly - Page 113
Deep Crab - Page 107
Shark - Page 119 - 220
█ FAQ
Pattern such as 5-0, perfect XABCD and ABCD that not included, will updated on either next version or new release.
Point D time is for approximation only, not including holidays and extended session.
Basic explaination for Harmonic Trading System (Trade Identification, Trade Execution and Trade Management).
Harmonic Patterns values is pretty much summarized here including Stop Loss.
Basic explanation for Alt Bat, Bat, Crab, Gartley, Deep Crab and Butterfly.
█ USAGE / TIPS EXAMPLES (Description explained in each image)
指標和策略

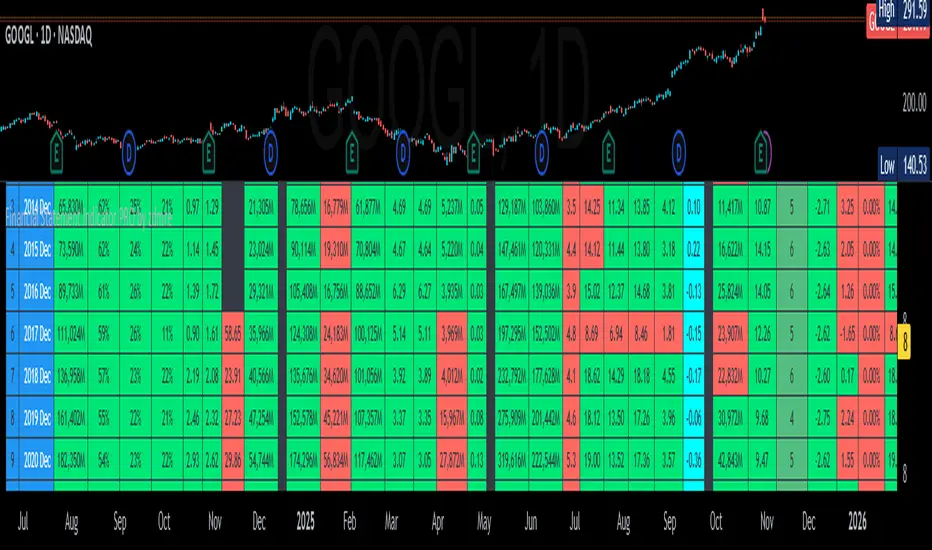
Financial Statement Indicator by zdmreKnowing how to work with the datas in a company's financial statements is an essential skill for stock investors. The meaningful interpretation and analysis of balance sheets, income statements, and cash flow statements to discern a company's investment qualities is the basis for smart investment choices.
You can access to the financials tables of the companies as a summary with this indicator.
3 Tables;
Income Statement Table:
Revenue
Net Profit
EPS
EPS-D
P/E
Balance Sheet Table:
Current Asset
Total Asset
Total Equity
Book Value per Share
Total Debt
Debt/Equity
Statistics & Cash Flow Table:
Return On Equity
Return On Asset
Return On Invested Capital
Quick Ratio
Free Cash Flow
PSv5 Color Magic and Chart Theme SimulatorKEEP YOUR COINS FOLKS! I DON'T NEED THEM, DON'T WANT THEM. Many other talented authors on TV deserve them.
INTRODUCTION:
This is my "PSv5 Color Magic and Chart Theme Simulator" displayed using Pine Script version 5.0. The purpose of this PSv5 colorcator is to show vivid colors that are most suitable in my opinion for modifying or developing Pine scripts. Whether you are new to Pine or an experienced Pine poet, this should aid you in developing indicators with stunning color from the provided color list that is easily copied and pasted into any novel script you should possess. Whichever colors you choose, and how, is up to your imagination's capacity.
COMMENTARY:
I have a thesis. Pine essentially is a gigantor calculator with a lot of programmable bells and whistles to perform intense analytics. Zillions of numbers per day are blended up into another cornucopia of numbers to analyze. The thing is, ALL of those numbers are moot unless we can informatively portray them in various colorized forms with unique methods to point out significant numeric events. By graphically displaying them with specific modes of operation, only then do these numbers truly make any sense to us and become quantitatively beneficial.
I have to admit... I hate numbers. I never really liked them, even before I knew what an ema() was. Some days I almost can't stand them, and on occasion I feel they deserve to be flushed down the toilet at times. However, I'm a stickler for a proper gauge of measurements. Numbers are a mental burden, but they do have "purpose and meaning". That's where COLOR comes in! By applying color in specific ways in varying dynamic forms, we can generate smarter visual aids from these numerics. Numbers can be "transformed" into something colorful it wasn't before, into a tool, like a hammer. But we don't need a hammer, we need an impressive jack hammer for BIG problem solving that we could never achieve in the not to distant past.
As time goes on, we analytically measure more, and more, and more each year. It's necessary to our continual evolution. That's one significant difference between us and cave men, and the pertinent reason why we are quickly evolving as a species, while animals haven't. Humankind is gifted to enumerate very well AND blessed to see in color. We use it for innumerable things in the technological present for purpose and pleasure. Day in and day out, we take color for granted, because it's every where we can look. The fact is, color is the most important apparatus in humankind's existence EVER. We wouldn't have survived this far without it.
By utilizing color to it's grand potential, greater advancements can be attained while simultaneously being enjoyed visually. Once color is transformed from it's numeric origins into applicable tools, we can enjoy the style, elegance, and QUALITATIVE nature of the indication that can be forged. Quantities can't reveal all. Color on the other hand has a handy "quality" factor to it, often revealing things we can't ordinarily recognize. When high quality tools provide us with obtained goals, that's when we will realize how magical color truly is, always has been, and shall always be.
The future emerging economies and future financial vessels of people around the globe are going to be dependent on the secured construction of intelligent applications with a rock solid color foundation, not just math alone. I have no doubt about that. I can envision that with my eyes closed. To make an informed choice, it should be charted or graphed somehow prior to a final executive decision to trade. Going back to abysmal black and white with double decimal points placed next to cartoons within extinction doomed newspapers is not a viable option any more.
OBSERVATIONS AND UTILITY:
One thing you will notice is the code is very dense. Looks almost hideous right? Well, the variable naming is lengthy, but it's purpose is to be self explanatory, even for those who don't know how to program, YET. I'm simply not a notation enthusiast. My main intention was to provide clearly identifiable variables from their origin of assignment to their intended destination of use, clearly visible for anyone visiting. The empowerment of well versed words that are easier to understand, is a close rival to the prominent influence color has.
Secondly, I'm displaying hline() and label.new() as prime candidates to exemplify by demonstration how the "Power of Color" can be embraced with the "Power of Pine". Color in Pine has been extensively upgraded to serve novel purposes to accomplish next generation indicators that do and WILL come to exist. New functions included with PSv5 are color.rgb(), color.from_gradient(), color.r(), color.g(), color.b(), and color.t() to accompany color.new() in our mutual TV adventures. Keep in mind, the extreme agility of color also extends to line.new(), the "entirely new" linefill.new(), table.new(), bgcolor() and every other function that may utilize color.
There's a wide range of adjustability in Settings to make selections to see how they perform on different backgrounds, with their size and form. As you curiously toy with those, you're going to notice how some jump out like laser beams while others don't. Things that aren't visually appealing, still have very viable purposes, even if they don't stand out in the crowd. Often, that's preferable. The important thing is that when pertinent information relative to indication is crucial, you can program it with distinction from an assortment of a potential 1.67 million colors that can be created in Pine. "These" are my chosen favorite few, and I hope you adopt them.
PURPOSES:
For those of you who are new to Pine Script, this also may help you understand color hex/rgb and how it is utilized in Pine in a most effective manner. The most skilled of programmers can garner perks as well. There is countless examples of code diversity present here that are applicable in other scripts with adequate mutation. Any member has the freedom use any of this code in this script any way they see fit. It's specifically intended for all. There is absolutely no need for accreditation for any of this code reuse ever, in the present case. Don't worry about, I'm not.
The color_tostring() will be most valuable in troubleshooting color when using color.rgb() and becoming adept with it. I'm not going to be able to use color.rgb() without it. Chameleon indicators of the polychromatic variety are most likely going to be fine tuned with color_tostring() divulging it's results to label.new() or even table.new() maybe. One the best virtues of this script in chart, is when you hover over the generated labels, there's a hidden gift for those who truly wish to learn the intricate mechanics of diverse color in Pine. Settings has informative tooltips too.
AFTERTHOUGHTS:
Colors are most vibrant on the "Black Chart" which is the default, but it doesn't currently exist as a chart theme. With the extreme luminous intensity of LCDs in millicandela( mcd ), you may notice "Light" charts may saturate the colors making charts challenging to analyze. Because of this, I personally use "Dark Charts" and design my indicators specifically for these. I hope this provides inspiration for the future developers who are contemplating the creation of next generation indicators and how color may enhance their usefulness.
When available time provides itself, I will consider your inquiries, thoughts, and concepts presented below in the comments section, should you have any questions or comments regarding this indicator. When my indicators achieve more prevalent use by TV members , I may implement more ideas when they present themselves as worthy additions. Have a profitable future everyone!

Probability ConesA probability cone is an indicator that forecasts a statistical distribution from a set point in time into the future.
Features
Forecast a Standard or Laplace distribution.
Change the how many bars the cones will lookback and sample in their calculations.
Set how many bars to forecast the cones.
Let the cones follow price from a set number of bars back.
Anchor the cones and they will not update from their last location.
Show or hide any set of cones.
Change the deviation used of any cone's upper or lower line.
Change any line's color, style, or width.
Change or toggle the fill colors between any two cone lines.
Basic Interpretations
First, there is an assumption that the distribution starting from the cone's origin, based on the number of historical bars sampled, is likely to represent the distribution of future price.
Price typically hangs around the mean.
About 68% of price stays within the first deviation cones.
About 95% of price stays within the second deviation cones.
About 99.7% of price stays within the third deviation cones.
When price is between the first and second deviation cones, there is a higher probability for a reversal.
However, strong momentum while above or below the first deviation can indicate a trend where price maintains itself past the first deviation. For this reason it's recommended to use a momentum indicator alongside the cones.
There is no mean reversion assumption when price deviates. Price can continue to stay deviated.
It's recommended that the cones are placed at the beginning of calendar periods. Like the month, week, or day.
Be mindful when using the cones on various timeframes. As the lookback setting, which selects the number of bars back to load from the cone's origin, will load the number of bars back based on the current timeframe.
Second Deviation Strategy
How to react when price goes beyond the second deviation is contingent on your trading position.
If you are holding a losing trade and price has moved past the second deviation, it could be time to stop trading and exit.
If you are holding a winning trade and price has moved past the second deviation, it would be best to look at exit strategies to capitalize on the outperformance.
If price has moved beyond the second deviation and you hold no position, then do not open any new trades.

Synthetic Price Action GeneratorNOTICE:
First thing you need to know, it "DOES NOT" reflect the price of the ticker you will load it on. THIS IS NOT AN INDICATOR FOR TRADING! It's a developer tool solely generating random values that look exactly like the fractals we observe every single day. This script's generated candles are as fake as the never ending garbage news cycles we are often force fed and expected to believe by using carefully scripted narratives peddled as hypnotic truth to psychologically and emotionally influence you to the point of control by coercion and subjugation. I wanted to make the script's synthetic nature very clear using that analogy, it's dynamically artificial. Do not accidentally become disillusioned by this scripts values, make trading decisions from it, and lastly don't become victim to predatory media magic ministry parrots with pretty, handsome smiles, compelling you to board their ferris wheel of fear. Now, on to the good stuff...
BACKSTORY:
Occasionally I find myself in situations where I have to build analyzers in Pine to actually build novel quantitative analytic indicators and tools worthy of future use. These analyzers certainly don't exist on this platform, but usually are required to engineer and tweak algorithms of the highest quality with the finest computational caliber. I have numerous other synthesizers to publish besides this one.
For many reasons, I needed a synthetic environment to utilize the analyzers I built in Pine, to even pursue building some exotic indicators and algorithms. Pine doesn't allow sourcing of tuples. Not to mention, I required numerous Pine advancements to make long held dreams into tangible realities. Many Pine upgrades have arrived and MANY, MANY more are in need of implementation for all. Now that I have this, intending to use it in the future often when in need, you can now use it too. I do anticipate some skilled Pine poets will employ this intended handy utility to design and/or improved indicators for trading.
ORIGIN:
This was inspired by the brilliance from the world renowned ALGOmist John F. Ehlers, but it's taken on a completely alien form from its original DNA. Browsing on the internet for something else, I came across an article with a small code snippet, and I remembered an old wish of mine. I have long known that by flipping back and forth on specific tickers and timeframes in my Watchlist is not the most efficient way to evaluate indicators in multiple theatres of price action. I realized, I always wanted to possess and use this sort of tool, so... I put it into Pine form, but now have decided to inject it with Pine Script steroids. The outcome is highly mutable candle formations in a reusable mutagenic package, observable above and masquerading as genuine looking price candles.
OVERVIEW:
I guess you could call it a price action synthesizer, but I entitled it "Synthetic Price Action Generator" for those who may be searching for such a thing. You may find this more useful on the All or 5Y charts initially to witness indication from beginning (barstate.isfirst === barindex==0) to end (last_bar_index), but you may also use keyboard shortcuts + + to view the earliest plottable bars on any timeframe. I often use that keyboard shortcut to qualify an indicator through the entirety of it's runtime.
A lot can go wrong unexpectedly with indicator initialization, and you will never know it if you don't inspect it. Many recursively endowed Infinite Impulse Response (IIR) Filters can initialize with unintended results that minutely ring in slightly erroneous fashion for the entire runtime, beginning to end, causing deviations from "what should of been..." values with false signals. Looking closely at spg(), you will recognize that 3 EMAs are employed to manage and maintain randomness of CLOSE, HIGH, and LOW. In fact, any indicator's barindex==0 initialization can be inspected with the keyboard shortcuts above. If you see anything obviously strange in an authors indicator, please contact the developer if possible and respectfully notify them.
PURPOSE:
The primary intended application of this script, is to offer developers from advanced to even novice skill levels assistance with building next generation indicators. Mostly, it's purpose is for testing and troubleshooting indicators AND evaluating how they perform in a "manageable" randomized environment. Some times indicators flake out on rare but problematic price fluctuations, and this may help you with finding your issues/errata sooner than later. While the candles upon initial loading look pristine, by tweaking it to the minval/maxval parameters limits OR beyond with a few code modifications, you can generate unusual volatility, for instance... huge wicks. Limits of minval= and maxval= of are by default set to a comfort zone of operation. Massive wicks or candle bodies will undoubtedly affect your indication and often render them useless on tickers that exhibit that behavior, like WGMCF intraday currently.
Copy/paste boundaries are provided for relevant insertion into another script. Paste placement should happen at the very top of a script. Note that by overwriting the close, open, high, etc... values, your compiler will give you generous warnings of "variable shadowing" in abundance, but this is an expected part of applying it to your novel script, no worries. plotcandle() can be copied over too and enabled/disabled in Settings->Style. Always remember to fully remove this scripts' code and those assignments properly before actual trading use of your script occurs, AND specifically when publishing. The entirety of this provided code should never, never exist in a published indicator.
OTHER INTENTIONS:
Even though these are 100% synthetic generated price points, you will notice ALL of the fractal pseudo-patterns that commonly exist in the markets, are naturally occurring with this generator too. You can also swiftly immerse yourself in pattern recognition exercises with increased efficiency in real time by clicking any SPAG Setting in focus and then using the up/down arrow keys. I hope I explained potential uses adequately...
On a personal note, the existence of fractal symmetry often makes me wonder, do we truly live in a totality chaotic universe or is it ordered mathematically for some outcomes to a certain extent. I think both. My observations, it's a pre-deterministic reality completely influenced by infinitesimal amounts of sentient free will with unimaginable existing and emerging quantities. Some how an unknown mysterious mechanism governing the totality of universal physics and mathematics counts this 100.0% flawlessly and perpetually. Anyways, you can't change the past that long existed before your birth or even yesterday, but you can choose to dream, create, and forge the future into your desires and hopes. As always, shite always happens when your not looking for it. What you choose to do after stepping in it unintentionally... is totally up to you. :) Maybe this tool and tips provided will aid you in not stepping in an algo cachucha up to your ankles somehow.
SCRIPTING LESSONS PORTRAYED IN THIS SCRIPT:
Pine etiquette and code cleanliness
Overwrite capabilities of built-in Pine variables for testing indicators
Various techniques to organize Settings panel while providing ease of adjustment utility
Use of tooltip= to provide users adequate valuable information. Most people want to trade with indicators, not blindly make adjustments to them without any knowledge of their intended operation/effects
When available time provides itself, I will consider your inquiries, thoughts, and concepts presented below in the comments section, should you have any questions or comments regarding this indicator. When my indicators achieve more prevalent use by TV members , I may implement more ideas when they present themselves as worthy additions. Have a profitable future everyone!

Manual Harmonic Patterns - With interactive inputsThis script is a drawing tool which allows users to draw XABCD on the chart and script will tell whether there is any harmonic patterns on the drawings made. The script is based on interactive inputs and requires users to chose XABCD points.
Please note
This is not a scanner and it will not scan historical bars for harmonic patterns. This needs to be used rather as drawing tool instead.
Script will not check if selected pivots are correct. It assumes users to know how to select the right XABCD based on pivot high/lows. Bullish pattern will have X, B and D as pivot lows and A,C as pivot highs. Similarly bearish patterns will have X, B, D as pivot highs and A, C as pivot lows.
Script will not check for overflow conditions. For example, if price crosses, XB or BD line, then pattern is considered to be invalid. But, this check cannot be made in this script and we require users to be aware of this condition and select input accordingly.
Order of inputs should be in ascending order. X pivot should come before A and then, B, C, D and F. This again is users responsibility to select pivots in right order.
What happens after selecting XABCD?
If selected pattern is valid harmonic pattern, it will
Draw XABCD lines and labels
Fill harmonic triangles
Show PRZ box which shoes the name of valid patterns.
If it is not valid harmonic pattern, then users will see blank XABCD line without any PRZ or filled harmonic triangles.
Example:
1. When it is valid pattern
2. When it is not valid pattern

Median Convergence DivergenceIntroduction
The Median Convergence Divergence (MCD) is a derivative of the Moving Average Convergence Divergence (MACD). The difference is the change in the use of the measure of central tendency. In MACD, moving average (mean) is used, whereas, in MCD, the median is used instead. The purpose of using the median is to eliminate the outlying values, which would be calculated for a moving average. The outliers would affect the value of the moving average.
For example: 3, 5, 7, 8, 5, 4, 2, 1, 6, 21, 8. The data set average is 6.3, whereas the median value is 5. There is a difference of about 23% in the example. The reason is the outlying value '21' in the data set.
As the markets are volatile, outlying values can always emerge. A moving average will consider those values; on the other hand, the median will ignore. If the strategy calls for a tool to ignore the outliers, the Median Convergence Divergence would be a great centered oscillator.
The default values have changed to suit the current trading days in a week. When the MACD was introduced, there would be six trading days in a week. Therefore, it used 12 (2 weeks), 26(4 weeks), and 9 ( 1.5 weeks). But now that there are five trading days per week. The default values are adapted to them. Feel free to change them as per your wish.
Recommended Settings
The current settings are set to be used for the Daily Time Frame: 5 day period for the fast line, a 20 day period for the slow line, and a 10 day period for the signal line. (5 days represent a trading week, 10 days is two weeks, and 20 days is 4 weeks or a month)
For the weekly charts, use 4 week period for the fast line, 13 week period for the slow line, and 8 week period for the signal line. (4 weeks represent a month, 8 weeks is two months, and 13 weeks is 3 months or quarterly)
And for monthly charts, use 3 month period for the fast line, 12 month period for the slow line, and 6 month period for the signal line. (3 months is quarterly, 6 months is bi-yearly, and 12 month is yearly)
It'll be challenging to measure for intraday since there are many different timeframes within intraday. The settings mentioned above should also be customized as per the requirements of the trading strategy.
Strategy
The strategy application is the same as the MACD, i.e., Signal Line Crossovers, Zero Line Crossovers, and Divergence.
Signal Line Crossovers: When the MCD line crosses above the Signal line, it's a bullish crossover. When the MCD line crosses below the Signal line, it's a bearish crossover.
Zero Line Crossovers: It's a bullish crossover when the MCD line crosses above the Zero line. When the MCD line crosses below the Zero Line, it's a bearish crossover.
Divergence: When price shows a lower low, but MCD shows a higher low, it's a bullish divergence. When the price shows a higher high but MCD shows a lower high, it's a bearish divergence.
Using other indicators in conjunction with the Median Convergence Divergence is recommended to take entry and exit signals.

Head & Shoulders S/R RegularThis is my take in Head & Shoulders (regular H&S)
The script will wait until a valid point E is found, which means A, C and E are alined
Then it will find the highest point between C - E -> Head (= D),
together with the highest point between A - C -> Left Shoulder (= B)
After this, the pattern is drawn, together with a 'trigger' area (E-G - E'-G' ~ 'Right shoulder area')
ONLY in this field, when a close is higher than E'-G', the figure will turn green, if lower than E-G, it will turn red, else, it will be blue
Settings:
Date range filtering
Here you can filter the patterns by setting the date period (for E)
Pivot Points -> Leftbars - Rightbars
min/max retrace AD -> E
Set the retracement for E (retracement A -> D -> E, here between 1.4 & 1.5)
% tolerance
Tolerance of Right shoulder height against Left shoulder height
0% (= the same relative height):
85% (-> now close isn't higher than E'-G' -> blue coloured):
min/max %
Sets the desired B height against D (here B is between 35-45% of D):
width R shoulder = L shoulder + x%
Sets the width of Right shoulder against Left shoulder
0% (nothing extra, just the same width as Left shoulder)
100% (Right shoulder area is double as large as the Left shoulder):
-70% (Right shoulder area much narrower than Left shoulder):
maximum visible patterns:
Set the maximum visible amount of patterns
This script uses one of the latest fantastic Pinescript features:
linefill and for ... in loop
Cheers!

+ Klinger OscillatorThis is a version of Stephen J. Klinger's, Klinger Oscillator (sometimes called Klinger Volume Oscillator). I've changed virtually nothing about the indicator itself, but added some lookback inputs for the EMAs the oscillator is derived from (traditionally 34 and 55), and added a few other things, as is my wont.
But what is the Klinger Oscillator? Essentially, the calculation looks at the high, low, and close of the current period, and compares that to the previous period's. If it is greater, it adds volume, and if it is less, it subtracts volume. It then takes an EMA of two different lookback periods of that calculation and subtracts one from the other. That's your oscillator. There is then made a signal line of the oscillator that a trader can use, in combination with the zero line, for taking trades. Investopedia has a good article on it, so if you're looking for more specifics, check there.
What I've done is add a selection of different moving averages that you may choose for the signal line. Usually it's a 13 period EMA, and that comes default, but here you could use an ALMA or HMA, or modular filter, etc. Find something that works for your style/algorithm.
Of course there are all the usual additions of mine with the various ways of coloring the indicator and candles, adjustable Donchian Bands, and alerts. A new addition that I've just added to all my indicators (oscillators, anyway) are divergences. This is more or less just a copy and paste of the divergence indicator available in TradingView. In this case you can set it to plot divergences off either the Klinger or the signal line. Depending on which one you choose you may have to adjust pivot lookbacks, and lookback range. I've kept the settings default from the RSI TradingView version.

Average LinesAverage Lines
This script beholds several new exiting Pine stuff:
- linefill, fill of line.new
- last_bar_index, gives the bar_index of the last bar, already at the beginning of the script! (like 'timenow', but now with bar_index)
The script is about pivot points, if there is one, it draws a line from the last to every previous one, then it extends this line to the future. On every next bar, all these lines and added and averaged, this gives an average line of all extended lines which are projected in the 'future'.
In that way, we create a new kind of moving average
Do mind, since the visible lines maximum of 500 it can easily happen that an average is made of way more lines than 500, but that you cannot see all of them
Cheers!

Volume-based Support & Resistance ZonesThe new and improved Support & Resistance Zones indicator is here. This indicator is based on high volume at fractal lows or fractal highs with the zones based on the size of the wick for that timeframe’s candle.
This helps traders visualize which price levels are of the most significance for either reversals or continuation of the trend when zones are broken and then re-tested.
Original script is thanks to synapticex and additional modifications is thanks to Lij_MC. Credit to both of them for most of the logic behind this script.
Since then I have made many changes to this script as noted below:
Changed default S/R lines from plots to lines, and gave option to user to change between solid line, dashed line, or dotted line for both S/R lines.
Added additional time frame and gave more TF options for TF1 other than current TF. Now you will have 4 time frames to plot S/R zones from.
Gave user option to easily change line thickness for all S/R lines.
Made it easier to change colors of S/R lines and zones by consolidating the options under settings (rather than under style).
Added extensions to active SR Zones to extend all the way right.
Added option to extend or not extend the previous S/R zones up to next S/R zone.
Added optional time frame labels to active S/R zones, with left and right options as well as option to adjust how far to the right label is set.
Fixed issue where the higher time frame S/R zone was not properly starting from the high/low of fractal. Now any higher time frame S/R will begin exactly at the High/Low points. Note that this may not work perfectly on stocks and if a fractal high/low is too many bars in the past, it will revert to a default max bars back to avoid script errors.
Added to script a function that will prevent S/R zones from lower time frames displaying while on a higher time frame. This helps clean up the chart quite a bit.
Created arrays for each time frame's boxes and lines so that the number of S/R zones can be controlled for each time frame and limit memory consumption.
New alert options added and customized alert messages.
- The way this indicator works is it looks for fractal highs or fractal lows with volume that pierces above the volume's Moving Average. This moving average value can be modified in the settings for each time frame.
- The fractal highs will be confirmed with 3 successive higher highs followed by 2 successive lower highs and vice versa for the fractal lows.
- The zone is created from the fractal high/low and the close of the candle for whatever time frame you selected. The bigger the zone, the more significant that zone is.
- You can disable any zone, change the zones to show lines only, and modify all the colors, transparencies, and thickness of lines for all the zones.
- To create alerts, you first want to enable the types of alerts you want for each time frame in the indicator's settings. Then after you apply changes, right click on one of the zones on the chart, and click "Add Alert on Vol S/R Zones". You do not need to add a title as the correct alert messages are already built-in.
- More changes will be coming in the future!
I hope you find this indicator useful, if so please give it a thumbs up!
If you have any suggestions or features you would like to see, just let me know in the comment section. Thanks and enjoy!

Diluted Earnings Per Share Signal [AstrideUnicorn]Earnings Per Share (EPS) is a financial metric closely monitored by investors. The so-called "positive earnings surprise" - a situation when EPS reading for a stock beats the value forecasted by analysts gives a bullish signal for this stock. The EPS reading lower than the analysts' estimate gives a bearish signal.
The Diluted Earnings Per Share (Diluted EPS) metric calculates a company's potential earnings per share value in the case if all convertible securities get converted to common shares. Convertible securities include preferred shares, stock options, warrants, convertible debt, etc. Diluted EPS is a more scientific way to estimate earnings per share, and it is usually lower than the ordinary EPS.
The Diluted EPS Signal indicator (DEPSS) is a fundamental indicator that calculates trading signals by comparing the Diluted EPS to the EPS Estimate. In many cases, Diluted EPS gives better insight into how a reported EPS reading may impact the stock price.
HOW TO USE
For each earnings date, the indicator calculates the Diluted Earnings Surprise percentage value :
Diluted Earnings Surprise = (Diluted EPS - EPS Estimate)/ EPS Estimate.
Diluted Earnings Surprise higher than the specified threshold value is a bullish signal. In this case, the indicator displays a green triangle pointing up.
Diluted Earnings Surprise lower than the specified threshold value is a bearish signal displayed as a red triangle pointing down.
As one can see on the chart, there are a lot of situations where EPS readings with green labels (the ones that beat analysts' estimates) lead to down moves. The DEPSS indicator can spot weak earnings and give opposite signals.
SETTINGS
Earnings Surprise Threshold (%) : the threshold value (in percentage units) for the Diluted Earnings Surprise. The calculated Diluted Earnings Surprise must be higher than Earnings Surprise Threshold to be considered a BUY signal or lower than minus Earnings Surprise Threshold to be considered a SELL signal. The default value for Earnings Surprise Threshold is 20%.

Supertrend - Ladder ATRThis is a supertrend with slight twisted concept which can be very benefecial in strong trending markets to reduce stop loss distance and exit slightly quicker.
⬜ Concept
▶ When the instrument is trending up, regular ATR shows high values if there are big green candles. This affect the stoploss distance in regular supertrend which leads to wide stops or delayed lagging. When you are in long trade, what matters for stoploss is how much a negative candle can move within bar. Hence, using ATR derived only based on red candles is more beneficial for trailing stops on long signals. Same applies to short trades where using ATR derived from only green candles is more efficient than overall ATR.
▶ ATR will be minimal when the volatility is less and ATR will increase with volatility. That means, once you are in trade, the trailing of stoploss also will vary based on ATR (or volatility). With regular ATR and supertrend, chances of stop loss distance widening is high with increased volatility even though stoploss levels will not move down. This again poses the risk of higher drawdown during trade closure and also keeps in the trade during ranging market. To avoid this, the second trick we are using here is only to reduce the atr stoploss difference when in trade. That is, when in long trade and negative candles ATR is increasing, we will not consider that. We will consider the new ATR only if it is lesser than previous bar ATR.
Effect of these changes on the trending market is quite visual. Lets take example of USDTRY
Settings are quite simple and does not vary much from regular supertrend settings.

RedK Auto-Stepping Ladder TraderThe RedK Auto-Stepping Ladder Trader is an experimental tool to help identify trade entry and exits for various types of trades (Trend / Momentum / Breakout and Swing trades)
The underlying concept here is loosely similar to the SMAC script - in case you'd like to read some of the "script-specific" write-up . I even borrowed some of the SMAC code, but upgraded the script to Pine v5 while working. So i won't repeat write-up here on how the script works - and we'll get right into how to use in trading
How to use / trade the Ladder Trader:
-------------------------------------------------
The idea is to set the auto-stepping ladder to a higher timeframe, the "ladder view" helps simplify the price action to show a clear direction, then use the lower timeframe to find best entries (close or at the ladder line) and exits (on the ATR as TP target)
- Entries should be as close to the ladder line as possible - a trader may decide to have a small margin above or below the ladder line where they set entry limit order
- note that when stepping is enabled, the auto-stepping algo will choose the step value based on the underlying price range and the selected timeframe to move with common trader "mental values" where traders will usually gravitate
- exits can be set using the optional ATR or Pct channels - by default, there's an ATR channel (golden color) for that purpose
Possible usage scenarios of the Ladder Trader:
--------------------------------------------------------------
- Trend / long(er) term: enter position once the ladder line switches to the color corresponding to my desired direction (example: blue for long), and hold all the way until the color changes
- Swing: Take only trades in the direction of the ladder (long with blue, short with orange) - enter at the ladder line value, set TP at the desired ATR, repeat as long as the direction holds
- Feel free to experiment and share back other uses you find. There are so many settings and tweaks provided for flexibility - the downside is this adds a certain level of complexity - however, i hope this will be a valuable tool to add to your trading.
Few Notes:
-----------------------
- The Auto-stepping algo is a bit improved to be more FOREX and Crypto-friendly - i do not trade these instruments myself, but will continue to improve the auto-stepping technique in upcoming updates
- the signal line (hidden by default, and is what causes the ladder to change color) is based on my Compound Ratio Moving Average - since it's the moving average i found to provide best combination of speed and smoothness. It is used as a proxy to the price, to signal when the price is above or below the ladder level - while removing some of the whipsaws if we use the price value directly.
- Broader analysis of price action should still be made using other indicators - and possibly other chart setups - we shouldn't rely on the Ladder Trader signal only - Check for overall momentum, volume movement and market sentiment before using the Ladder Trader
- Also test your settings in PaperMoney - i noticed that different instruments may need different settings (for Ladder Type, Length, Rounding Technique, ATR multiplier..etc) for optimal setup that shows best signals.. Get very familiar with the Ladder Trader and it should hopefully become more helpful to you as a tradiing tool.
Comments and Feedback are welcome. Good luck.

Bjorgum Key Levels
Key Levels Aims to capture 3 of the most significant points in price action
Breakouts
False Breakouts (Traps)
Back Checks
These 3 points alone, if properly identified, can be some of the most significant points of movement in the price history of an asset and bring significant gains to traders, if capitalized on. Here are a few examples of these setups
Breakouts
Breakouts can bring significant rallies as the market swings one sided after key levels are breached. This entry type can bring large trending runs to follow. Momentum is on your side, but the trade off is a higher entry.
False Breakouts
Also known as a bull trap or a bear trap, false breaks can lead to swift and significant reversals and potential for a large and sudden move to the opposite side. When a key level breakout fails to hold, parties entering to capitalize on the "epic breakout" can get left holding the bag forcing them to exit at a loss, which can double the force of pressure. Traps can bring swift gains from good entry prices. However, price is still in a larger trend against you so momentum is weak, so price action is susceptible to roll over.
Backchecks
Back checks are pull backs in trend that find middle ground to the 2 areas already described. Both momentum and entry price are decent, but risk is defined as a key level has flipped offering entry with stops below demand, or above supply.
Combining these 3 methods helps to diversify risk, understand trend development, and bring steady gains. This script helps to identify these points to traders with analysis of key levels, price structure, and trend direction, while providing visual signals and alerts for when they occur.
Best of luck in your coding and trading and thank you for your support

TASC 2021.12 Directional Movement w/Hann█ OVERVIEW
Presented here is code for the "Directional Movement w/Hann" indicator originally conceived by John Ehlers. The code is also published in the December 2021 issue of Trader's Tips by Technical Analysis of Stocks & Commodities (TASC) magazine.
Ehlers continues here his exploration of the application of Hann windowing to conventional trading indicators.
█ FEATURES
The rolling length can be modified in the script's inputs, as well as the width of the line.
█ NOTES
Calculations
The calculation starts with the classic definition of PlusDM and MinusDM. These directional movements are summed in an exponential moving average (EMA). Then, this EMA is further smoothed in a finite impulse response (FIR) filter using Hann window coefficients over the calculation period.
Background
The DMI and ADX indicators were designed by J. Welles Wilder and presented in his "New Concepts in Technical Trading Systems" book published in 1978.
Join TradingView!

RKs Notepad++ Pine Script V5█ OVERVIEW
After reading all the new names and renames that Pine Script V5 brought to us, I knew that my old Notepad++ User Defined Language (UDL) would need a big update, so I decided to do a complete remake using the same Dark color scheme theme of the Pine Editor.
Then, I create a Notepad++ Theme and the Auto-Completion file with the Parameter hints for every built-in function to make everything look nicer
█ IMPORTANT
This is not an indicator!!
These are 3 XML files to copy and paste inside the Notepad++ folder.
You can use any Notepad Software to create the XML files.
The main Notepad++ folder is normally on %AppData%\Notepad++\
To avoid mistakes, always make a Backup of your files before anything.
█ INSTALLATION
Just follow these steps:
1. open a New Document File;
2. Copy everything between ↓↓↓ and ↑↑↑ symbols to this new document;
3. Remove the "//" of every single line;
4. Save each document with the correct name in the right folder;
5. Restart the Notepad++
█ NOTES:
If you have some problem installing, ask me, and I will try to help you.
But, in any case, here is the link to these files on my GitHub:

Higher Time Frame Chart OverlayHello All,
This script gets OHLC values from any security and Higher/Same time frame you set, then creates the chart including last 10 candles. it shows Symbol name, Time Frame, Highest/Lowest level of last 10 candles and Close Price at the right side of the chart as well. Closing price text color changes by the real-time candle of the related symbol and time frame. The all this was made using the Tables in Pine and the chart location doesn't change even if you change the size of main chart window.
Almost everything can be change as you want. You can change/set:
- Colors of Body and Top/Bottom Wicks separately
- The Height of each Cell
- The Width of Body and Wicks
- The Background and Frame color
- Enable/disable Status Panel (if you disable Status Panel then only candle chart is shown)
- Location of Status Panel
- Text color and Text size
- The Background color of Status Panel
Some examples:
The info shown in Status Panel:
You can change The Height of each Cell and The Width of Body and Wicks
You can change colors:
You can change location of the chart:
If you add the script more than once then you can see the charts for different symbols and time frames: (This may slow down your chart)
If you right-click on the script and choose "Visual Order" => "Bring to front" then it will be better visually:
P.S. Using this script may slow down your chart, especially if you add it more than once
Enjoy!

No Duplicates Interval Range & EQGenerates Range & EQ levels and removes duplicates. Prioritizes by higher timeframe for duplicates. For example, on Monday's open, weekly open is displayed while daily open is hidden automatically.

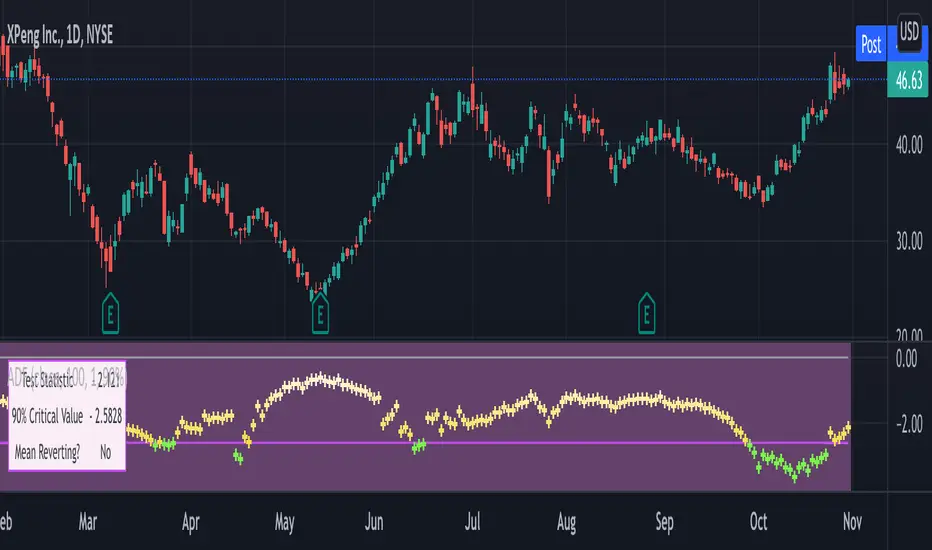
Augmented Dickey–Fuller (ADF) mean reversion testThe augmented Dickey-Fuller test (ADF) is a statistical test for the tendency of a price series sample to mean revert .
The current price of a mean-reverting series may tell us something about the next move (as opposed, for example, to a geometric Brownian motion). Thus, the ADF test allows us to spot market inefficiencies and potentially exploit this information in a trading strategy.
Mathematically, the mean reversion property means that the price change in the next time period is proportional to the difference between the average price and the current price. The purpose of the ADF test is to check if this proportionality constant is zero. Accordingly, the ADF test statistic is defined as the estimated proportionality constant divided by the corresponding standard error.
In this script, the ADF test is applied in a rolling window with a user-defined lookback length. The calculated values of the ADF test statistic are plotted as a time series. The more negative the test statistic, the stronger the rejection of the hypothesis that there is no mean reversion. If the calculated test statistic is less than the critical value calculated at a certain confidence level (90%, 95%, or 99%), then the hypothesis of a mean reversion is accepted (strictly speaking, the opposite hypothesis is rejected).
Input parameters:
Source - The source of the time series being tested.
Length - The number of points in the rolling lookback window. The larger sample length makes the ADF test results more reliable.
Maximum lag - The maximum lag included in the test, that defines the order of an autoregressive process being implied in the model. Generally, a non-zero lag allows taking into account the serial correlation of price changes. When dealing with price data, a good starting point is lag 0 or lag 1.
Confidence level - The probability level at which the critical value of the ADF test statistic is calculated. If the test statistic is below the critical value, it is concluded that the sample of the price series is mean-reverting. Confidence level is calculated based on MacKinnon (2010) .
Show Infobox - If True, the results calculated for the last price bar are displayed in a table on the left.
More formal background:
Formally, the ADF test is a test for a unit root in an autoregressive process. The model implemented in this script involves a non-zero constant and zero time trend. The zero lag corresponds to the simple case of the AR(1) process, while higher order autoregressive processes AR(p) can be approached by setting the maximum lag of p. The null hypothesis is that there is a unit root, with the alternative that there is no unit root. The presence of unit roots in an autoregressive time series is characteristic for a non-stationary process. Thus, if there is no unit root, the time series sample can be concluded to be stationary, i.e., manifesting the mean-reverting property.
A few more comments:
It should be noted that the ADF test tells us only about the properties of the price series now and in the past. It does not directly say whether the mean-reverting behavior will retain in the future.
The ADF test results don't directly reveal the direction of the next price move. It only tells wether or not a mean-reverting trading strategy can be potentially applicable at the given moment of time.
The ADF test is related to another statistical test, the Hurst exponent. The latter is available on TradingView as implemented by balipour , QuantNomad and DonovanWall .
The ADF test statistics is a negative number. However, it can take positive values, which usually corresponds to trending markets (even though there is no statistical test for this case).
Rigorously, the hypothesis about the mean reversion is accepted at a given confidence level when the value of the test statistic is below the critical value. However, for practical trading applications, the values which are low enough - but still a bit higher than the critical one - can be still used in making decisions.
Examples:
The VIX volatility index is known to exhibit mean reversion properties (volatility spikes tend to fade out quickly). Accordingly, the statistics of the ADF test tend to stay below the critical value of 90% for long time periods.
The opposite case is presented by BTCUSD. During the same time range, the bitcoin price showed strong momentum - the moves away from the mean did not follow by the counter-move immediately, even vice versa. This is reflected by the ADF test statistic that consistently stayed above the critical value (and even above 0). Thus, using a mean reversion strategy would likely lead to losses.
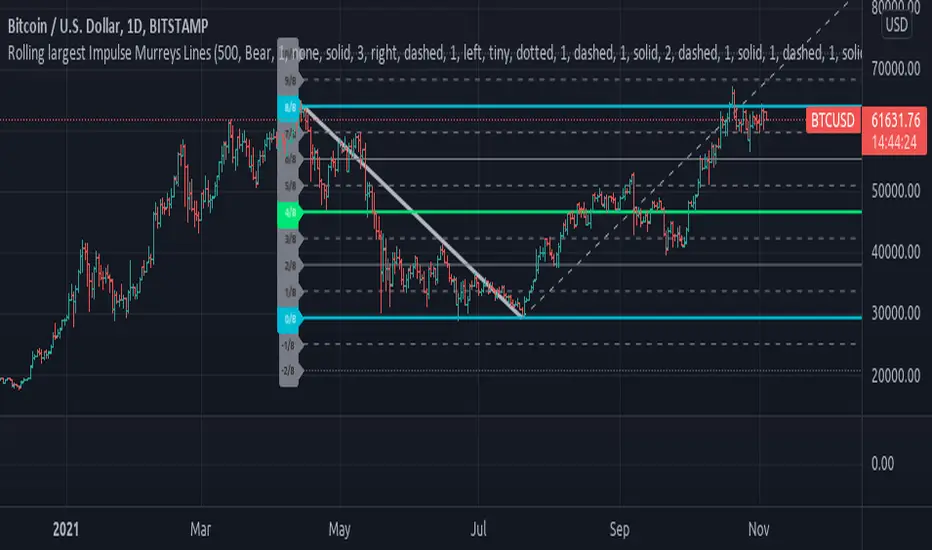
Rolling largest Impulse Murreys LinesExperimental:
Uses Kadane's max subarray sum algorithm to find the largest impulse within a window and draws Murrey's math lines based on that impulse.
All-Time High/Low WidgetIt's a pretty simple widget to track all-time high and all-time low values.
You can plot the levels and display some stats when all-time happened and how far away are we at this moment.
Also, you can create alerts to get notified on ATH/ATL breakout.
Thanks to @Verleiht for helping me with the code.
Disclaimer
Please remember that past performance may not be indicative of future results.
Due to various factors, including changing market conditions, the strategy may no longer perform as well as in historical backtesting.
This post and the script don’t provide any financial advice.

Indicators OverlayHello All,
This script shows the indicators in separate windows on the main chart. Included indicators are RSI, CCI, OBV, Stochastic, Money Flow Index, Average True Range and Chande Momentum Oscillator. indicator windows are located at the top or bottom of the chart according to last moves of the Closing price. Different colors are used for each indicator. Horizontal levels are shown as dashed line and label as well.
Using the options;
You can enable/disable the indicators you want to see or not
You can change source and length for each indicator
You can set window length. using this length indicator windows are located on the chart
After you added this indicator to your chart I recommend: right click on any of the indicator windows => "Visual Order" => "Bring to front" as seen screenshot below:
in this example only 3 indicators enabled and period is set as 80:
indicator windows moves to the top or bottom of the chart according to the close price:
P.S. if you want to see any other indicator in the options then leave a comment under the indicator ;)
Enjoy!
