Midnight ET + Daily H/L True dayThis script divides each day from midnight EST to the next midnight opening price (True day). Full credits go to my mentor ICT for the idea behind the script
Educational
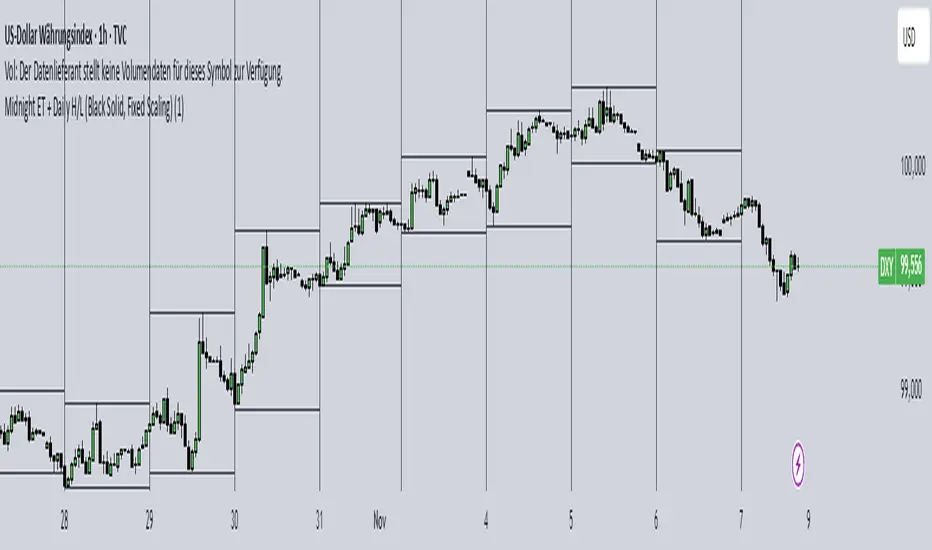
Midnight ET + Daily H/L (vertical midnight + HL lines)This script provides midnight EST dividers for each day and marks each daily high and low during each True day. Credits go to my mentor ICT for the idea behind this script.

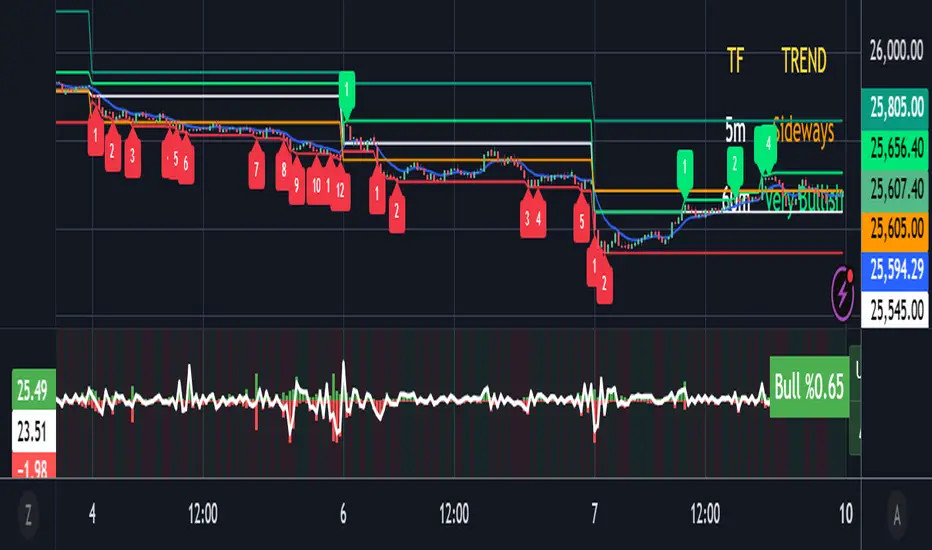
Price Action IndicatorThis indicator is based on Price Action
Trend bar would be filled with Red/Green
Reversal bar would be tagged

📋 Trading Checklist – Precision Entry SystemTake your trading discipline to the next level with this Precision Trading Checklist for TradingView. Designed for intraday traders following liquidity, structure, and Smart Money Concepts (SMC) AKA ICT Concepts, this overlay ensures you never miss a key confirmation before entering a trade.
Features:
✅ Pre-Market Preparation: Track previous session highs/lows, AM/PM sessions, and key liquidity zones.
✅ Bias & Narrative Check: Quickly confirm daily trend, price position relative to daily open, and higher timeframe confluence.
✅ Session-Specific Rules: Focused sessions like Silver Bullet (10:00–11:30), Afternoon (13:30–15:00), and Final Hour (15:00–16:00).
✅ Structure & Setup Validation: Confirm liquidity sweeps, market structure shifts, expansion candles, fair value gaps, and order blocks.
✅ Risk Management Reminders: Stop-loss, target points, risk percentage, breakeven management, and pyramiding rules.
✅ Post-Trade Journaling: Document entries, session, setup type, trade outcome, and grading for continuous improvement.
✅ Golden Rules: Visual reminders to enforce discipline, avoid emotional trades, and respect session limits.
Why Use It:
This checklist is perfect for traders who want to stay consistent, minimise mistakes, and follow a disciplined routine. Displayed as an overlay on your chart, it provides all essential checks in one glance, keeping you focused on the setup rather than scrolling through notes or separate trackers.
How to use:
Add the indicator to your chart
Click the settings/gear icon
Check off items as you complete them
The checklist on your chart updates in real-time with green checkmarks!
The checkboxes will persist as long as the indicator is on your chart,
making it perfect for tracking your pre-trade and post-trade routines!
Follow the checklist items step by step before entering trades.
Use the session-specific guidelines to filter setups.
Journal your trades post-execution for growth and analysis.

Trend (5m & 1h) by Ben2010🧭 What it does:
✅ Checks 5 min and 1 hour timeframes (you can change them).
✅ Evaluates:
RSI: momentum
MACD: direction
VWAP: price vs fair value
Volume: buyers vs sellers
Price structure: Higher High or Lower Low
✅ Combines all into a qualitative strength label (Very Bullish → Very Bearish).
✅ Displays everything in a neat table at the top-right corner.
Trendy Bands + Reversal SignalsTrendy Bands + Reversal Signals
This is a versatile and powerful TradingView indicator that combines a dual Bollinger Bands system with momentum-based reversal signals. It's designed to help traders identify the prevailing trend, potential volatility expansions/contractions, and key reversal points in the market.
Core Concept: The indicator uses two sets of Bollinger Bands with different standard deviation settings to create a "band within a band" structure. This visual setup makes it easier to gauge trend strength and spot potential breakouts or breakdowns. Additionally, it calculates a custom momentum oscillator to generate early warnings for potential trend reversals.

EMAs 4/8/15 + Classic Pivots (clean v5)Here is a clean code for people to use, hope it works well for you. 4/8/15 are key indicators. You first got to be on the right side or upside of the 15 and then you need to see a detachment from the 4/8. You will see that is when upward movement happens. for shorting, you need to be below the 4/8 and usually on the under of 15.

Rotating Messages (Rules or Motivational)This lightweight utility indicator allows you to display rotating custom text messages directly on your TradingView chart — perfect for reminders, trading rules, motivational quotes, or session notes.
You can define multiple messages separated by semicolons (;) or new lines, and the indicator will automatically cycle through them based on time or bar count. Ideal for traders who want visual cues without cluttering the chart.
⚙️ Main Features
⏱ Time-based or bar-based rotation — switch messages every X seconds (real-time) or X bars (historical/backtest mode).
📍 Flexible positioning — choose between Top Right, Bottom Right, or Bottom Center.
📏 Vertical offset — move text up or down for perfect placement on your chart.
🎨 Custom styling — set text color, background color, border visibility, and text size.
✍️ Simple message input — enter your rules or quotes in a text box with support for multi-line messages.

fpmanananaThis is a description of the indicator. It is a really good one that I think is really good.

Quantura - Session High/LowIntroduction
“Quantura – Session High/Low” is a professional-grade session mapping indicator that automatically identifies and visualizes the highs, lows, and ranges of key global trading sessions — London, New York, and Asia. It helps traders understand when and where liquidity tends to accumulate, allowing for better market structure analysis and session-based strategy alignment.
Originality & Value
This indicator unifies the three most influential global sessions into a single, adaptive visualization tool. Unlike typical session indicators, it dynamically updates live session highs and lows in real time while marking session boundaries and transitions. Its multi-session management system allows for immediate recognition of overlapping liquidity zones — a crucial feature for institutional and intraday traders.
The value and originality come from:
Real-time tracking of session highs, lows, and developing ranges.
Simultaneous visualization of multiple global sessions.
Optional vertical range lines for clearer visual segmentation.
Customizable session times, colors, and time zone offset for global accuracy.
Automatically extending and updating lines as each session progresses.
Functionality & Core Logic
Detects the start and end of each trading session (London, New York, Asia) using built-in time logic and user-defined UTC offsets.
Initializes session-specific high and low variables at the start of each new session.
Continuously updates session high/low levels as new candles form.
Draws color-coded horizontal lines for each session’s high and low.
Optionally adds vertical dotted lines to visually connect session range extremes.
Locks each session’s range once it ends, preserving historical structure for review.
Parameters & Customization
New York Session: Enable/disable, customize time (default 15:30–21:30), and set color.
London Session: Enable/disable, customize time (default 09:00–16:30), and set color.
Asia Session: Enable/disable, customize time (default 02:30–08:00), and set color.
Vertical Line: Toggle dotted vertical lines connecting session high and low levels.
UTC Offset: Adjust session timing to align with your chart’s local time zone.
Visualization & Display
Each session is color-coded for quick identification (default: blue for London, red for New York, green for Asia).
Horizontal lines track evolving session highs and lows in real time.
Once a session closes, the lines remain fixed to mark historical range boundaries.
Vertical dotted lines (optional) visually connect the session’s high and low for clarity.
Supports full overlay display without interfering with other technical indicators.
Use Cases
Identify liquidity zones and range extremes formed during active trading sessions.
Observe session overlaps (London–New York) to anticipate volatility spikes.
Combine with volume or market structure tools for session-based confluence.
Track how price interacts with prior session highs/lows to detect potential reversals.
Analyze session-specific performance patterns for algorithmic or discretionary systems.
Limitations & Recommendations
The indicator is designed for intraday analysis and may not provide meaningful output on daily or higher timeframes.
Adjust session times and UTC offset based on your broker’s or exchange’s timezone.
Does not provide trading signals — it visualizes session structure only.
Combine with liquidity and volatility indicators for full contextual understanding.
Markets & Timeframes
Compatible with all asset classes — including crypto, forex, indices, and commodities — and optimized for intraday timeframes (1m–4h). Particularly useful for traders analyzing session overlaps and volatility transitions.
Author & Access
Developed 100% by Quantura. Published as a Open-source script indicator. Access is free.
Compliance Note
This description fully complies with TradingView’s Script Publishing Rules and House Rules . It provides a detailed explanation of functionality, parameters, and realistic use cases without making any performance or predictive claims.

Inside Day FinderWhat is an Inside Day?
An inside day happens when:
Today’s high is lower than yesterday’s high, and
Today’s low is higher than yesterday’s low.
So, today’s candle is inside the previous day’s range — showing consolidation or indecision in the market.

Trading ScorecardChecklist, note, scorecard, custom table. I originally created the table for currency strength analysis, but it can be used as a checklist. You can also create your own scoring system. The number of columns and rows can be changed. The color and size of the table are customizable.

Full Floating Dashboard YUJiDisplay information on top right corner.
Info shown:
High and Low
Current Price
24 Hour Change

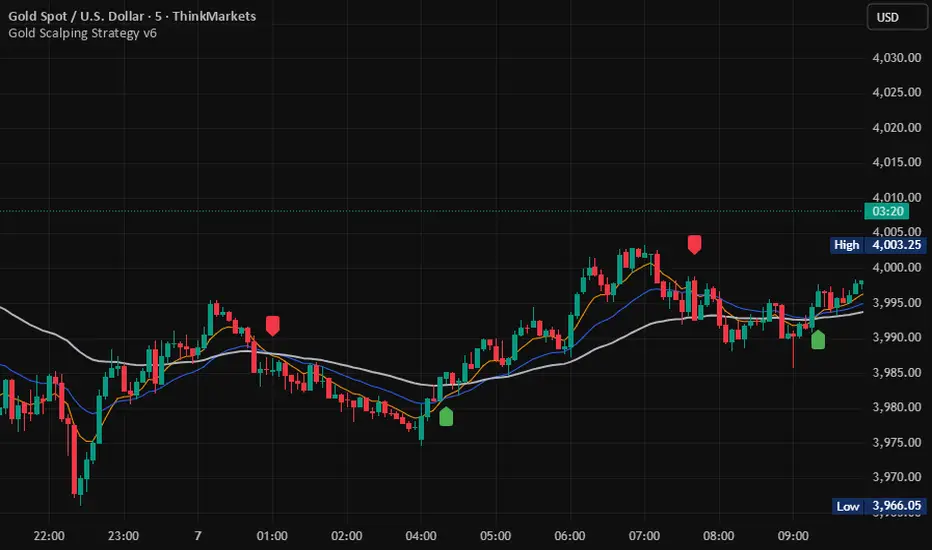
SSL Hybrid ScalperIt's a ready to trade script V5, that takes the original SSL Hybrid logic and optimizes it for XAUUSD scalping on 1min to 15min charts for buy & sell signals.
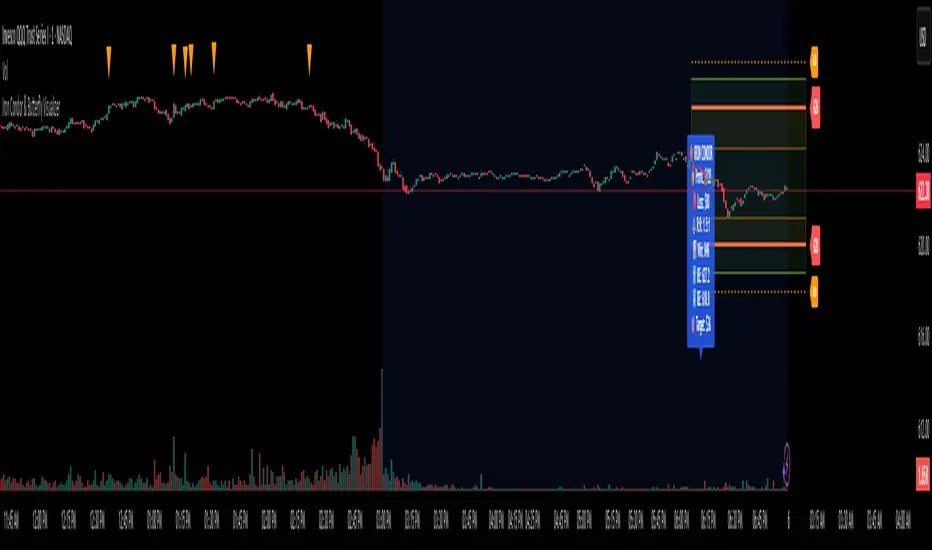
Iron Condor & Butterfly VisualizerIt helps you visualize and manage your option spread by:
Plotting strike prices and breakeven lines directly on the chart.
Showing profit/loss zones, adjustment zones, and alerts when price nears critical levels.
Calculating risk/reward, probability of profit, theta decay, IV condition, and trade score.
🎯 2. Inputs & Configuration
You input your trade details as a comma-separated string:
For an Iron Condor
ShortCall, LongCall, ShortPut, LongPut, Credit, Contracts, Target%
Example: 626,628,620,618,1.20,1,30
For a Butterfly Spread
LowerWing, Body, UpperWing, Debit, Contracts, Target%
Example: 600,620,640,2.50,2,50
The indicator automatically parses this and knows which strategy type you selected.
You can also control:
Visuals (profit zones, breakevens, labels)
Risk (stop loss %, adjustment zones)
Account/risk sizing
Market conditions (IV Rank, current IV, DTE)
⚙️ 3. Data Parsing & Strategy Recognition
The code reads your pasted string, splits it by commas, and determines:
Which strikes are short vs long (or wings/body for Butterfly)
Whether the strategy is credit (Iron Condor) or debit (Butterfly)
Calculates net credit/debit, contract size, and profit target
📈 4. Profit/Loss Calculations
It dynamically calculates:
Max Profit
Iron Condor: net credit × 100 × contracts
Butterfly: (wing width − debit) × 100 × contracts
Max Loss
Iron Condor: difference between strikes minus credit
Butterfly: debit × 100 × contracts
Breakeven points
Iron Condor: short strikes ± net credit
Butterfly: body ± debit
Current P&L relative to the live price (close).
⚖️ 5. Risk & Position Sizing
It checks:
Stop-loss trigger (% of max loss)
Adjustment alert if price nears short strikes
Recommended contract size based on account size and % risk per trade
Actual % of account at risk
⏱️ 6. Time Decay & IV Analysis
If you input days to expiration, it shows:
Theta (approx daily time decay)
Decay progress bar (% of 30-day cycle)
IV condition:
Green: favorable (>50 IV Rank)
Yellow: neutral (30–50)
Red: poor (<30)
🧮 7. Trade Scoring
It gives a Trade Score (0–100) based on:
IV Rank (favorable market)
Risk/Reward ratio
Probability of profit
Default 20 baseline points
This helps gauge whether the setup is statistically attractive.
🧠 8. Visualizations
When the indicator runs, it draws on your chart:
Lines
Red = short strikes
Orange dashed = long strikes
Yellow dotted = breakeven levels
Boxes
Green = profit zone
Orange shaded = adjustment zones (approaching danger)
Labels (optional)
Strike labels (call/put prices)
Info box summarizing:
Profit, loss, risk/reward
Breakevens, theta, target, gamma risk flag
🚨 9. Alerts
The script triggers TradingView alerts when:
Price nears call or put adjustment zones
Profit target is hit
Stop loss is hit
These help you manage the trade without constant monitoring.
🧭 10. In Practice
You’d:
Copy the option strikes and trade details from your broker or analyzer.
Paste them into 📋 PASTE YOUR TRADE DATA HERE.
The indicator plots:
Profit/loss region
Adjustment warnings
Key metrics
Alerts if your trade is in danger or near target.
Risk & Position DashboardRisk & Position Dashboard
Overview
The Risk & Position Dashboard is a comprehensive trading tool designed to help traders calculate optimal position sizes, manage risk, and visualize potential profit/loss scenarios before entering trades. This indicator provides real-time calculations for position sizing based on account size, risk percentage, and stop-loss levels, while displaying multiple take-profit targets with customizable risk-reward ratios.
Key Features
Position Sizing & Risk Management:
Automatic position size calculation based on account size and risk percentage
Support for leveraged trading with maximum leverage limits
Fractional shares support for brokers that allow partial share trading
Real-time fee calculation including entry, stop-loss, and take-profit fees
Break-even price calculation including trading fees
Multi-Target Profit Management:
Support for up to 3 take-profit levels with individual portion allocations
Customizable risk-reward ratios for each take-profit target
Visual profit/loss zones displayed as colored boxes on the chart
Individual profit calculations for each take-profit level
Visual Dashboard:
Clean, customizable table display showing all key metrics
Configurable label positioning and styling options
Real-time tracking of whether stop-loss or take-profit levels have been reached
Color-coded visual zones for easy identification of risk and reward areas
Advanced Configuration:
Comprehensive input validation and error handling
Support for different chart timeframes and symbols
Customizable colors, fonts, and display options
Hide/show individual data fields for personalized dashboard views
How to Use
Set Account Parameters: Configure your account size, maximum risk percentage per trade, and trading fees in the "Account Settings" section.
Define Trade Setup: Use the "Entry" time picker to select your entry point on the chart, then input your entry price and stop-loss level.
Configure Take Profits: Set your desired risk-reward ratios and portion allocations for each take-profit level. The script supports 1-3 take-profit targets.
Analyze Results: The dashboard will automatically calculate and display position size, number of shares, potential profits/losses, fees, and break-even levels.
Visual Confirmation: Colored boxes on the chart show profit zones (green) and loss zones (red), with lines extending to current price levels.
Reset Entry and SL:
You can easily reset the entry and stop-loss by clicking the "Reset points..." button from the script's "More" menu.
This is useful if you want to quickly clear your current trade setup and start fresh without manually adjusting the points on the chart.
Calculations
The script performs sophisticated calculations including:
Position size based on risk amount and price difference between entry and stop-loss
Leverage requirements and position amount calculations
Fee-adjusted risk-reward ratios for realistic profit expectations
Break-even price including all trading costs
Individual profit calculations for partial position closures
Detailed Take-Profit Calculation Formula:
The take-profit prices are calculated using the following mathematical formula:
// Core variables:
// risk_amount = account_size * (risk_percentage / 100)
// total_risk_per_share = |entry_price - sl_price| + (entry_price * fee%) + (sl_price * fee%)
// shares = risk_amount / total_risk_per_share
// direction_factor = 1 for long positions, -1 for short positions
// Take-profit calculation:
net_win = total_risk_per_share * shares * RR_ratio
tp_price = (net_win + (direction_factor * entry_price * shares) + (entry_price * fee% * shares)) / (direction_factor * shares - fee% * shares)
Step-by-step example for a long position (based on screenshot):
Account Size: 2,000 USDT, Risk: 2% = 40 USDT
Entry: 102,062.9 USDT, Stop Loss: 102,178.4 USDT, Fee: 0.06%
Risk per share: |102,062.9 - 102,178.4| + (102,062.9 × 0.0006) + (102,178.4 × 0.0006) = 115.5 + 61.24 + 61.31 = 238.05 USDT
Shares: 40 ÷ 238.05 = 0.168 shares (rounded to 0.17 in display)
Position Size: 0.17 × 102,062.9 = 17,350.69 USDT
Position Amount (with 9x leverage): 17,350.69 ÷ 9 = 1,927.85 USDT
For 2:1 RR: Net win = 238.05 × 0.17 × 2 = 80.94 USDT
TP1 price = (80.94 + (1 × 102,062.9 × 0.17) + (102,062.9 × 0.0006 × 0.17)) ÷ (1 × 0.17 - 0.0006 × 0.17) = 101,464.7 USDT
For 3:1 RR: TP2 price = 101,226.7 USDT (following same formula with RR=3)
This ensures that after accounting for all fees, the actual risk-reward ratio matches the specified target ratio.
Risk Management Features
Maximum Trade Amount: Optional setting to limit position size regardless of account size
Leverage Limits: Built-in maximum leverage protection
Fee Integration: All calculations include realistic trading fees for accurate expectations
Validation: Automatic checking that take-profit portions sum to 100%
Historical Tracking: Visual indication when stop-loss or take-profit levels are reached (within last 5000 bars)
Understanding Max Trade Amount - Multiple Simultaneous Trades:
The "Max Trade Amount" feature is designed for traders who want to open multiple positions simultaneously while maintaining proper risk management. Here's how it works:
Key Concept:
- Risk percentage (2%) always applies to your full Account Size
- Max Trade Amount limits the capital allocated per individual trade
- This allows multiple trades with full risk on each trade
Example from Screenshot:
Account Size: 2,000 USDT
Max Trade Amount: 500 USDT
Risk per Trade: 2% × 2,000 = 40 USDT per trade
Stop Loss Distance: 0.11% from entry
Result: Position Size = 17,350.69 USDT with 35x leverage
Total Risk (including fees): 40.46 USDT
Multiple Trades Strategy:
With this setup, you can open:
Trade 1: 40 USDT risk, 495.73 USDT position amount (35x leverage)
Trade 2: 40 USDT risk, 495.73 USDT position amount (35x leverage)
Trade 3: 40 USDT risk, 495.73 USDT position amount (35x leverage)
Trade 4: 40 USDT risk, 495.73 USDT position amount (35x leverage)
Total Portfolio Exposure:
- 4 simultaneous trades = 4 × 495.73 = 1,982.92 USDT position amount
- Total risk exposure = 4 × 40 = 160 USDT (8% of account)

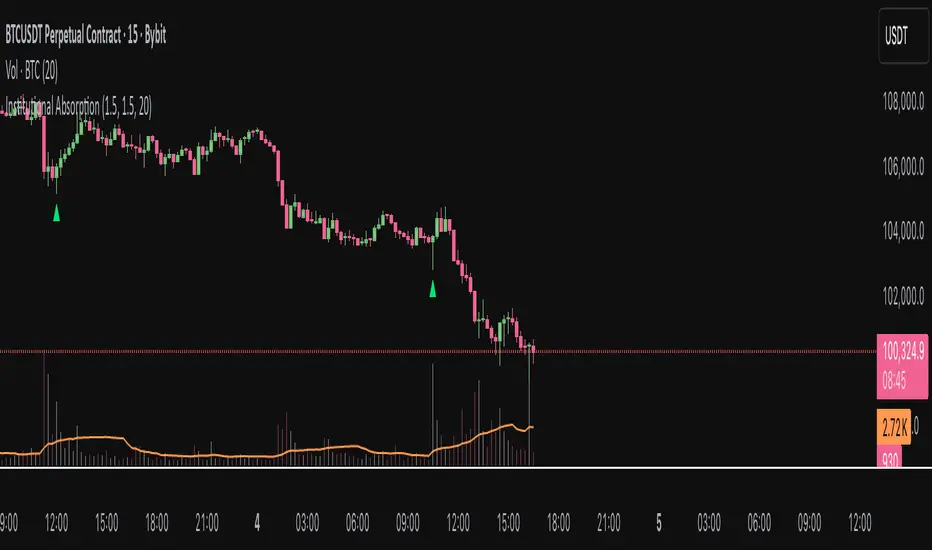
Institutional AbsorptionHighlights potential zones where institutional participants may be absorbing aggressive buying or selling pressure.
It analyzes candle structure and volume to detect possible bullish and bearish absorption events, providing a visual cue for traders studying market imbalance and liquidity dynamics.
The script compares each candle’s wick–body ratio and volume relative to its moving average.
A bullish absorption setup occurs when strong volume appears after a sharp downward move with long lower wicks, while bearish absorption occurs after upward moves with long upper wicks, suggesting the presence of large counter-orders.
+ Features
Detects bullish and bearish absorption candles.
Customizable wick to body ratio and volume multiple thresholds.
Optional filter to require candle color alignment with trend (green/red).
Option to ignore tiny body (doji-like) candles.
+ How to Use
Adjust wick–body ratio, volume multiplier, and lookback length under “Conditions (Absorption)”.
Enable “Require candle color” to strengthen directional context.
Use alerts to receive notifications when new absorption signals appear.
+ Notes
This tool aims to visualize possible absorption behavior, not confirm institutional activity.
Combine it with your broader market structure, volume, or order flow analysis for a more comprehensive analysis.
Quantum Leap by GSK-Vizag-AP-IndiaQuantum Leap by GSK-Vizag-AP-India
This indicator detects strong impulse price movements, also known as "quantum leaps," in bullish and bearish directions. Using the Average True Range (ATR) to measure market volatility, it identifies candles with body sizes significantly larger than recent average ranges, suggesting strong momentum surges.
The script groups consecutive impulse candles into blocks, highlighting zones of sustained bullish or bearish strength on the chart. These visual blocks aid traders in quickly spotting powerful price moves that may indicate key market shifts or reversals. Additionally, this tool can be effectively used to identify Fair Value Gaps (FVG) in price action, making FVG detection easier and more intuitive for users.
Inputs allow customization for ATR length, impulse strength threshold, and minimum consecutive candles, enabling adaptation to different markets or timeframes.
Important Disclaimer:
This indicator is for educational and informational purposes only. It is not financial advice and does not guarantee future results. Users should conduct their own research and seek professional guidance before making any trading decisions. Trading involves risk, including the potential loss of capital.
MACD Overlay v1 [JopAlgo]Meet the MACD you can trade directly from the chart.
MACD Overlay v1 doesn’t just plot an oscillator somewhere below—
it puts value, momentum, and participation on your candles, and it refuses to fire inside chop.
When a triangle prints, it’s because energy released (expansion), not because the chart looked cute.
What it is:
An execution-ready MACD overlay with phase gating (Expansion-Only), participation gating (Weakness-Lite), and one-click Classic vs VW-MACD Compare—all adaptive, with minimal inputs.
What’s in v1 (feature set)
Overlay ribbon on price: Fast/Slow MACD value rendered as a price-level ribbon with contextual fill and optional candle tint.
Dual value model: Classic MA-MACD (EMA/SMA) and VW-MACD (Rolling VWAP fast/slow).
Compare mode: A/B Classic vs VW-MACD with a VW ghost ribbon.
Weakness-Lite (1-bar, adaptive): Gates/fades low-participation crosses using
RVOL deficit, Effort-vs-Result failure, and over-extension vs value/ATR (Strict adds wick pressure).
Expansion-Only (Impulse/Squeeze): Triangles print only when a cross coincides with a true-range burst and a histogram-slope ignition out of compression.
Signal hygiene: ±1-bar proximity around crosses, slope awareness, 2-bar debounce.
Explainable filtering: Tiny gray dots show crosses that were intentionally filtered (weak and/or no expansion).
How to use:
Use defaults: Mode Classic, Gate by Weakness ON, Expansion-Only ON, Sensitivity Auto.
Read signals fast:
Solid triangle = cross + expansion confirmed (+ not weak if gate is ON).
Faded triangle = cross + expansion but weak participation (visible only when gate is OFF).
Gray dot = there was a cross, but it was filtered (no genuine expansion or weak & gated).
Validate quickly: Flip Compare to check VW-MACD agreement. Classic + VW alignment usually improves confidence.
Why overlay > sub-pane oscillator
You see where the cross occurs: relative to value, local structure, and S/R, right on price.
The ribbon exposes regime shifts; tint hints expansion vs contraction at a glance.
Execution becomes more context-aware and less “signal-in-a-vacuum.”
Signals & visuals
Triangles (solid): MACD crossed Signal and market showed expansion out of compression; if Gate by Weakness is ON, triangle prints only with acceptable participation.
Triangles (faded): Same as above but weak (shown only when you turn the gate OFF).
Gray dots: Crosses that were filtered (no expansion and/or Weakness gate).
Ribbon: Fast vs Slow value (Classic or VW, according to Mode). Fill and candle tint reflect expansion/contraction.
Inputs
Calculation Mode: Classic | VW | Compare
VW uses Rolling VWAP fast/slow.
Compare: Classic is primary; VW shows as a ghost ribbon for A/B checks.
Gate triangles by Weakness: ON/OFF
Uses RVOL, Effort-vs-Result, extension vs value/ATR (Strict adds wick-pressure).
Sensitivity: Off / Auto / Strict (default Auto).
Expansion-Only (Impulse/Squeeze): ON/OFF
Requires compression → release: tight ribbon + flat momentum, then TR/ATR burst with hist slope flip / cross proximity.
Display: Ribbon / Candle Tint / Weakness Markers.
Advanced (optional): Evaluate Weakness only near signals, Channel (k × |MACD|), Style Preset.
No numeric thresholds to tune—all filters self-calibrate from rolling stats.
Best practices
4H crypto: Defaults are strong—Auto, Gate ON, Expansion-Only ON.
Clean trends: If you feel you miss some tidy resumptions, briefly toggle Expansion-Only OFF.
Choppy regimes: Set Sensitivity → Strict to cut more noise without adding lag.
Confirmation: Use Compare; Classic + VW alignment typically yields better follow-through.
Alerts
MACD Signal Cross Up/Down — execution-grade (use Once per bar close).
Weakness-Lite Flag — optional context alert to help audit filtered crosses.
Attribution & License
Attribution: Based on the algorithmic concept of TradingView’s built-in MACD (fast MA – slow MA, signal, histogram).
No original TradingView source code is redistributed; overlay rendering, VW-MACD, Weakness-Lite, Expansion-Only, gating visuals, and UX are new work.
License: MPL-2.0. Educational purposes only—not financial advice.

Livelli OI-PNCOI-PNC Levels is a script that displays the open interest (OI) and net short positions (PNC) of a selection of 20 of the most significant stocks in terms of traded value on the Italian market.
PNC are indicated by red dotted lines starting from the close of the last reported change date;
The most significant open interest by number of contracts (Top 10 Calls and Top 10 Puts) are displayed using labels, all on a single line (Strike, CALL, PUT);
A summary table can be activated.
the data is hardcoded using static arrays and must be updated periodically. Data updated of 03/11/2025
########### Italiano ############
Livelli OI-PNC è uno script che permette di visualizzare gli open interest (OI) e le Posizioni Nette Corte (PNC) di una selezione di 20 titoli tra i più significativi per controvalore movimentato del mercato italiano.
Le PNC vengono indicate tramite Linee tratteggiate rosse che partono dal close della data di ultima variazione comunicata;
Sono riportati tramite labels, gli Open Interest più significativi per num.Contratti (Top 10 Call e top 10 Put) tutto su una unica riga per ogni strike (Strike, CALL, PUT);
E' attivabile una Tabella di riepilogo.
Poiché Pine Script non può leggere direttamente file da URL esterni, i dati sono hardcorati tramite array statici e vanno aggiornati periodicamente. Dati aggiornati al 03/11/2025

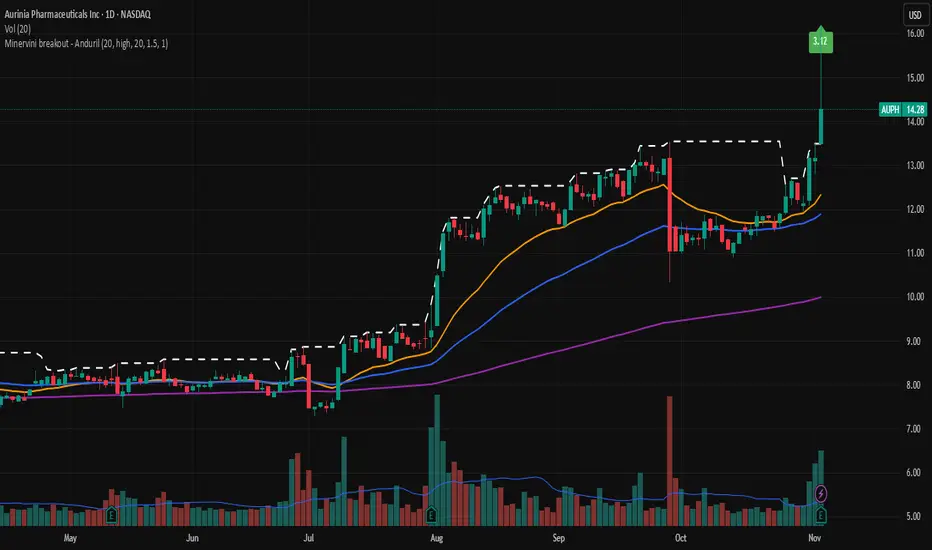
Minervini breakout - AndurilThis indicator checks the Mark Minerivini trend template as well checks consolidation areas and breakout.
Checks the highest closing price of last x days (default 20 days), exluding current day and draws a white dashed line, Calculates the relative volume of the current day. Calculates EMA 21, EMA50 and EMA200 and draws on the graph to define trend.
Gives a buy signal in green (writing relative strength of that day inside of green arrow) if:
1) Current price> breakout price* 0.98
2) Current price > EMA21 >EMA50>EMA200
3) Current price > 52 week high*0.75
4) Current price > 52 week low*1.3
5) EMA 200 of today > EMA 200 of 10 bar ago > EMA 200 of 20 bar ago
6) Relative volume of the day > 1.5
Breakout line - AndurilThis line shows the highest daily closing price of last 20 days default (can be adjusted from the settings). to help you to understand consolidation points and breakouts.

DTC Killzones ICT🕐 DTC Killzones ICT — Visualize Market Sessions Like a Pro
The DTC Killzones ICT indicator is a clean and intuitive tool designed for traders who want to analyze and visualize institutional trading sessions directly on their charts.
Inspired by ICT’s Killzone concept , this script makes it easy to identify overlapping market sessions — such as London, New York, and Asian — and track how price behaves within each zone.
💡 What It Does
This indicator automatically highlights key market sessions (Killzones) on your chart with fully customizable colors, labels, and transparency.
Each zone dynamically updates to reflect real-time highs and lows, helping you identify:
Session ranges and liquidity zones
Volatility windows and breakout areas
Institutional footprints across sessions
Whether you trade Forex, Indices, or Crypto , this script gives you visual clarity on when and where smart money is likely to move.
⚙️ Main Features
✅ Up to four customizable sessions (New York, London, Asian, and London Close)
✅ Adjustable timeframes and timezone options — sync with your exchange or custom UTC offset
✅ Dynamic high/low range tracking for each session
✅ Toggle range outlines, session labels , and transparency levels
✅ Optional daily dividers and session transition markers
✅ Works on any timeframe and any symbol
🧠 How Traders Use It
ICT-based traders can easily mark Killzones to align with setups like FVGs, liquidity grabs, or Silver Bullet entries.
Intraday traders can visualize session volatility and overlap periods for potential entries.
Swing traders can identify daily structure shifts by tracking range-to-range behavior.
🛠️ Customization
You can fully rename, recolor, or disable each session block.
Adjust the range transparency for visual comfort, and toggle session or daily dividers to fit your workflow.
Everything is designed to be clean, light, and modular — no clutter, no confusion.
⚡ Recommended Settings
For ICT-style analysis:
London Session: 02:00–05:00
New York Session: 07:00–10:00
Asian Session: 19:30–24:00
London Close Session: 10:00–12:00
These time windows are fully editable to suit your timezone or strategy.
🧩 Compatibility
Works seamlessly with TradingView’s built-in timezone tools
Compatible with all instruments and timeframes
Designed to overlay directly on your price chart
🏁 Final Notes
The DTC Killzones ICT indicator focuses purely on market session visualization — no alerts, entries, or trading signals.
It’s designed to complement your existing strategies and enhance clarity when analyzing market behavior across global sessions.
📈 Built for traders who value precision, structure, and timing.
