指數移動平均線(EMA)

Piku Pips📌 Piku Pips — Multi-Confluence Smart Signal System (EMA + Supertrend + Volume Profile + ATR Trailing + SR + RSI Climax Engine)
Piku Pips is a complete multi-confluence trading system designed for scalpers, intraday traders, and swing traders who rely on precision entries and institutional-grade confirmation layers.
This indicator combines trend, momentum, volatility, volume imbalance, structure breaks, smart money pivots, and exhaustion events—into a single unified charting system.
It does NOT repaint, supports alerts, and works across all assets (crypto, forex, indices, stocks).
🔥 What Makes This Indicator Special?
Piku Pips is built on stacked confluences instead of single-indicator signals.
Each signal is only printed when multiple conditions align, significantly increasing accuracy and reducing noise.
It includes:
✔ Trend Identification
Fast & Slow EMA cross
SuperTrend with custom ATR & factor
Parabolic SAR for micro-trend confirmation
ATR-based trailing stop engine (dual version for Buy & Sell)
✔ Momentum Confirmation
RSI Midline model
HH/LL structure detection
Bull/Bear volume imbalance model
✔ Smart Volume Analysis
Bullish vs Bearish VWMA volume
Flat-volume filters
RSI + Volume Spike + MFI exhaustion detection (Climax Module)
✔ Institutional Structure Mapping
Dynamic Support & Resistance
Automatic Zone Strength Ranking
Breakout detection with zone coloring
Pivot-based structure scanning
✔ Exhaustion + Divergence Engine (Climax Module)
RSI / Stochastic RSI hybrid
Macro trend smoothing (EMA/RMA/SMA/WMA selectable)
High-precision RSI divergence detection (HH/LH and LL/HL)
Volume spike detection
Buy Climax (potential top)
Sell Climax (potential bottom)
This module acts like a “smart momentum brain” that identifies major reversals.
🎯 Signal Logic (Simplified)
🔹 Buy Signal (Green Triangle)
Triggered when:
Fast EMA crosses above Slow EMA
Higher High structure forms
RSI > midline or crosses above it
Volume profile is bullish
SuperTrend is bullish (direction < 0)
🔹 Sell Signal (Red Triangle)
Triggered when:
Fast EMA crosses below Slow EMA
Lower Low structure forms
RSI < midline or crosses below it
Volume profile is bearish
SuperTrend is bearish (direction > 0)
🔸 Secondary ATR Signals (Orange & Maroon)
Uses Heikin-Ashi ATR trailing stop
Detects micro-shifts in trend momentum
Works excellent in scalping timeframes
🧠 Support & Resistance Engine
The script builds dynamic SR zones based on:
Pivot clustering
Channel width filtering
Strength scoring
Automated sorting and plotting
Zones:
Red tint = Resistance
Green tint = Support
Gray tint = Neutral / In-Play
Alerts trigger on clean SR breaks.
⚡ Climax Module (Exhaustion System)
This system overlays major exhaustion points:
🔻 Buy Climax
High-volume upward exhaustion → potential top.
🔺 Sell Climax
High-volume downward exhaustion → potential bottom.
🔼 RSI Divergences
Bullish divergence labeled "RSI⬆"
Bearish divergence labeled "RSI⬇"
Combined, these give early insight into possible reversals.
🛠 Inputs Overview
📌 Trend Inputs
Fast EMA Length
Slow EMA Length
SuperTrend ATR + Factor
SAR multipliers
Buy/Sell ATR trailing stop parameters
📌 Momentum Inputs
RSI length / midline
Bull/Bear volume variance filter
HH/LL confirmation
📌 Structure Inputs
Pivot sensitivity
Max SR Zones
Loopback length
Zone strength minimum
📌 Climax Module Inputs
RSI / Stochastic lengths
Smoothing method (EMA, SMA, RMA, WMA)
Macro trend slope settings
Pivot sensitivity for divergence
Volume spike multiplier
MFI thresholds
Bull/Bear RSI levels
📈 How to Use Piku Pips
Best Use-Cases:
Scalping (1m–15m)
Intraday (15m–1H)
Swing trading (4H–1D)
Crypto / Forex / Indices / Stocks
Recommended Approach
Trade in direction of EMA + Supertrend + Macro RSI regime.
Enter when Piku Buy/Sell signal aligns with the trend.
Use SR zones as targets or invalidation levels.
Watch Climax signals for tops & bottoms.
Use divergence signals for early reversals.
🔔 Alerts Included
Buy Signal
Sell Signal
ATR Buy / Sell
Buy Climax
Sell Climax
RSI Divergence (bullish & bearish)
All-Signals alert
⚠️ Disclaimer
This indicator is created for educational purposes only and does not constitute financial advice.
Trading involves risk. Do your own research and backtesting before using any tool in live markets.
Timeframe Fast EMA Slow EMA ATR Period Factor RSI Length Overbought/Oversold
5 Min 9 21 10 2 8 80 / 20
15 Min 10 25 10 2.5 10 75/25
1 Hour 20 50 14 3 12 70/30
4 Hour 21 50 14 3 14 70/30
1 Day 20 100 14 3.5 14 70/30
Please use this settings for accurate results

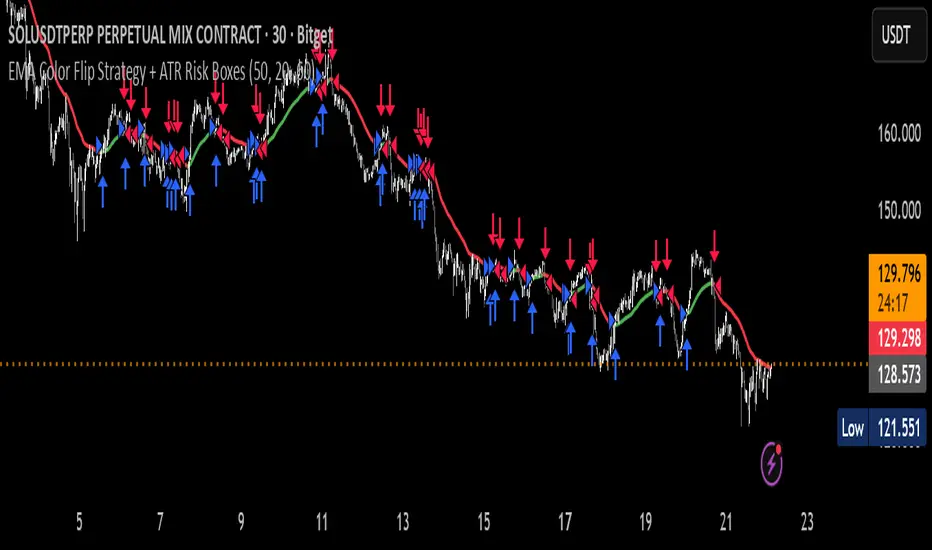
EMA Color Flip Strategy Experimenting on SOL 30 min chart, it seems good!
Let me know what you think!
SMI Color Red/Green📌 TradingView Description – SMI Red/Green Momentum Line
🔥 Stochastics Momentum Index (SMI) – Dynamic Red/Green Version
This indicator is an enhanced and modernized version of the Stochastic Momentum Index (SMI), designed to deliver a more visual, intuitive, and responsive view of trend momentum.
It includes:
✔️ Smoothed SMI
✔️ Dynamic Red/Green momentum coloring
✔️ Signal EMA line
✔️ Overbought/Oversold zones with shading
🎨 Dynamic Red/Green SMI Line
The main SMI line automatically changes color based on momentum direction:
Green → Bullish momentum (SMI rising)
Red → Bearish momentum (SMI falling)
This provides instant visual feedback and highlights early momentum changes even before traditional signal-line crossovers.
📉 Indicator Structure
1️⃣ Smoothed SMI
The SMI is calculated using the price’s position inside its range and then smoothed with an SMA to reduce noise.
2️⃣ EMA Signal Line
A customizable EMA acts as a signal line, providing:
Clear bullish/bearish crossovers
Trend confirmation
Cleaner entry/exit signals
3️⃣ Overbought / Oversold Zones
Extreme levels are highlighted using color-filled zones:
Red Zone (Overbought) → potential bearish reversal
Green Zone (Oversold) → potential bullish reversal
Levels are fully adjustable.
💡 How to Use It
The indicator works exceptionally well across all timeframes.
The most powerful signals are:
✔️ SMI crossing above/below the EMA
SMI crosses above EMA → bullish signal
SMI crosses below EMA → bearish signal
✔️ Leaving Overbought/Oversold zones
SMI exits the oversold zone → potential long setup
SMI exits the overbought zone → potential short setup
✔️ Color shifts (momentum direction)
Red → Green : early bullish momentum
Green → Red : early bearish momentum
Perfect for scalping, day trading, and swing trading.
🚀 Why This Version Is Better
Extremely visual momentum reading
Noise reduction through smoothing
Instantly readable color-coded trend
Strong OB/OS zone visualization
Works on any market and timeframe
Great in combination with RSI, MACD, HMA, ALMA, and trend filters
If you'd like, I can also write:
🔹 a SEO-optimized title,
🔹 recommended TradingView tags,
🔹 or a shorter promotional description.

Hash Momentum IndicatorHash Momentum Indicator
Overview
The Hash Momentum Indicator provides real-time momentum-based trading signals with visual entry/exit markers and automatic risk management levels. This is the indicator version of the popular Hash Momentum Strategy, designed for traders who want signal alerts without backtesting functionality.
Perfect for: Live trading, automation via alerts, multi-indicator setups, and clean chart visualization.
What Makes This Indicator Special
1. Pure Momentum-Based Signals
Captures price acceleration in real-time - not lagging moving average crossovers. Enters when momentum exceeds a dynamic ATR-based threshold, catching moves as they begin accelerating.
2. Automatic Risk Management Visualization
Every signal automatically displays:
Entry level (white dashed line)
Stop loss level (red line)
Take profit target (green line)
Partial TP levels (dotted green lines)
3. Smart Trade Management
Trade Cooldown: Prevents overtrading by enforcing waiting period between signals
EMA Trend Filter: Only trades with the trend (optional)
Session Filters: Trade only during Tokyo/London/New York sessions (optional)
Weekend Toggle: Avoid low-liquidity weekend periods (optional)
4. Clean Visual Design
🟢 Tiny green dot = Long entry signal
🔴 Tiny red dot = Short entry signal
🔵 Blue X = Long exit
🟠 Orange X = Short exit
No cluttered labels or dashboard - just clean signals
5. Professional Alerts Ready
Set up TradingView alerts for:
Long signals
Short signals
Long exits
Short exits
How It Works
Step 1: Calculate Momentum
Momentum = Current Price - Price
Normalized by standard deviation for consistency
Must exceed ATR × Threshold to trigger
Step 2: Confirm Acceleration
Momentum must be increasing (positive momentum change)
Price must be moving in signal direction
Step 3: Apply Filters
EMA Filter: Long only above EMA, short only below EMA (if enabled)
Session Filter: Check if in allowed trading session (if enabled)
Weekend Filter: Block signals on Sat/Sun (if enabled)
Cooldown: Ensure minimum bars passed since last signal
Step 4: Generate Signal
All conditions met = Entry signal fires
Lines automatically drawn for entry, stop, and targets
Step 5: Exit Detection
Opposite momentum detected = Exit signal
Stop loss or take profit hit = Exit signal
Lines removed from chart
⚙️ Settings Guide
Core Strategy
Momentum Length (Default: 13)
Number of bars for momentum calculation. Higher values = stronger signals but fewer trades.
Aggressive: 10
Balanced: 13
Conservative: 18-24
Momentum Threshold (Default: 2.25)
ATR multiplier for signal generation. Higher values = only trade the biggest momentum moves.
Aggressive: 2.0
Balanced: 2.25
Conservative: 2.5-3.0
Risk:Reward Ratio (Default: 2.5)
Your target profit as a multiple of your risk. With 2.2% stop and 2.5 R:R, your target is 5.5% profit.
Conservative: 3.0+ (need 25% win rate to profit)
Balanced: 2.5 (need 29% win rate to profit)
Aggressive: 2.0 (need 33% win rate to profit)

9/15 EMA Scalper 9/15 EMA Scalper — by uzairbaloch
This script is a price-action based scalping system built around the 9 EMA and 15 EMA trend structure.
It identifies short-term reversal points where the market pulls back into the EMAs and confirms direction with a strong candle signal.
The strategy looks for:
• A clear EMA trend (9 above 15 for buys, 9 below 15 for sells)
• Pullback into EMA9/EMA15 with candle bodies touching the fast EMA
• Strong confirmation candle (engulfing / strong momentum / controlled wick)
• Optional slope filter to avoid flat, choppy sessions
• Automatic trade labels showing Entry, SL and TP (based on R:R)
The script is designed for scalping on gold, indices, and high-volatility FX pairs.
It resets trade logic immediately after SL or TP is hit, so it can catch the next valid signal without delay.
This tool is meant as an indicator — not a full strategy — and can be used to visually mark high-probability EMA pullback setups with precise levels.
Author: uzairbaloch

Eagle V 2.0 - AIEagle V 2.0 – AI Edition is a next-generation signal engine designed for traders who want clean entries, consistent performance, and reduced stop-loss hits.
The indicator analyzes trend strength, liquidity behavior, volatility conditions, market structure, and price momentum to generate high-quality buy and sell signals only when the market is aligned.
Instead of flooding the chart with noise, Eagle V 2.0 focuses on precision.
Every signal comes with a calculated stop-loss, three Fibonacci-based take-profit levels, and a confidence score that helps you quickly judge the strength of the setup.
What the Indicator Delivers
Clear Long/Short signals filtered to avoid weak setups
Smart Stop-Loss placement to reduce fake-outs
TP1 / TP2 / TP3 levels automatically calculated based on market movement
AI Confidence Score (0–100) to measure the quality of each opportunity
Real-time Support & Resistance zones that update with market structure
Trend direction and momentum bias across multiple timeframes
Trade history panel showing win rate, total P&L, biggest wins/losses, and your last trades
Dashboard with market conditions, liquidity state, and timeframe bias
Who This Indicator Is For
Scalpers, day traders, and swing traders who want fewer but higher-quality signals, strong risk management, and a tool that adapts to any market—Forex, Crypto, Indices, or Stocks.
Summary
Eagle V 2.0 focuses on the only thing that matters:
Cleaner signals, controlled risk, and stronger results.

Multi-EMA IndicatorIndicator Purpose
The "Multi EMA Indicator" is a clean, customizable script that plots up to four Exponential Moving Averages (EMAs) on the price chart simultaneously. It is designed for traders who want full control over which EMAs are displayed, their periods, colors, and visibility — without cluttering the chart or needing multiple separate EMA indicators.
User-Configurable Options (all adjustable from the indicator’s settings panel):Option
All EMAs are calculated using the close price and are plotted with a linewidth of 2 for clear visibility. Users can instantly show/hide any combination of the four EMAs and change their colors to match any charting style or strategy (e.g., 9/21 crossover, 50/200 golden cross, etc.).

4-Line RibbonRibbon for 20, 50, 100, 200 EMA/ SMA.
2 colour areas for bullish or bearish.
3 shade gradient between the different MA's.

BB Breakout + EMA Touch (50/100)Shows points only when BOTH happen on the same candle:
1️⃣ Price breaks through Bollinger Bands
2️⃣ Price touches (or crosses) EMA 50 or EMA 100


Crypto Schlingel - PVSRA POC EMA Suite v5.903The Chart Indicator Suite combines a wide range of powerful tools that help traders accurately analyze market structures, volatility, and key price zones. With indicators such as POC, pivot points, EMAs, VWAP, Bollinger Bands, and important market levels such as yesterday/weekly high & low, daily open, psy high/low, and ADR, the suite offers a comprehensive overview of trends and market behavior. Supplemented by pvsra candles, long candle detection, and the display of relevant stock market opening hours, it reliably supports traders in making informed trading decisions.
Indicators are configurable
All of the indicators mentioned are fully configurable and can be flexibly adapted to individual trading strategies. Users can freely adjust parameters, display types, and sensitivities to highlight exactly the market information that is relevant to their personal trading style.
The individual fields in the configuration are self-explanatory or are explained in a toolbar, so that the possible settings become clear.
POC
The Point of Control (POC) is a central concept in market profile and volume profile analysis and plays an important role in technical chart analysis. Here is a detailed description of its usefulness and significance:
Definition
The point of control (POC) is the price level at which the most trading volume has taken place within a certain period of time.
It therefore shows the price at which buyers and sellers were most active – the center of market interest.
📊 Use and significance in chart analysis
1. Central support and resistance zone
Since the largest volume was traded at the POC, this price is considered a “fair zone” or equilibrium price.
The market often reacts strongly to the POC:
Above the POC → potential resistance if the price is coming from below.
Below the POC → potential support if the price is falling from above.
Example: If the price returns to the POC, this can be an entry opportunity for traders betting on a market reaction.
2. Interpretation of market acceptance
A price range with high volume (including POC) shows where the market has accepted a fair value.
Low volume, on the other hand, indicates rejection or disinterest.
→ The POC therefore helps to distinguish between accepted price zones and transition areas.
PIVOT POINTS
Pivot points are predefined price levels calculated from the previous day's price data (or a previous time unit).
They help traders identify potential support and resistance zones for the current trading day (or period).
Benefits of pivot points in chart analysis
1. Determining support and resistance areas
The calculated pivot levels (P, S1, S2, R1, R2, etc.) show where the market is likely to react:
Supports (S1, S2, S3) → possible downward turning points.
Resistance (R1, R2, R3) → possible upward turning points.
These zones are often observed by many traders at the same time, making them self-fulfilling marks.
2. Trend determination and market sentiment
If the market opens above the pivot (P) and remains there → signals buying pressure.
If the market trades below the pivot (P) → signals selling pressure.
A break above R1 or below S1 may indicate a strong trend day.
EMA Exponential Moving Average
The EMA is the exponentially weighted moving average of a price.
It shows the average price of a security over a certain period of time, weighted according to recency – that is:
👉 more recent price data has more influence than older data.
This distinguishes it from the simple moving average (SMA), in which all values are weighted equally.
Benefits of the EMA in chart analysis -> Identifying trends
The EMA reacts more quickly to price changes than the SMA and is therefore ideal for:
Identifying trend reversals at an early stage
Confirming trend directions
👉 Rising EMA → Upward trend
👉 Falling EMA → Downward trend
Traders often use combinations such as:
EMA 50 / EMA 200 → Long-term trends
SIGNIFICANCE OF HIGHS AND LOWS
The daily high, daily low, weekly high, and weekly low are objective price zones that show:
Where the market bought (high) or sold (low) the most, and where supply and demand reached their extremes in the past period.
These levels often act as magnetic price zones in ongoing trading, where traders react (entry, profit-taking, or stop setting).
🎯 Use of yesterday's high and low (previous day high/low)
🔹Support and resistance levels
Yesterday's high often acts as resistance when the price comes from below.
Yesterday's low becomes support when the price falls from above.
➡️ Traders watch these levels closely to trade breakouts or reversals.
EMA 9 / EMA 20 → Short-term movements
🎯 Benefits of weekly highs and lows (Weekly High/Low)
Important structural markers in the higher time frame
Weekly highs and lows show medium to long-term market structure.
They are often considered stronger supports/resistances than daily levels.
➡️ For example, if the price breaks above the weekly high, this usually signals institutional interest and may indicate a continuation of the trend.
➡️ Conversely, failure to break above a weekly high may indicate market weakness or a reversal.
DAILY OPEN
The Daily Open is the price at which trading begins on a new day.
It marks the first price after the close of the previous trading session.
👉 In many markets (e.g., Forex, index futures, crypto), this is the starting point of daily price movement, where market direction and sentiment realign.
🎯 Benefits of the Daily Open in chart analysis
Direction indicator (daily bias)
The Daily Open serves as a neutral center line for the current trading day.
Traders use it to assess the market direction (bias):
Price above the Daily Open → bullish day (buyers dominate)
Price below the daily open → bearish day (sellers dominate)
📈 → If the daily open is broken and held above, this indicates upward momentum.
📉 → If it is broken below, this signals weakness.
This simple observation helps traders trade with the daily trend rather than against it.
STOCK MARKET OPENING HOURS
Every major stock exchange has defined trading hours during which institutional capital is active.
Examples (CET):
Asia (Tokyo/ Hong Kong) 1:00 a.m. – 9:00 a.m.
Europe (London/Frankfurt) 08:00 – 17:30
USA (New York) 15:30 – 22:00
Market dynamics change significantly during these time windows, as volume, liquidity, and volatility fluctuate depending on the session.
📈 Benefits in chart analysis
🔹Recognizing volatility and liquidity phases
At the start of a session (e.g., 9:00 a.m. in Frankfurt or 3:30 p.m. in New York), trading volume rises sharply.
This results in strong movements, often with changes in direction or breakouts.
👉 These phases are particularly suitable for:
Breakout strategies
Volume or momentum trades
Example:
If an index (e.g., DAX or S&P 500) reacts strongly at the US opening, this indicates institutional activity that may shape the rest of the day.
PSY HIGH AND PSY LOW
Psy High and Psy Low stand for:
Psychological High → the psychologically significant upper price level of a particular range
Psychological Low → the psychologically significant lower price level
These are often round numbers or striking price zones that market participants unconsciously use as a guide.
Examples:
For EUR/USD: 1.0500, 1.1000, 1.1500
For DAX: 17,000, 17,500, 18,000
For BTC/USD: 60,000, 65,000, 70,000
Traders also refer to such levels as “big figures” or “round numbers.”
📊 Why are psy levels so important?
Because they are based on human perception and market psychology:
👉 People think in round numbers, not in decimals such as 1.1037 or 17.264.
That's why:
Private investors often place their stop losses or take profits just above or below these levels, Institutional traders place large limit orders in these zones, and Algorithms react to the liquidity created there.
→ This results in increased volume, reaction patterns, and price movements at these levels.
ADR (Average Daily Range)
The ADR measures the average daily trading range of a market over a specific period of time – i.e., how many points, pips, or dollars the price typically moves per day.
Example:
If the DAX has moved an average of 180 points per day over the last 14 days, the ADR(14) = 180.
🎯 The benefits of ADR in chart analysis
🔹 Assessment of daily volatility
The ADR shows how much a market typically moves per day.
→ This allows you to see whether the current day is more volatile or calmer than normal.
Interpretation – Meaning
Current range < ADR
→ Market is still moving within normal limits → Potential for further movement
Current range ≈ ADR
→ Daily target largely achieved → lower probability of significant expansion
Current range > ADR
→ Market overextended → increased probability of correction or consolidation
👉 This helps you to plan entries, price targets, and stops realistically.
VWAP (Volume Weighted Average Price)
The VWAP is the volume-weighted average price of a security for a specific period of time – usually per day.
👉 Unlike a simple moving average (e.g., EMA), the VWAP takes into account how much was actually traded – not just where the price was.
It therefore reflects the fair market value, taking into account the trading volume.
🎯 Benefits of VWAP in chart analysis
🔹 Determining the fair average price
The VWAP shows where the majority of the trading volume took place – i.e., the price that the majority of market participants actually paid.
➡️ This is the “fair price of the day.”
Price above VWAP → buyers dominate (bullish)
Price below VWAP → sellers dominate (bearish)
This information is particularly valuable for determining the intraday bias (direction of the day).
BOLLINGER BANDS
Bollinger Bands consist of three lines based on a moving average (usually SMA 20):
Middle band:
→ usually the 20-period SMA (simple moving average)
Upper band:
→ SMA + (2 × standard deviation)
Lower band:
→ SMA − (2 × standard deviation)
👉 This means that the bands “breathe” with volatility – they widen when the market is volatile and contract when the market is calm.
🎯 The benefits of Bollinger Bands in chart analysis
🔹 Measuring market volatility
The main function of Bollinger Bands is to visualize the volatility of a market:
Wide bands → high volatility → strong movement/trend phase
Narrow bands → low volatility → calm market/consolidation
📈 When the bands contract sharply (“Bollinger squeeze”) → often a harbinger of an impending breakout.
KAMA
The KAMA was developed by Perry J. Kaufman.
Unlike normal moving averages such as SMA or EMA, it dynamically adjusts its smoothing to market conditions:
Low volatility / strong trend → reacts faster to price movements
High volatility / sideways movement → reacts slower, reduces false signals
The core idea: adaptability instead of rigid smoothing.
🎯 Benefits of KAMA in chart analysis
🔹 Filtering out market noise
KAMA smooths out unnecessary price fluctuations (noise) that many normal indicators mistakenly interpret as signals.
➡️ This minimizes false signals in sideways phases, while real trends remain visible.
EXTRA LARGE WICKS
A wick (or wick) is the thin line above or below the candle body:
Top → Highest price during the period
Bottom → Lowest price during the period
Long wick → Significant rejection of the price at this extreme zone
Example: A long upper wick means that the price rose high but was then pushed back sharply.
🎯 Benefits of long wicks in chart analysis
🔹 Recognizing rejections and resistance
Long upper wick: Sellers did not allow the higher price → possible downward reversal
Long lower wick: Buyers defended the lower price → possible upward reversal
💡 The market “speaks” through these wicks: It shows where buyers or sellers are not giving in any further.

Jet Stream V1Jet Stream catches the trends. Forgets the noise and allows you to lock into those big moves.
Wed, Nov 19 2025 V3 - Everything but alerts work.
Vortex Pro with Moving average [point algo]Vortex Pro with MA Dropdown is an enhanced version of the classic Vortex Indicator (VI), designed to help visualize directional strength by comparing positive and negative trend movement.
This version includes a smoothed “Vortex Pro” line, adjustable moving-average filtering, and dynamic zone coloring for improved readability.
How It Works:
The script calculates VI+ and VI− using directional movement and true range.
“Vortex Pro” is derived from the difference between VI+ and VI−, scaled for clarity.
A customizable moving average (EMA, SMA, HMA, WMA) is applied to help smooth volatility and highlight shifts in momentum.
Features :
• Vortex Pro Line
A scaled trend-strength line showing when positive movement is dominating or weakening.
• MA Type Dropdown
Choose between EMA, SMA, HMA, or WMA to smooth the Vortex Pro line.
• Zero-Line Structure
A plotted zero line is used to compare positive vs. negative strength visually.
• Dynamic Fill Zones
Green shading when the Vortex Pro line is above zero, red when below.
Usage:
This tool is designed for visual analysis of trend direction and momentum strength.
It does not generate buy/sell signals and should be used as part of a broader analysis approach.
Suitable for all timeframes and markets.

MadblockUser Instructions for the "Madblock" Indicator (Pine Script v6 – TradingView)
This script creates a daily "Madblock" zone based on the high and low of the 15:30–15:45 NY time period (previous day’s final 15 minutes of regular trading hours for US equities/indices). It then generates optional entry signals the following trading day when price breaks this zone while respecting additional filters (EMAs, time window, signal spacing, and daily limit).
1. How to Add the Script to Your Chart
1. Open TradingView (tradingview.com).
2. Open any chart (preferably ES, NQ, SPX, SPY, or another instrument with US trading hours).
3. Click Pine Editor at the bottom.
4. Delete any existing code and paste the entire script provided.
5. Click Add to Chart (or Save → Add to Chart).
6. The indicator will appear as “Madblock”.
2. Input Settings (customizable in the indicator’s settings panel)
| Input | Default | Description |
|-----------------------|---------|-------------------------------------------------------------------------------------------------|
| Show Madblock Boxes | true | Displays the purple Madblock zones on the chart. Uncheck to hide boxes but keep signals. |
| Box Color | Purple | Color of the Madblock rectangle and background. |
| Transparency | 80 | Background transparency of the box (0 = opaque, 100 = fully transparent). |
| Enable Madblock Signals | true | Turns the long/short entry signals on or off. |
| Show 50 EMA (15m & 30m) | true | Displays the 50-period EMA from the 15-minute and 30-minute timeframes (yellow & orange lines). |
3. What the Indicator Does – Core Functionality
**A. Madblock Zone Creation (Previous Day)**
- Every day at 15:30 NY time → a new box is started using the high/low of that 15:30 candle.
- At 15:45 NY time → the box is finalized by taking the maximum high and minimum low of both the 15:30 and 15:45 candles.
- The box is drawn from 15:30 that day until 17:00 the next trading day (skips weekend automatically).
- This finalized zone becomes the reference levels for the next trading day’s signals.
**B. Signal Generation (Current Trading Day)**
Signals can only appear between 09:45 and 15:59 NY time (no signals in the first 15 minutes after 09:30 open).
Long Signal (green triangle below bar, text “MB”)
- Price closes above yesterday’s Madblock high
- Price is above both the 15-min 50 EMA and 30-min 50 EMA
- At least 4 bars have passed since the previous signal
- Maximum 3 signals per day (long + short combined)
Short Signal (orange triangle above bar, text “MB”)
- Price closes below yesterday’s Madblock low
- Price is below both the 15-min 50 EMA and 30-min 50 EMA
- Same spacing and daily limit rules as long signals
4. Recommended Chart Settings
- Timeframe: 15-minute charts work best.
- Session: Use “Extended Hours” turned OFF (regular trading hours only) for most accurate appearance.
- Time zone: Ensure your chart is set to New York time (or Exchange time for US instruments).
5. Important Notes & Limitations
- The script requires at least two full trading days of history to display boxes and generate signals correctly.
- On Mondays the box is created from the previous Friday’s 15:30–15:45 period.
- Boxes are capped at 500 (TradingView limit); old boxes automatically disappear as new ones are created.
- Signals are purely mechanical and for educational/informational purposes only. No guarantee of profitability.
6. Quick Checklist for Daily Use
1. Confirm chart time zone is America/New_York.
2. Verify yesterday’s purple Madblock zone is visible (15:30–17:00 stretch).
3. Look for “MB” triangles only after 09:45 and before 16:00.
4. Maximum of three signals (combined long + short) per session.
That is all you need to start using the Madblock indicator effectively. Adjust the input settings to match your preferred visual style or to disable elements you do not need.

Trend-Adaptive 3-Band Reversal CloudThis indicator plots a trend-adaptive, volatility-based 3-band cloud on your chart to visually contextualize potential high-probability reversal, balance, and exhaustion price zones — all in strict alignment with TradingView’s house rules and best compliance practices.
How It Works
Trend Detection:
The script determines short-term trend direction using two adjustable EMAs (fast and slow). When the fast EMA is above the slow, the environment is classified as an uptrend; when below, as a downtrend.
Adaptive Bands and Clouds:
Around the dynamic trend baseline, three cloud “bands” are drawn using multiples of an ATR (Average True Range) volatility filter, automatically adjusting for evolving market conditions:
Middle Band (Fair Value Zone): Area around the baseline, where price is statistically balanced.
Upper Outer Band: In an uptrend, this shows a potential 'exhaustion/overextension' area; in a downtrend, it can act as a deep pullback or reversal area.
Lower Outer Band: In an uptrend, this highlights a possible 'deep pullback/reversal' area; in a downtrend, it becomes the potential exhaustion zone.
Contextual RSI Markers:
When price is in one of the outer bands and RSI is overbought (upper) or oversold (lower), a tiny diamond marker appears on that band as extra context — offering a visual cue for a possible high-momentum exhaustion or deep reversal zone, but never a trade signal or advice.
Visuals and Compliance:
All cloud regions use three different, semi-transparent colors for easy reading, and never block price action.
Labels indicate only “Possible Exhaustion,” “Deep Pullback Zone,” and “Balanced/Fair Value”—the language is strictly neutral and descriptive.
All calculations run only on confirmed, historical bars with zero repainting, no future bar lookahead, and no predictive overlays.
How to Use
Add to Chart:
Simply add the indicator to any chart and timeframe.
Configure:
Adjust the EMA, ATR, and RSI settings via the input panel to best fit your instrument and preferred sensitivity.
Choose band multipliers to widen or contract the cloud according to volatility or your system.
Toggle RSI marker/context highlighting as desired.
Interpretation:
Middle Cloud (“Balanced/Fair Value”): Price in this zone suggests mean reversion, equilibrium, or fair pricing for the session’s volatility/trend conditions.
Outer Clouds: If price reaches an outer cloud, pay attention for potential mean-reversion (if trend persists) or exhaustion zones (especially if a diamond appears).
Uptrend: Lower cloud is where larger pullbacks/reversals are often initiated; upper cloud indicates potential trend exhaustion.
Downtrend: Upper and lower clouds are reversed in interpretation.
Diamond Markers: A red diamond atop the upper band signifies RSI overbought; a lime diamond below the lower band shows RSI oversold. These do not recommend trading—only highlight increased likelihood that buyers/sellers may be overextended.
Best Practices:
Do not use the indicator in isolation or as a signal generator. Combine its context with price action confirmation, volume, or other non-repainting tools.
Use labels only for navigation/context, never as actionable advice.
Technical Details
Inputs/Customization: Fully adjustable (EMAs, ATR period, band multipliers, RSI thresholds, label/marker toggles).
Logic: All code processes only historical closed bars and overlays information in real time.
No repaint, strategy, or alerts: No signals, no script-driven trading, and no claims of prediction or guaranteed probability.
House-rule Clean: The script and its visuals are compliant with TradingView’s publishing requirements, both visually and textually.
Summary:
This tool is designed for traders who want to visually frame high-probability reversal, equilibrium, and exhaustion zones adaptively—while keeping price action primary and avoiding visual or conceptual clutter. Use it to better understand where price may statistically find resistance/support or revert, not to automate signals or guarantee outcomes

Nifty SMC S&R MA and All Indicator[SumitQuants]🇮🇳🔥 **Nifty SMC S&R + MA + VWAP + Order Flow Suite
**
Built for Indian Markets • Tuned for NIFTY, BANKNIFTY & NSE Stocks
A complete institutional-grade trading system crafted for Indian traders who want a serious edge using Smart Money Concepts, Market Structure, Support–Resistance Strength, VWAP, Breakout Logic & Trend Tools — all combined into ONE ultra-optimized indicator.
🧠 Why This Indicator Stands Out
Most indicators only show price.
This one shows intent — clear, confident, and easy to read.
It reveals:
➡ where institutions are active
➡ where liquidity is sitting
➡ where real strength is building
➡ and who is actually in control — buyers or sellers
This is how professional desks read the markets — and now you can too.
🔥 What’s Inside (Complete Feature Stack)
🟧 1. Support–Resistance Strength Engine (Buyer/Seller Strength %)
Your built-in market power meter:
🟦 Auto S/R zones
🟩 Buyer vs Seller Strength %
🟨 Strength boxes with clean visuals
🔁 Live reactions when price taps strong or weak zones
Perfect for timing entries, reversals, retests and trap-detections in NIFTY & BANKNIFTY.
🟩 2. Smart Money Concepts (Full SMC Suite)
A complete institutional SMC system:
✔ BOS / CHoCH (Internal + Swing)
✔ Market Structure in real time
✔ Internal & Swing Order Blocks
✔ Strong / Weak Highs & Lows
✔ Equal High / Equal Low (EQH/EQL)
✔ Fair Value Gaps (FVG)
✔ Trend Bias Coloring
✔ Premium / Discount Zones
Every element is built for clarity — high-quality visuals without chart clutter.
📈 3. Moving Average Suite (5 Fully Custom MAs)
Elegant MA system for trend confirmation:
✨ EMA
✨ SMA
✨ SMMA
✨ WMA
✨ VWMA
Beautiful colors, clean visibility, and completely optional — enable only what you need.
⚡ 4. Enhanced Supertrend System
A modern Supertrend built for actual usability:
🎨 3 display styles (Line / Histogram / Ghost Mode)
🔄 Clear trend-change signals
🌗 Background trend zones
⚡ No repaint
⏰ Alerts for every reversal
Ideal for intraday momentum and bias confirmation.
📉 5. Breakouts with Volume Confirmation
Stops you from getting trapped in fakeouts:
🔥 Support Break
🔥 Resistance Break
🟦 Bullish Rejection
🟥 Bearish Rejection
📈 Volume-validated breakouts
📊 Smooth visual labels for clean execution
Ultra useful for NIFTY/BANKNIFTY’s typical stophunt → reversal patterns.
🎯 6. VWAP System with Multi-Band Zones
Professional VWAP for Indian markets:
✔ Session VWAP
✔ Weekly VWAP
✔ Monthly VWAP
✔ Premium–Discount Zones
✔ Expansion vs Mean-Reversion levels
✔ Clean visual bands
Perfect for intraday scalping & morning session planning.
🔔 7. Full Alerts Framework Included
Get notified for all key institutional events:
🚨 BOS / CHoCH
🚨 Order Block Breakouts
🚨 Equal High/Low
🚨 Fair Value Gaps
🚨 Trend Changes
🚨 Breakouts
🚨 Swing / Internal Structure Events
Never miss a major shift again — even when away from charts.
🧽 8. Clean UI + Auto Watermark
🖤 Dark/Light mode optimized
🧊 Smooth spacing
✨ Minimalistic visuals
🔍 Zero chart clutter
⚡ High-performance
A premium interface built for Indian index trading.
🧪 Who Is This Built For?
✔ Intraday F&O Traders
✔ NIFTY & BANKNIFTY Scalpers
✔ Swing Traders
✔ Price Action + SMC Traders
✔ VWAP-Based Scalpers
✔ Anyone wanting a complete premium system in a single indicator
⚡ Why Indian Traders Love It
⚡ Captures Nifty morning trap zones
⚡ Predicts London session expansions
⚡ Warns about NY reversal pressure
⚡ Identifies true institutional footprints
⚡ Shows real strength behind S/R zones
⚡ Eliminates false breakouts
⚡ Gives bias, structure & context instantly
This is not just an indicator —
It’s a full institutional trading framework.
🛒 Get Full Access
This indicator is available exclusively inside the Courses section on the official website.
👉 Purchase & Access:
www.ironmindtrader.com
Inside the course:
🔧 Installation Steps
⚙️ Recommended Settings
📘 Trading Logic
🔄 Lifetime Updates Included

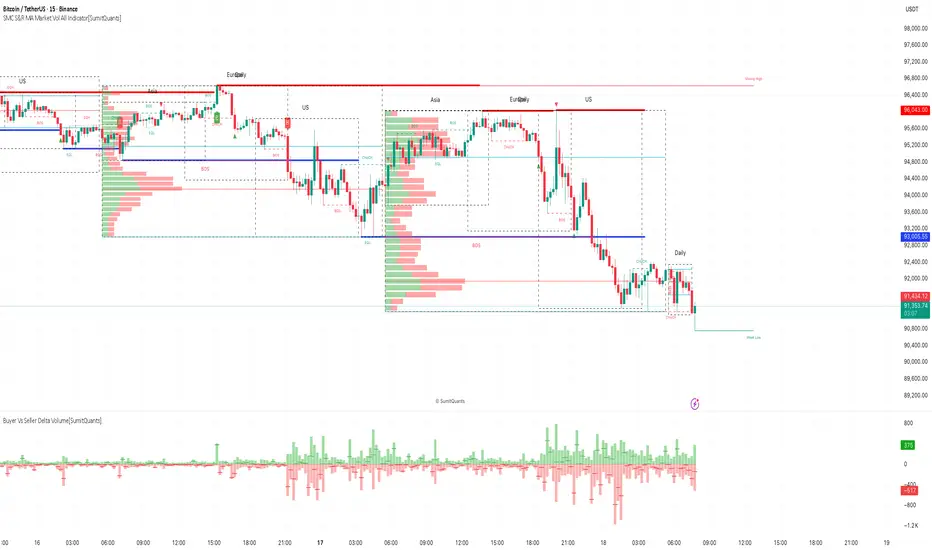
SMC S&R MA Market Vol All Indicator[SumitQuants]🚀 SMC S&R + Market Sessions + Volume Profile + Order Flow Suite
The Only All-In-One Institutional Trading System You’ll Ever Need.
Looking for an indicator that actually brings clarity to chaotic markets?
Meet the SMC S&R MA Market Volume & Sessions Order Flow System — a powerhouse that fuses Smart Money Concepts, Session Profiles, and Dynamic Volume Flow into one ultra-optimized institutional toolkit.
This is not “just another SMC indicator.”
This is your complete trading ecosystem.
💠 What This Indicator Does (In Simple Terms)
It automatically reads the market the way institutions do — and displays it cleanly on your chart with zero clutter.
Below is everything packed inside 👇
🔥 1. Market Sessions + Volume Profile (Real Institutional Map)
✔ Tokyo- Asia | London- Europe | New York- US sessions auto-detected ⏱️
✔ Each session gets its own Volume Profile 📊
✔ See POC, VAH, VAL, Value Area Box for each session
✔ Live Developing Profile in real-time
✔ Wick-based and body-volume distribution for ultra-accurate auctions
✔ Session Boxes that highlight imbalance zones
✔ Perfect for:
High-volume Asia breaks
London volatility expansion
NY reversal traps
👉 Think of it as having pro-level TPO/Volume Profile inside TradingView.
🎯 2. Advanced S&R Strength Engine (Buyer vs Seller Power Meter)
✔ Detects strongest Support & Resistance zones
✔ Measures Buyer Strength & Seller Strength (% based)
✔ Auto-plots S/R Lines + S/R Zones
✔ Detects Bounce signals, Rejection points, Pressure shifts
✔ Zero repaint logic
You get institutional footprints directly on your chart.
📈 3. Smart Money Concepts (Full Automation)
✔ BOS / CHoCH detection
✔ Internal + Swing Structure
✔ Order Blocks (Internal + Swing)
✔ Equal Highs & Equal Lows
✔ Fair Value Gaps (FVG)
✔ Strong/Weak Highs + Lows labeling
✔ Trend coloring (optional)
✔ Premium / Discount Zones
All plotted with precision.
All customizable.
All built to remove guesswork.
💹 4. Multi-MA Engine (5 Fully Configurable MAs)
✔ EMA, SMA, WMA, VWMA, SMMA
✔ Choose length, color, and source
✔ Ideal for trend confirmation + dynamic S/R
Smooth. Clean. Non-laggy.
📊 5. Enhanced Supertrend (Toggles + Filters)
✔ Switch between Line / Histogram / Hidden
✔ Optional background trend coloring
✔ Buy/Sell signals with trend-change alerts
✔ No repaint
Perfect for directional bias.
⚡ 6. Breakout Detection + Volume Confirmation
✔ Auto-detects Support/Resistance Breaks
✔ Confirms breaks through Volume Surge % Oscillator
✔ Detects:
Bullish Breaks
Bearish Breaks
Bullish Rejections
Bearish Rejections
You instantly know when a breakout is real or fake.
📍 7. VWAP System with Multi-Band Zones
✔ Session-based VWAP
✔ Bands via Std Deviation or %
✔ Clean pullback zones
✔ Perfect for intraday institutions-style precision
🧠 8. Fully Integrated Alerts
Alerts for:
✔ BOS / CHoCH (Internal + Swing)
✔ Order Block Breakouts
✔ Equal Highs / Equal Lows
✔ Fair Value Gaps
✔ S/R Zone Interactions
✔ Trend Shifts
✔ Breakouts with Volume Confirmation
✔ Supertrend Reversals
And more.
Never miss major price shifts again.
🎨 9. Clean UI + Auto-Adaptive Watermark
✔ Auto-contrast watermark
✔ Minimalistic but premium
✔ Chart-friendly colors
✔ Built to match dark or light themes
🌍 Who This Indicator Is For?
✔ Intraday traders
✔ Swing traders
✔ SMC traders
✔ Volume/Order Flow traders
✔ Forex, Crypto, Index & Stocks
✔ Anyone wanting a single all-in-one trading system
🔥 Why 90% Traders Love This System
Because it gives you:
🔥 Session Bias
🔥 Volume-backed Zones
🔥 Clean Market Structure
🔥 Trend Bias + Liquidity Areas
🔥 Institutional S/R with Strength Meter
🔥 Accurate Order Flow Reactions
Everything you need to trade like top-tier professionals — without needing 10 indicators.
🛒 Get Full Access
This premium institutional system is available as part of the Courses Section on the official website.
👉 Purchase the indicator as a Course at:
www.ironmindtrader.com
Inside the course, you'll get:
✔ Access instructions
✔ Setup guide
✔ Trading rules
✔ Updates included
Institutional Sessions Volume Order Flow [SumitQuants]Institutional Sessions Volume Order Flow
🔥 Institutional Sessions Volume Order Flow — The all-in-one Pine v6 toolkit that reveals institutional volume order blocks, session structure, VWAP bands and trend ribbon so you can trade with professional conviction.
🎯 See where smart money is active. Institutional Sessions Volume Order Flow surfaces high-volume order blocks, session boxes, VWAP bands, MA ribbon and Supertrend alerts — a single overlay that turns market noise into tradable structure. ⚡📈
✨ Key Features
📦 Institutional Volume Order Blocks: Detects bullish & bearish order blocks by aggregating volume around local highs/lows and plots filled zones with volume-percent labels.
🕒 Session Boxes & Timeline: Auto session boxes for Asia/ Europe / NewYork / Sydney with merge options, open/close lines, pip/% labels and optional candle coloring.
📉 VWAP with Bands: Multi-anchor VWAP (Session/Week/Month/Quarter/Year/Earnings/Dividends/Splits) plus up to 3 configurable bands (SD or % mode) and fills.
🧭 Moving Average Ribbon: 4-MA ribbon (SMA/EMA/SMMA/WMA/VWMA) for trend structure and dynamic S/R.
⚡ Supertrend Overlay: Optional Supertrend with conditional background fill and built-in trend-change alert hooks.
🔔 Prebuilt Alerts: Supertrend flips, session opens, session new highs/lows — ready for automation or notifications.
⚙️ Deep Customization: Colors, styles, lookback, merge behaviors, band multipliers, anchor periods, session times, label sizes, and more.
🛠 Pine v6 Optimized: Modern, overlay-ready Pine Script v6 implementation suitable for intraday and multi-timeframe use.
🧠 Why Traders Buy It
🔍 Institutional context: Volume-weighted order blocks reveal where large participants acted — crucial for high-probability trade planning.
✅ Stacked confirmation: Ribbon → VWAP → order block filters noise and aligns entries with institutional flow.
🌐 Session clarity: Quickly identify which market session is driving price and volatility.
📣 Actionable alerts: Be notified exactly when setups trigger so you don’t miss transitions.
🧩 Versatile: Great for scalpers, intraday momentum traders, swing traders, prop desks and system developers.
🚀 Quick Start (3 steps)
Add Institutional Sessions Volume Order Flow to your chart (Pine v6).
Enable Order Blocks + VWAP + Supertrend to begin.
Tune session times and band/MA settings for your instrument and timeframe. Use Supertrend + ribbon alignment + zone retest for higher-probability entries. 🎛️
🧾 Technical Notes & Compatibility
📜 Pine Script v6 — compatible with TradingView’s current scripting environment.
📌 Overlay indicator — draws directly on price chart.
🔔 Alerts use alertcondition hooks for TradingView notifications.
👤 Author: Created and maintained by SumitQuants.
⚠️ Risk Disclaimer
This tool provides context and signals — not guarantees. Backtest, paper trade, and use responsible risk management. Past performance is not indicative of future results. 📉
🛒 Call to Action (CTA)
Ready to trade with institutional clarity?
👉 Buy Institutional Sessions Volume Order Flow now — or message for a demo, custom tweaks, or a bundle including backtest/strategy code. Quick support and configuration help included. 💬
Reach out to the website and Buy This Indicator in the Courses Section www.ironmindtrader.com

Golden Cross 50/200 EMATrend-following systems are characterized by having a low win rate, yet in the right circumstances (trending markets and higher timeframes) they can deliver returns that even surpass those of systems with a high win rate.
Below, I show you a simple bullish trend-following system with clear execution rules:
System Rules
-Long entries when the 50-period EMA crosses above the 200-period EMA.
-Stop Loss (SL) placed at the lowest low of the 15 candles prior to the entry candle.
-Take Profit (TP) triggered when the 50-period EMA crosses below the 200-period EMA.
Risk Management
-Initial capital: $10,000
-Position size: 10% of capital per trade
-Commissions: 0.1% per trade
Important Note:
In the code, the stop loss is defined using the swing low (15 candles), but the position size is not adjusted based on the distance to the stop loss. In other words, 10% of the equity is risked on each trade, but the actual loss on the trade is not controlled by a maximum fixed percentage of the account — it depends entirely on the stop loss level. This means the loss on a single trade could be significantly higher or lower than 10% of the account equity, depending on volatility.
Implementing leverage or reducing position size based on volatility is something I haven’t been able to include in the code, but it would dramatically improve the system’s performance. It would fix a consistent percentage loss per trade, preventing losses from fluctuating wildly with changes in volatility.
For example, we can maintain a fixed loss percentage when volatility is low by using the following formula:
Leverage = % of SL you’re willing to risk / % volatility from entry point to stop loss
And when volatility is high and would exceed the fixed percentage we want to expose per trade (if the SL is hit), we could reduce the position size accordingly.
Practical example:
Imagine we only want to risk 15% of the position value if the stop loss is triggered on Tesla (which has high volatility), but the distance to the SL represents a potential 23.57% drop. In this case, we subtract the desired risk (15%) from the actual volatility-based loss (23.57%):
23.57% − 15% = 8.57%
Now suppose we normally use $200 per trade.
To calculate 8.57% of $200:
200 × (8.57 / 100) = $17.14
Then subtract that amount from the original position size:
$200 − $17.14 = $182.86
In summary:
If we reduce the position size to $182.86 (instead of the usual $200), even if Tesla moves 23.57% against us and hits the stop loss, we would still only lose approximately 15% of the original $200 position — exactly the risk level we defined. This way, we strictly respect our risk management rules regardless of volatility swings.
I hope this clearly explains the importance of capping losses at a fixed percentage per trade. This keeps risk under control while maintaining a consistent percentage of capital invested per trade — preventing both statistical distortion of the system and the potential destruction of the account.
About the code:
Strategy declaration:
The strategy is named 'Golden Cross 50/200 EMA'.
overlay=true means it will be drawn directly on the price chart.
initial_capital=10000 sets the initial capital to $10,000.
default_qty_type=strategy.percent_of_equity and default_qty_value=10 means each trade uses 10% of available equity.
margin_long=0 indicates no margin is used for long positions (this is likely for simulation purposes only; in real trading, margin would be required).
commission_type=strategy.commission.percent and commission_value=0.1 sets a 0.1% commission per trade.
Indicators:
Calculates two EMAs: a 50-period EMA (ema50) and a 200-period EMA (ema200).
Crossover detection:
bullCross is triggered when the 50-period EMA crosses above the 200-period EMA (Golden Cross).
bearCross is triggered when the 50-period EMA crosses below the 200-period EMA (Death Cross).
Recent swing:
swingLow calculates the lowest low of the previous 15 periods.
Stop Loss:
entryStopLoss is a variable initialized as na (not available) and is updated to the current swingLow value whenever a bullCross occurs.
Entry and exit conditions:
Entry: When a bullCross occurs, the initial stop loss is set to the current swingLow and a long position is opened.
Exit on opposite signal: When a bearCross occurs, the long position is closed.
Exit on stop loss: If the price falls below entryStopLoss while a position is open, the position is closed.
Visualization:
Both EMAs are plotted (50-period in blue, 200-period in red).
Green triangles are plotted below the bar on a bullCross, and red triangles above the bar on a bearCross.
A horizontal orange line is drawn that shows the stop loss level whenever a position is open.
Alerts:
Alerts are created for:Long entry
Exit on bearish crossover (Death Cross)
Exit triggered by stop loss
Favorable Conditions:
Tesla (45-minute timeframe)
June 29, 2010 – November 17, 2025
Total net profit: $12,458.73 or +124.59%
Maximum drawdown: $1,210.40 or 8.29%
Total trades: 107
Winning trades: 27.10% (29/107)
Profit factor: 3.141
Tesla (1-hour timeframe)
June 29, 2010 – November 17, 2025
Total net profit: $7,681.83 or +76.82%
Maximum drawdown: $993.36 or 7.30%
Total trades: 75
Winning trades: 29.33% (22/75)
Profit factor: 3.157
Netflix (45-minute timeframe)
May 23, 2002 – November 17, 2025
Total net profit: $11,380.73 or +113.81%
Maximum drawdown: $699.45 or 5.98%
Total trades: 134
Winning trades: 36.57% (49/134)
Profit factor: 2.885
Netflix (1-hour timeframe)
May 23, 2002 – November 17, 2025
Total net profit: $11,689.05 or +116.89%
Maximum drawdown: $844.55 or 7.24%
Total trades: 107
Winning trades: 37.38% (40/107)
Profit factor: 2.915
Netflix (2-hour timeframe)
May 23, 2002 – November 17, 2025
Total net profit: $12,807.71 or +128.10%
Maximum drawdown: $866.52 or 6.03%
Total trades: 56
Winning trades: 41.07% (23/56)
Profit factor: 3.891
Meta (45-minute timeframe)
May 18, 2012 – November 17, 2025
Total net profit: $2,370.02 or +23.70%
Maximum drawdown: $365.27 or 3.50%
Total trades: 83
Winning trades: 31.33% (26/83)
Profit factor: 2.419
Apple (45-minute timeframe)
January 3, 2000 – November 17, 2025
Total net profit: $8,232.55 or +80.59%
Maximum drawdown: $581.11 or 3.16%
Total trades: 140
Winning trades: 34.29% (48/140)
Profit factor: 3.009
Apple (1-hour timeframe)
January 3, 2000 – November 17, 2025
Total net profit: $9,685.89 or +94.93%
Maximum drawdown: $374.69 or 2.26%
Total trades: 118
Winning trades: 35.59% (42/118)
Profit factor: 3.463
Apple (2-hour timeframe)
January 3, 2000 – November 17, 2025
Total net profit: $8,001.28 or +77.99%
Maximum drawdown: $755.84 or 7.56%
Total trades: 67
Winning trades: 41.79% (28/67)
Profit factor: 3.825
NVDA (15-minute timeframe)
January 3, 2000 – November 17, 2025
Total net profit: $11,828.56 or +118.29%
Maximum drawdown: $1,275.43 or 8.06%
Total trades: 466
Winning trades: 28.11% (131/466)
Profit factor: 2.033
NVDA (30-minute timeframe)
January 3, 2000 – November 17, 2025
Total net profit: $12,203.21 or +122.03%
Maximum drawdown: $1,661.86 or 10.35%
Total trades: 245
Winning trades: 28.98% (71/245)
Profit factor: 2.291
NVDA (45-minute timeframe)
January 3, 2000 – November 17, 2025
Total net profit: $16,793.48 or +167.93%
Maximum drawdown: $1,458.81 or 8.40%
Total trades: 172
Winning trades: 33.14% (57/172)
Profit factor: 2.927

Advanced Intraday Darvas BoxThis indicator applies a modern Darvas Box strategy for intraday traders, using non-repainting pivot detection combined with strong filters to reduce chart noise:
Confirmed swing highs and lows: Boxes only form when genuine swing pivots appear, ensuring fully non-repainting signals.
Minimum box height: Small, "noise" boxes are filtered out using ATR multiples for meaningful zones.
Trend filter: Choose EMA, SMA, or VWAP to lock boxes and breakouts to market direction.
Volume confirmation: Boxes are only confirmed when volume is above a user-defined threshold, highlighting high-participation moves.
Breakout filter: Signals trigger only if the breakout candle closes substantially beyond the box, reducing false breakouts.
Limited box display: Recent boxes only, keeping your chart clean and readable.
Features & Inputs
Pivot sensitivity: Set the number of bars for swing calculation.
Box filtering: Specify the minimum ATR multiple for box size.
Trend selection: EMA, SMA, VWAP, or None.
Volume filter & threshold: Activate for greater breakout confidence.
Breakout/Breakdown strength: Set how far price must close beyond the box to signal power.
Maximum boxes: Control the number of active boxes to keep the chart clear.
How to Add and Use
Add to Chart:
Click the “Add to Favorite Scripts” star to mark this indicator.
Open your desired intraday chart (1m–30m works best).
Click “Indicators,” search for “Advanced Intraday Darvas Box,” and add to your chart.
Customize Inputs:
Use the settings gear ⚙️ to adjust pivot sensitivity, trend logic, box filtering, and volume confirmation.
Lower minimum box height or pivot length for more frequent signals. Raise them for sparser, higher conviction setups.
Reading Darvas Boxes:
Box Edges: Horizontal lines mark resistance (top) and support (bottom) of detected zones.
Shaded regions: Highlight the most relevant trading zones and where price could coil before breakout.
Breakout labels (↑/↓): These appear only when price makes a powerful, confirmed move beyond the box edge—aligned with trend.
Alerts: Turn on chart alerts using the “Strong Bullish Breakout” or “Strong Bearish Breakdown” alert conditions for automated signal monitoring.
Best Practices:
Use Darvas boxes to complement price action analysis. Combine with candlestick patterns, volume spikes, and other price structure.
Only trade strong breakout signals confirmed by volume and market direction.
Avoid excessive boxes—adjust "Max Boxes" and filters for your instrument and timeframe.
Important
This indicator is non-repainting and built for display clarity and clean signals.
No brokerage automation, no external linking, and pure price/volume logic—fully compliant with TradingView House Rules.
Always test settings and confirmations before using for live decision-making.

SMC Lite + PVSRA + MA Combo HELL 1great trading tool what you see is what you get supply and resistance pvsra candles

DTC - 1.3.6 DTC Trading ClubDTC – 1.3.6 | Advanced Multi-Timeframe Trend & Algo Trading System
Version: 1.3.6
Platform: TradingView
Category: Trend Following | Algo Automation | EMA-Based System
⚙️ 1. Algo Trading Integration (NEW FEATURE)
The DTC 1.3.6 system bridges TradingView charts and MT4/MT5 execution through PineConnector for full trade automation.
This allows signals generated by the indicator to instantly execute trades on your broker account using your unique Trading UID.
Purpose & Justification:
Many traders rely on chart-based strategies but struggle with delayed manual execution. The Algo module removes this limitation by automating execution directly from the chart while retaining full user control. This makes it particularly useful for systematic traders who want precision, consistency, and hands-off operation.
Key Features:
🔑 Trading UID Input: Enter your PineConnector UID (e.g., 88888999) for authenticated trade routing.
📊 Auto-Formatted Trade Message: All signals are converted into PineConnector-ready format:
88888999, buy, EURUSD, risk=0.01, comment=DTCAlgoMT4/MT5
⚙️ Full Customization: Users decide every aspect of execution — direction, position risk, TP/SL handling, signal triggers, comments, and automation level.
Practical Example:
If a Bullish EMA alignment occurs on EURUSD while the ATR filter confirms valid volatility, the Algo instantly sends a buy order to MT4/MT5 with all trade parameters defined in TradingView — enabling disciplined, automated execution without delay.
Requirements:
TradingView paid plan (for webhook automation)
PineConnector account (free tier supported)
Once connected, the DTC system becomes a fully autonomous trading solution, handling entries, exits, and TP/SL management in real-time.
📈 2. Multi-Timeframe Trend Dashboard
This feature provides an at-a-glance overview of market bias across key timeframes (1H–Monthly), powered by the EMA 30 vs EMA 60 trend structure.
Purpose & Justification:
Instead of switching between multiple charts, traders can instantly see the dominant market direction across all major timeframes. This prevents counter-trend trades and encourages entries that align with broader market momentum.
Dashboard Highlights:
Customizable position (top/bottom left/right)
Adjustable text size for clarity
Displays active trend for 1H, 4H, Daily, Weekly, and Monthly
Shows Unrealized PnL of the current open position
Displays ATR Filter Status (Active/Inactive with color coding)
Practical Example:
A trader sees a Bullish signal on the 1H chart, but the dashboard shows Bearish trends on higher timeframes — indicating possible short-term pullback rather than a trend reversal. This cross-timeframe awareness improves decision quality.
💹 3. EMA Trend System
At the core of DTC lies a 6-layer EMA engine (30–60) designed to identify strong, sustained market trends with minimal lag.
Logic:
Bullish: EMA 30 > 35 > 40 > 45 > 50 > 60
Bearish: EMA 30 < 35 < 40 < 45 < 50 < 60
Purpose & Justification:
Unlike simple two-EMA systems, this multi-layer method filters out temporary volatility and confirms trend stability before triggering signals. It forms the foundation upon which all other modules (signals, dashboard, algo, and volatility filter) operate.
🚦 4. Buy/Sell Signal Engine
Signals are automatically generated when EMA layers achieve full alignment — a clear confirmation of market direction change.
Conditions:
🟢 Buy Signal: Bearish/Neutral → Bullish alignment
🔴 Sell Signal: Bullish/Neutral → Bearish alignment
Signals appear as chart markers and can trigger PineConnector automation.
Purpose & Justification:
This systematic approach removes emotional decision-making and allows traders to execute only when objective technical conditions are met. It ensures that trades align with verified EMA-based momentum, not short-term price noise.
🎯 5. Dynamic TP/SL and Entry Visualization
Every trade signal comes with a structured plan:
Entry, Stop-Loss, and seven Take-Profit levels
Accurate price labels and color-coded zones
Customizable SL modes: Tiny, Small, Mid, or Large
Purpose & Justification:
Visual clarity is vital for risk control. The indicator presents all levels directly on the chart, so traders instantly see potential reward-to-risk scenarios and manage trades with confidence. These levels also integrate seamlessly with PineConnector automation for direct execution.
📊 6. ATR Volatility Filter
The ATR (Average True Range) module filters low-quality setups during flat or choppy markets.
Mechanics:
Adjustable ATR period and multiplier
Filters weak signals when volatility drops below threshold
Purpose & Justification:
ATR adds a volatility-based confirmation layer to the EMA logic. For instance, if EMAs align but ATR volatility is below the active threshold, no trade is executed — reducing false signals during quiet sessions. When ATR exceeds the threshold, trades are allowed, improving accuracy and overall system efficiency.
Example:
During a ranging session on GBPUSD, EMAs may align briefly, but low ATR prevents a false breakout entry. Once volatility returns, the same logic allows a valid trade — demonstrating how ATR integrates into the system to maintain trade quality.
🎨 7. EMA Cloud Visualization
The EMA Cloud fills the area between EMA 30 and EMA 60 to visualize momentum strength and transitions.
🟩 Green cloud → Bullish bias
🟥 Red cloud → Bearish bias
Purpose & Justification:
This feature provides immediate visual cues for traders to identify trend continuation or potential reversal zones. It reinforces the EMA Trend System, ensuring that market structure and momentum remain visually synchronized.
🧭 8. Full Customization Control
DTC 1.3.6 allows traders to tailor every aspect of their experience:
Enable/disable components such as Algo, Dashboard, TP/SL, and Cloud
Modify color themes, layouts, and text sizes
Adjust to suit manual or automated trading preferences
Purpose & Justification:
Different traders have different workflows. By allowing total flexibility, DTC can adapt to short-term scalping, swing trading, or long-term automation setups without performance compromise.
✅ Summary
DTC 1.3.6 is a professional-grade, multi-layer trading system that integrates EMA-based trend detection, volatility filtering, dashboard visualization, and algo automation into one cohesive tool.
Each module contributes to a unified goal — identifying high-probability market conditions, confirming them through volatility, and executing with precision.
This system is Invite-Only because it represents a complete, ready-to-deploy professional framework — not a single indicator — and requires responsible use of automation features that directly impact live trading accounts.
DTC = Smart Visuals + Total Control + True Automation.
⚠️ Disclaimer
This indicator is for educational and research purposes only.
The DTC Team, developers, and affiliates do not provide financial advice and assume no responsibility for profits or losses from its use.
Trading involves substantial risk.
Past performance is not indicative of future results.
Users should test thoroughly on demo accounts, perform independent analysis, and consult a licensed financial advisor before live trading.
By using this tool, you acknowledge that all actions are taken at your own risk and that the DTC Team bears no liability for any outcomes.
