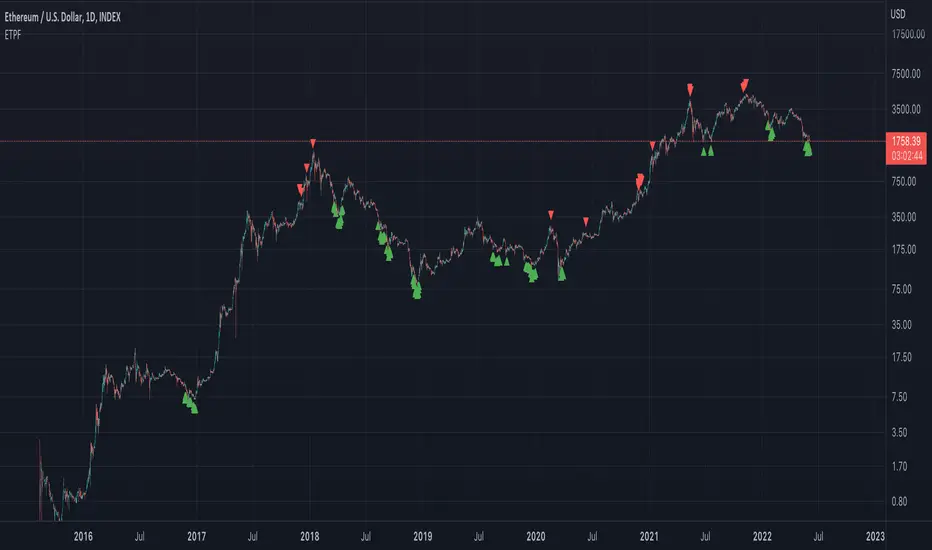
LRHS Strategy 🇺🇸 An advanced indicator designed to identify potential reversal zones based on liquidity hunts and market structure.
It helps traders understand where major players trap participants before a significant move, allowing for more precise detection of key reversal points.
⚙️ Main Features:
• Automatic detection of liquidity grabs (previous highs/lows)
• Multi-timeframe analysis with smart filtering between hunt and confirmation timeframes
• Clear visual signals highlighting structural reversal zones
• Compatible with Bitcoin, Ethereum and Gold.
• Optimized for price action trading
⚠️ Disclaimer / Avertissement
This indicator is for educational and informational purposes only.
It does not constitute financial or investment advice.
Trading involves a high level of risk, and the author is not responsible for any financial losses that may occur.
Always do your own analysis and risk management before taking a trade.
Past performance does not guarantee future results.
ETHUSDT

1H EMA window multiple cyclesThis is a display method with nested EMAs across multiple timeframes. Within the one-hour window, you can see whether there are key moving averages providing resistance above or below the current candlestick, allowing for effective judgment and eliminating the need to repeatedly switch between different timeframes and multiple alerts.
这是一个多时间级别EMA嵌套的显示方式。在一小时窗口下,可以看到当下K线的上下是否有关键均线的阻力,以便做出有效判断,免去了切换不同时间窗口和多重报警的反复切换。

SVTR [Ultimate]SVTR v1.0 is a fully automated trading strategy designed to identify high-probability market opportunities using structured momentum, trend validation, and risk-controlled execution logic.
This strategy is not a simple signal generator.
It is a complete decision engine that evaluates market conditions, confirms entries with multiple filters, and manages trades automatically according to predefined logic.
Built for traders who want consistency, discipline, and objective execution, SVTR removes emotional bias and delivers rule-based trading across different market environments.
KEY FEATURES
• Fully automated entry and exit logic
• Multi-layer confirmation system
• Momentum and trend validation
• Smart trade filtering to reduce noise
• Works on multiple markets and timeframes
• Non-repainting logic
• Alert-ready for automation and integrations
AUTOMATED STRATEGY LOGIC
SVTR continuously analyzes the market and only executes trades when all required conditions align.
This prevents overtrading and avoids weak or low-quality setups.
The strategy is designed to:
Enter when momentum and direction are confirmed
Avoid choppy and uncertain market phases
Exit trades based on objective, rule-driven logic
Maintain consistency regardless of emotions or bias
WHY THIS STRATEGY?
Most traders fail not because of bad ideas, but because of:
Late entries
Emotional decisions
Overtrading
Lack of discipline
SVTR v1.0 solves these problems by automating the decision process and executing trades exactly as designed, every time.
You trade the system.
Not your emotions.
WHO IS IT FOR?
• Traders looking for automated execution
• System-based and rule-driven traders
• Swing traders and intraday traders
• Traders who want consistency over discretion
• Users who want a ready-to-use strategy framework
IMPORTANT NOTES
• Invite-Only / Private access
• Source code is protected
• Designed for backtesting, automation, and live monitoring
• Strategy behavior may vary depending on market conditions and settings
VERSION
v1.0 – Initial Private Release
Future updates may include optimizations, additional filters, and performance improvements.
FINAL STATEMENT
SVTR v1.0 is built for traders who value structure, confirmation, and automation over guesswork.
If you are looking for a strategy that executes with discipline, filters weak setups, and operates as a complete automated system, this strategy is designed for you.

Eagle Eye Pro Dashboard 🔴 IMPORTANT NOTICE
This indicator is an advanced trading support tool. It helps you spot opportunities and improve your analysis, but it DOES NOT guarantee results nor replace your personal judgment.
• 🔴 Every trade remains your sole responsibility.
• 🔴 Risk is always present: the indicator does not eliminate it, only helps manage it.
• 🔴 The indicator is restricted: it ONLY generates signals during the London and New York sessions.
• 🔴 It does not generate signals outside those sessions or during weekends, to ensure better accuracy and performance.
• 🔴 It is not recommended to trade other assets or use timeframes different from those specified.
EAGLE EYE PRO V71.2 RENTAL
This indicator is built to deliver clear signals and a professional dashboard, specially optimized for BTC.
🔑 Key highlights:
• 🔴 Exclusively optimized for BTC.
• 🔴 Recommended timeframe: 15 minutes, providing cleaner and more reliable signals.
• 🔴 Adventurous mode: 1 minute, but with higher risk due to extreme volatility.
• 🔴 Restricted hours: the indicator works only during the London and New York sessions.
• 🔴 It does not operate during weekends
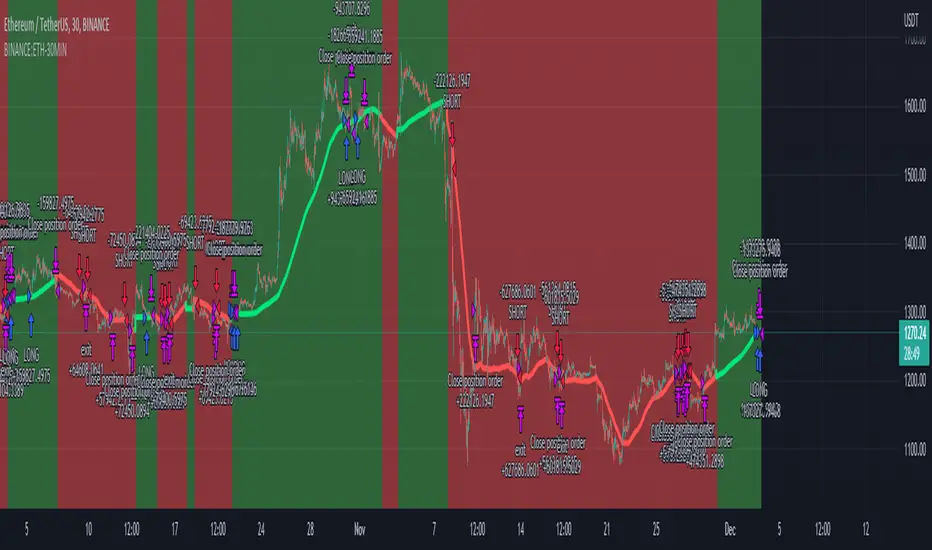
ETH INFINITY TREND [1H]: The Institutional Anti-Crash AlgorithmSTOP TRADING AGAINST THE TREND. AUTOMATE YOUR SUCCESS.
Are you tired of strategies that make big gains one month and give it all back the next? Are you looking for an algorithm capable of beating the market while strictly protecting your capital during Crashes?
Discover ETH Infinity Trend , the H1 Swing Trading strategy designed for consistency, safety, and long-term performance.
This is not a nervous scalping bot eaten alive by fees. It is an intelligent Trend Following system, calibrated to capture major Ethereum directional moves while staying liquid (Cash) when the market becomes dangerous.
🏆 WHY IS THIS STRATEGY UNIQUE?
✅ "Bulletproof" History (2017-2025) Unlike the market, which suffered massive losses in 2018 (-80%) and 2022 (-65%), this algorithm successfully protected capital during EVERY major bearish phase.
✅ Bull Run Outperformance The algorithm doesn't just follow; it accelerates gains during parabolic phases (like 2021 and 2025) by staying in position as long as the bullish structure remains intact.
✅ Zero Stress / Zero Overtrading The strategy is patient. It filters out market "noise" to take only high-probability moves. No more stress from holding open positions during crashes.
⚙️ THE "SMART TREND" ENGINE (Proprietary Logic)
This script uses a combination of 3 algorithmic engines to secure your entries. Exact settings are protected to ensure a competitive advantage for members:
Adaptive Trend Engine: Detects flow direction with a wide safety factor to avoid "scam wicks" and stop hunts typical of crypto exchanges. Institutional Long-Term Filter: We only trade in the direction of big investment funds. If the Macro trend is bearish, the algorithm forces a Cash (USDT) position to preserve capital. Dynamic Momentum Filter: The algorithm stays inactive during flat markets (Ranging) to avoid grinding down capital with fees. It only enters if the movement has genuine impulsive strength.
📊 CERTIFIED PERFORMANCE (Historical Backtests)
The numbers speak for themselves. Here is how the strategy behaves under extreme market conditions:
🟢 Current Profitability (2025 YTD): +91% While the classic market (Buy & Hold) shows about +55%, the algorithm massively outperforms by avoiding intermediate corrections.
🛡️ Crash Resistance (2018 Bear Market): +29% This is the most important statistic. In 2018, Ethereum lost -82% of its value. Most traders were wiped out. This strategy not only protected capital but finished the year in profit.
💎 Zero Negative Years (2017-2025) Over a complete 8-year history, including two major market cycles, the strategy has never closed a year with a loss.
📉 RISK MANAGEMENT
Profit Factor: > 2.0 (For every $1 lost, the strategy earns more than $2). Controlled Drawdown: The strategy cuts losing positions quickly using a dynamic Trailing Stop, keeping equity drawdown far below that of the market. Fees Included: All results include transaction fees (Taker) and slippage estimates.
🤖 READY FOR AUTOMATION
This script is turnkey ready to be connected to bots via Webhooks (3Commas, Alertatron, or Custom Python Bot on Vultr/AWS).
No Repainting: Signals are fixed at candle close. What you see is what executes. Clear Signals: Buy (Long) and Exit alerts are fully configurable. Zero Leverage Needed: The strategy is designed to be profitable on Spot or 1x Futures.
🔒 ACCESS & INVITATION
This script is available via Invite Only to guarantee exclusivity and preserve signal quality.
👉 HOW TO GET ACCESS? Send me a private message here on TradingView to inquire about access conditions.
Disclaimer: Past performance is not indicative of future results. Cryptocurrency trading involves risk. Only invest what you can afford to lose.

QED All-In-One(COM)-The yellow diamond and blue star are strong "Long" signals when the LF indicator's pink line crosses below 10.
-The pink star and yellow star are strong "short" signals when the LF indicator(NOT STUPID RSI) is above 90.
-The oversold (exclamation mark) signal indicates that a strong upward or downward trend could be imminent.
SUBSCRIPTION IS NEEDEED.
----------------------------------------------------------------------------------------------------------------
when pink line hits the bottom (close to 0). go for long. same as the short (opposite way)
DO NOT ENTER WHEN PINK LINE IS IN THE MIDDLE (close to YELLOW LINE). That's not the bottom or top you are looking for.
imgur.com
**************************
-노란색 다이아몬드와 파란색 별은 "Long" 시그널로 LF지표 핑크색 라인이 하단 10을 통과할때 강력합니다.
-핑크색과 노란색 별은 "short"시그널로 LF지표가 90이상일때 강력합니다.
-과매도(느낌표) 시그널은 곧 상승/하락의 추세가 될 수 있음을 의미합니다.

Asset vs Total Market Cap & Relative Strength Purpose
This indicator allows traders to compare a selected asset to the major market benchmarks:
BTC – primary crypto market leader
ETH – secondary crypto market leader
USDT.D – shows market risk-on vs risk-off sentiment
TOTAL – total crypto market capitalization, useful for overall market trends
It also provides relative strength calculations:
Rel. Strength = Asset % change - USDT.D % change
Rel. Strength vs Total = Asset % change - Total % change
This allows you to see if your asset is outperforming or underperforming broader benchmarks.
The table covers multiple timeframes, making it easy to scan both short-term and longer-term trends:
Row Timeframe
0 Current
1 15m
2 1H
3 4H
4 1D
Selected Asset / BTC / ETH:
Green for positive % change
Red for negative % change
Gradient intensity proportional to magnitude (maxAbsChange input)
USDT.D:
Orange if rising (risk-off)
Teal if falling (risk-on)
Total Market Cap / Rel. Strength:
Gradient reflects asset performance relative to total market, independent of USDT.D.
Positives
Compact dashboard: Everything is in one table for quick scanning.
Multi-timeframe comparison: Traders can instantly see short-term vs long-term strength.
Relative performance visualization: Gradients immediately highlight outperformers and underperformers.
Benchmark comparisons: Asset vs BTC, ETH, USDT.D, and Total Market Cap.
Independent Rel. Strength: Highlights whether the asset is outperforming even if the total market moves.
Customizable gradient sensitivity: maxAbsChange and maxRelChange allow tuning how “strong” the colors appear.
Chart plotting: Rel. Strength vs total market is plotted for further visual reference.
How to Use
Green table cells → strong positive movement
Red table cells → negative movement
Rel. Strength > 0 → asset outperforming
Rel. Strength < 0 → asset underperforming
Use table to compare relative performance vs BTC, ETH, and total market for informed trading decisions.

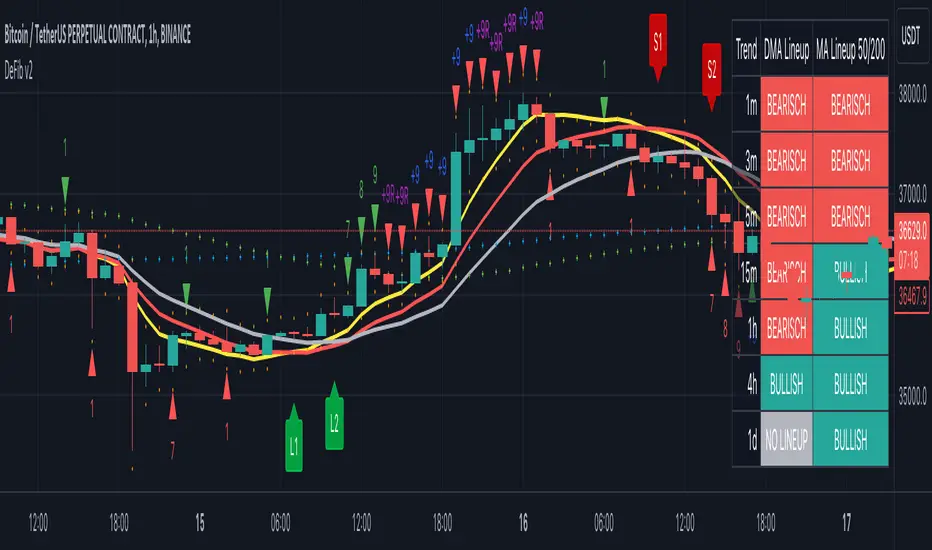
CryptoSignalScanner - DeFib v2 indicatorDESCRIPTION:
The DeFib indicator combines Moving Averages data points, Fibonacci sequence calculations and other methods to help traders make better decisions when it comes to entering and exiting trades at different time intervals. By analyzing these data points, the indicator provides valuable insights into the market trends and helps traders determine optimal moments to enter or exit a trade. Moving Averages helps smooth out price fluctuations over a specified period, providing a clearer picture of the overall market direction. The DeFib indicator uses a mix of these averages and Fibonacci methods to increase its chances of finding good trade opportunities. Whether analyzing short-term trends or longer-term patterns, this indicator assists traders in identifying favorable entry and exit points, thereby supporting more informed and strategic trading decisions.
By using Moving Averages data points based on the Fibonacci Sequence (+ some extra calculations we don't wish to share), we incorporate a unique perspective into the analysis. It helps to identify key levels of interest, potential trend reversals, and areas where price action may align with Fibonacci retracement levels. The Fibonacci Sequence is a mathematical sequence in which each number is the sum of the two preceding numbers (e.g., 0, 1, 1, 2, 3, 5, 8, 13, 21, and so on).
As a result of this information some L1, L2, S1 and S2 labels are printed on the chart. The labels are printed when a candle has been closed. Those labels are an indication when to enter or exit a trade. How to use those labels is described in the section "HOW TO USE" below.
This indicator is versatile and can be used on any timeframe, offering a wide range of features to support traders in their decision-making process. Here are some key aspects of this indicator:
User-Friendly:
Traders can easily customize all the settings according to their preferences, ensuring a personalized trading experience.
Long Signals:
The indicator provides both normal and strong long signals, which assist traders in identifying potential reversals in the market. These signals act as confirmation for traders to consider entering a long position.
Short Signals:
Similarly, the indicator offers normal and strong short signals, helping traders identify and confirm potential market reversals for short positions.
Fibonacci Sequence Calculation:
The calculation of the Long and Short labels is based on the Fibonacci Sequence, a mathematical pattern widely used in technical analysis. This adds a reliable and systematic approach to the indicator's signal generation.
Stop Loss:
When initiating a trade, it is our standard practice to implement a stop loss order based on the stop loss signal derived from the current or preceding candle. These stop loss signals are generated using the Average True Range (ATR) indicator.
Overlays:
The indicator includes overlays that visually represent market trends. These overlays identifying support and resistance levels, and providing valuable insights into the overall market behaviour.
Trend Table Box:
Traders can access a trend table box that displays the prevailing trend across different timeframes. This feature allows traders to assess the trend's strength and consistency. Additionally, users have the flexibility to adjust the timeframes based on their trading preferences.
Long/Short Alerts:
The indicator offers the functionality to add alerts for both long and short positions. Traders can set up notifications to be alerted when specific conditions are met, ensuring they stay informed even when they're not actively monitoring the charts.
Overall, this indicator provides traders with a comprehensive set of tools and features to enhance their trading decisions. Its user-friendly nature, combined with the inclusion of various signals, overlays, trend analysis, and alerts, enables traders to make informed choices and adapt to different market conditions effectively.
HOW TO USE:
This indicator incorporates specific signals that provide valuable insights into potential trend reversals in the market. Here's how each signal type is interpreted:
L1 (Long) Signal:
When an L1 signal appears, it suggests a potential uptrend reversal. Traders should pay attention to this signal as it indicates a possible shift from a downtrend to an uptrend. It serves as an early indication of a potential upward movement in prices. This is the fist point where we can take a long position. If we want to invest $100 into this trade we invest a maximum of $50 at this point. Don't forget to put a stop loss as described below in the "STOP LOSS" section.
L2 (Long) Signal:
An L2 signal acts as confirmation of the potential uptrend reversal identified by the L1 signal. When an L2 signal emerges, it strengthens the case for an upcoming uptrend. Traders may consider this signal as a stronger indication to support their decision to enter a long position. This is the point where we can invest another $50 if we already invested on the L1 signal. If we did not invested yet and we still see a clear reversal we enter the trade here with $100. Don't forget to put a stop loss as described below in the "STOP LOSS" section.
S1 (Short) Signal:
When an S1 signal is generated, it suggests a potential downtrend reversal. Traders should take note of this signal as it indicates a possible shift from an uptrend to a downtrend. It serves as an early indication of a potential downward movement in prices. This is the fist point where we can take a short position. If we want to invest $100 into this trade we invest a maximum of $50 at this point. Don't forget to put a stop loss as described below in the "STOP LOSS" section.
S2 (Short) Signal:
An S2 signal confirms the potential downtrend reversal identified by the S1 signal. When an S2 signal emerges, it reinforces the likelihood of an upcoming downtrend. Traders may consider this signal as a stronger indication to support their decision to enter a short position. This is the point where we can invest another $50 if we already invested on the S1 signal. If we did not invested yet and we still see a clear reversal we enter the trade here with $100. Don't forget to put a stop loss as described below in the "STOP LOSS" section.
These signals provide traders with a systematic framework to identify and evaluate potential reversals in market trends. By combining the information provided by both the L1 and L2 signals (for uptrends) or the S1 and S2 signals (for downtrends), traders can gain more confidence in their assessments of trend reversals. This indicator offers traders a valuable tool to capitalize on these reversal opportunities and make more informed trading decisions.
It is important to exercise caution and avoid blindly following the signals generated by the indicator. Instead, it is recommended to seek additional confirmations from other technical indicators such as the RSI (Relative Strength Index), MACD (Moving Average Convergence Divergence), or any other indicators that you are familiar with and trust.
While the signals provided by the indicator can be a useful starting point, relying solely on them may not always guarantee accurate predictions. By considering other technical indicators, traders can gain a more comprehensive view of the market conditions and validate the signals received from the indicator.
The RSI is a popular momentum oscillator that measures the speed and change of price movements. It helps traders identify overbought and oversold conditions, giving insights into potential trend reversals. The MACD, on the other hand, combines moving averages to provide signals for trend identification, as well as momentum and divergence analysis.
By utilizing these additional indicators or any others that you are familiar with, you can confirm the signals generated by the indicator under consideration. This approach enhances the reliability of your trading decisions by adding another layer of analysis and reducing the potential for false signals.
Each trader may have their preferred set of technical indicators based on their trading style and experience. It is important to select indicators that align with your trading strategy and complement the signals received from the indicator in question. This way, you can make more informed and well-rounded trading decisions, increasing the probability of successful trades and minimizing potential risks.
Stop Loss:
When initiating a trade, it is our standard practice to implement a stop loss order based on the stop loss signal derived from the current or preceding candle. These stop loss signals are generated using the Average True Range (ATR) indicator.
By employing a stop loss order, we aim to limit potential losses in case the trade moves against our anticipated direction. The stop loss signal, determined from the current or previous candle, provides a specific level at which the stop loss order is placed.
The Average True Range indicator is utilized to gauge the volatility of the market and determine an appropriate stop loss level. It takes into account the price range of the asset over a defined period, considering both high and low price points. By using the ATR, we can identify an optimal stop loss level that accounts for the asset's recent price fluctuations.
Implementing a stop loss based on the ATR-derived signal adds a layer of risk management to our trading strategy. It helps mitigate potential losses by automatically triggering the stop loss order if the price reaches or exceeds the predetermined level. This approach allows us to protect our capital and minimize the impact of adverse price movements.
It is important to note that the ATR-based stop loss signals should be used in conjunction with other analysis techniques and indicators. They serve as a dynamic reference point that considers market volatility, ensuring the stop loss level is adjusted accordingly.
By incorporating stop loss orders based on the stop loss signals derived from the current or previous candle using the ATR indicator, we aim to safeguard our trades and manage risk effectively. However, it is important to continually monitor and adjust the stop loss level as market conditions evolve, adhering to our risk management strategy throughout the duration of the trade.
Candlestick Sequence:
The Candlestick Sequence is a calculation used to identify potential trend reversal points in the financial markets. It consists of two main components, the Candlestick Sequence and the Candlestick Reversal. The Candlestick Sequence and Candlestick Reversal offer a structured way to identify potential reversals in the market.
WARNING:
• It is not advisable to engage in Leverage Trading unless you possess chart reading skills.
• It is not advisable to engage in Leverage Trading unless you are capable of interpreting technical indicators such as RSI, Moving Average, MACD, and others.
• It is crucial not to blindly follow trading signals without conducting your own analysis (DYOR - Do Your Own Research).
• Avoid succumbing to FOMO (Fear Of Missing Out) and impulsively entering trades. If you miss an entry point, it is important to let it go and patiently wait for the next potential entry point.
Leverage trading involves trading with borrowed funds, which amplifies both potential profits and losses. To participate in this form of trading, it is imperative to possess a certain level of expertise and knowledge. One key requirement is the ability to read and analyze charts effectively. Chart reading involves understanding various chart patterns, price movements, and support and resistance levels, among other factors. Without this skill, it can be challenging to make informed decisions and manage risk appropriately.
Additionally, leverage trading relies on technical indicators to identify potential trading opportunities and gauge market conditions. It is essential to have the ability to interpret indicators such as RSI, Moving Average, MACD, and others, as they provide valuable insights into market trends, momentum, and potential reversals. Ignoring or misunderstanding these indicators can lead to incorrect trading decisions and increased risk exposure.
Moreover, it is crucial not to blindly rely solely on trading signals, including those generated by indicators or other sources. While signals can be helpful, they should always be complemented by conducting one's own analysis. This entails conducting thorough research, considering multiple factors, and validating the signals with additional indicators or technical analysis techniques. This approach helps in making more informed and well-rounded trading decisions.
Finally, FOMO can be a detrimental emotion that drives impulsive and irrational trading behavior. It is important to avoid entering trades solely because of the fear of missing out on potential profits. If an entry point is missed, it is recommended to exercise patience and discipline by waiting for the next suitable opportunity. This approach helps to avoid unnecessary risks and maintain a more strategic and calculated trading approach.
By adhering to these warnings and taking the necessary precautions, traders can approach leverage trading more responsibly and increase their chances of success while mitigating potential losses.
REMARKS:
• It is important to emphasize that any information or content you encounter here is not intended as financial advice. We want to make it clear that we are not authorized or qualified to provide personalized investment advice. Our content, including ideas, opinions, views, predictions, forecasts, commentaries, suggestions, or stock picks, should be viewed strictly as informational, entertaining, or educational material.
• We emphasize that you should not construe the information provided here as personal investment advice or as a recommendation to take specific investment actions. It is crucial to conduct your own research, consider your individual financial circumstances, and consult with a qualified financial professional before making any investment decisions.
• While we aim to provide accurate and reliable information, we cannot guarantee the absence of errors or inaccuracies. Therefore, it is recommended to independently verify any information provided and exercise your own judgment when using it for decision-making purposes.
• Please be aware that any actions you take based on the information found here are done so at your own risk. We disclaim any liability for the consequences of your actions or decisions stemming from the information presented.
• Our intention is to provide helpful information that can contribute to your overall understanding and assist you in making better-informed decisions. However, it is essential to exercise caution, seek professional advice, and take responsibility for your investment choices.
Cheers & Good luck.
Crypto Uptrend Script + Pullback//Volume CandlesDescription: his is an adaption of my Pullback candle - This works on all timeframes and Markets (Forex//Stocks//)
Crypto Uptrend Script with Pullback Candle allows traders to get into a trend when the price is at end of a pullback and entering a balance phase in the market (works on all markets). The use of Moving averages to help identify a Trends and the use of Key levels to help traders be aware of where strong areas are in the market.
This script can work really well in Crypto Bull Runs when used on HTF and with confluences
The script has key support and resistance zones which are made up of quarterly data. Price reacts to these areas but patience is required as price will take time to come into these areas
I have updated the Pullback Candle with the use of Volume to filter out the weak Pullback Candles -
There are new candles to the script.
The First candle is the Bullish Volume Candle - This candle is set to a multiplier of 2x with a crossover of 50/100 on Volume - this then will paint a purple candle.
Uses of the Bullish Volume Candle:
Breakthrough of key areas // special chart patterns
Rejection of key areas
End of a impulse wave (Profit Takers)
The second candle is a Hammer - I prefer using the Hammers on Higher Timeframes however they do work on all timeframes. .
The third candle is a Exhaustion of impulse downward move.
Uses of this candle - can denote a new trend but has to be with confluence to a demand area // support area or with any use of technical analysis - using this alone is not advised
The fourth candle is a indecision candle in the shape of a Doji - this candle can help identify if the trend is in a continuation or a reversal
This script can work really well in Crypto Bull Runs
Disclaimer: There will be Pullbacks with High Volume (Breakouts) and not go the way as intended but this script is to allow traders to get into trends at good price levels. The script can paint signals in areas where price is too expensive so please do your own due diligence on the markets as this script is to help get into good areas of price
Please leave a thumbs up if you like this script and message me for information on how to use the script.

Time Based Crypto DayTrade StrategyThis is a time based strategy, designed to enter and exit within the same day of the week, using different hours for entry and exit.
The script is long only direction, and it has no risk management inside, so use it with caution.
At the same time you can also calculate each individual hour return within a certain day, and make your own idea about the best moments to be enter.
In order to filter a bit from the bad trades, I have applied an ATR filter, to check if that volatility is rising in order to help eliminate some of the bad trades when there is no volatility around.
For this example, on BTC, it seems that for the last years, on tuesday and thursday, enterring at the beginning of the daily candle, 01:00hours and exit at 00:00 hours, seems to give positive results giving the idea that can be converted in some sort of edge into our favor.
However dont take this entirelly for granted and conduct your own searches

Wunder Trend Reversal botWunder Trend Reversal bot
1. Wunder Trend Reversal Bot - this has only one goal to find a reversal of the trend.
2. The strategy determines, based on the specified value for the filter, a market reversal based on the price actions of the previous bars.
3. A short EMA is used to filter false signals after the reversal signal was received. Crossing the EMA and changing its direction confirms the trend change.
4. There are 2 ways to calculate stop loss and take profit. You can choose one of them:
- Classic stop loss and take profit in a fixed percentage
- ATR stop loss and take pro
5. ATR uses risk reward (R:R) to calculate take profit. The script calculates the risk-reward based on a certain stop loss level and uses it to calculate the take profit
6. A function for calculating risk on the portfolio (your deposit) has been added to the script. When this option is enabled, you get a calculation of the entry amount in dollars relative to your Stop Loss. In the settings, you can select the risk percentage on your portfolio. The loss will be calculated from the amount that will be displayed on the chart.
For example. Deposit - $1000, you set the risk to 1%. SL 5%. Entry volume will be $200. The loss at SL will be $10.10$ this is your 1% risk or 1% of the deposit.
Important! The risk per trade must be less than the Stop Loss value. If the risk is greater than SL, then you should use leverage.
The amount of funds entering the trade is calculated in dollars. This option was created if you want to send the dollar amount from Tradingview to the exchange. However, putting your volume in dollars you get the incorrect net profit and drawdown indication in the backtest results, as TradingView calculates the backtest volume in contracts.
To display the correct net profit and drawdown values in Tradingview Backtest results, use the ”Volume in contracts” option.

ETHUSDT Long-Short using EMA,OBV,ADX,LinearReg,DXY(No repaint)This script strategy is used to follow the trending EMA with a delta difference (Price-EMA) to know when to enter and with 5 variables mentioned below, stop loss is below EMA line all the time in long and above EMA line in short, is like a trailing stop after candle is closed. Hard stop is also placed to prevent big candles movements, also correlation between VIX and ETH when the correlation is <-0.2 the position can be opened.
Indicators used:
EMA , OBV , ADX , Linear regression and Dollar Index trending, Leverage is available for Long and Short positions.
LONG
When Price is above EMA and price-ema difference is smaller than "Long delta Price/MA"
OBV(4hrs) is above OBV-EMA(110)
Linear regression is strong
ADX is strong >50
DXY is trending down
SHORT
When Price is below EMA and ema-price difference is smaller than "Long delta Price/MA"
OBV(4hrs) is below OBV-EMA(110)
Linear regression is weak
ADX is weak <50
DXY is trending up
BINANCE:ETHUSDT 30 minutes Timeframe
[Sniper] SuperTrend + SSL Hybrid + QQE MODHi. I’m DuDu95.
**********************************************************************************
This is the script for the series called "Sniper".
*** What is "Sniper" Series? ***
"Sniper" series is the project that I’m going to start.
In "Sniper" Series, I’m going to "snipe and shoot" the youtuber’s strategy: to find out whether the youtuber’s video about strategy is "true or false".
Specifically, I’m going to do the things below.
1. Implement "Youtuber’s strategy" into pinescript code.
2. Then I will "backtest" and prove whether "the strategy really works" in the specific ticker (e.g. BTCUSDT) for the specific timeframe (e.g. 5m).
3. Based on the backtest result, I will rate and judge whether the youtube video is "true" or "false", and then rate the validity, reliability, robustness, of the strategy. (like a lie detector)
*** What is the purpose of this series? ***
1. To notify whether the strategy really works for the people who watched the youtube video.
2. To find and build my own scalping / day trading strategy that really works.
**********************************************************************************
*** Strategy Description ***
This strategy is from " QQE MOD + supertrend + ssl hybrid" by korean youtuber "코인투데이".
"코인투데이" claimed that this strategy will make you a lot of money in any crypto ticker in 15 minute timeframe.
### Entry Logic
1. Long Entry Logic
- Super Trend Short -> Long
- close > SSL Hybrid baseline upper k
- QQE MOD should be blue
2. Short Entry Logic
- Super Trend Long -> Short
- close < SSL Hybrid baseline lower k
- QQE MOD should be red
### Exit Logic
1. Long Exit Logic
- Super Trend Long -> Short
2. Short Entry Logic
- Super Trend Short -> Long
### StopLoss
1. Can Choose Stop Loss Type: Percent, ATR, Previous Low / High.
2. Can Chosse inputs of each Stop Loss Type.
### Take Profit
1. Can set Risk Reward Ratio for Take Profit.
- To simplify backtest, I erased all other options except RR Ratio.
- You can add Take Profit Logic by adding options in the code.
2. Can set Take Profit Quantity.
### Risk Manangement
1. Can choose whether to use Risk Manangement Logic.
- This controls the Quantity of the Entry.
- e.g. If you want to take 3% risk per trade and stop loss price is 6% below the long entry price,
then 50% of your equity will be used for trade.
2. Can choose How much risk you would take per trade.
### Plot
1. Added Labels to check the data of entry / exit positions.
2. Changed and Added color different from the original one. (green: #02732A, red: #D92332, yellow: #F2E313)
3. SuperTrend and SSL Hybrid Baseline is by default drawn on the chart.
4. If you check EMA filter, EMA would be drawn on the chart.
5. Should add QQE MOD indicator manually if you want to see QQE MOD.
**********************************************************************************
*** Rating: True or False?
### Rating:
→ 3.5 / 5 (0 = Trash, 1 = Bad, 2 = Not Good, 3 = Good, 4 = Great, 5 = Excellent)
### True or False?
→ True but not a 'perfect true'.
→ It did made a small profit on 15 minute timeframe. But it made a profit so it's true.
→ It worked well in longer timeframe. I think super trend works well so I will work on this further.
### Better Option?
→ Use this for Day trading or Swing Trading, not for Scalping. (Bigger Timeframe)
→ Although the result was not good at 15 minute timeframe, it was quite profitable in 1h, 2h, 4h, 8h, 1d timeframe.
→ Crypto like BTC, ETH was ok.
→ The result was better when I use EMA filter.
### Robust?
→ Yes. Although result was super bad in 5m timeframe, backtest result was "consistently" profitable on longer timeframe (when timeframe was bigger than 15m, it was profitable).
→ Also, MDD was good under risk management option on.
**********************************************************************************
*** Conclusion?
→ I recommend you not to use this on short timeframe as the youtuber first mentioned.
→ In my opinion, I can use on longer timeframe like 2h or bigger with EMA filter, stoploss and risk management.

[D] Dudu 95 Strategy Template ver.1.1.Hello Guys! Nice to meet you all!
This is my Second script after changing My Profile Name!
I updated my strategy template before - I added some filter conditions (EMA, ADX, DMI).
If there's something to update, I will update this script!
Thank you!
-----
I made this based on the open source strategies by jason5480, kevinmck100, myncrypto.
Thank you All!
### Filter
1. Can Choose whether to use filter.
2. Filters Based on ATR, EMA, ADX, and DMI are ready to use.
### StopLoss
1. Can Choose Stop Loss Type: Percent, ATR, Previous Low / High.
2. Can Chosse inputs of each Stop Loss Type.
### Take Profit
1. Can set Risk Reward Ratio for Take Profit.
- To simplify backtest, I erased all other options except RR Ratio.
- You can add Take Profit Logic by adding options in the code.
2. Can set Take Profit Quantity.
### Risk Manangement
1. Can choose whether to use Risk Manangement Logic.
- This controls the Quantity of the Entry.
- e.g. If you want to take 3% risk per trade and stop loss price is 6% below the long entry price,
then 50% of your equity will be used for trade.
2. Can choose How much risk you would take per trade.
### Plot
1. Added Labels to check the data of entry / exit positions.
2. Changed and Added color different from the original one. (green: #02732A, red: #D92332, yellow: #F2E313)

MA Simple Strategy with SL & TP & ATR FiltersHello Guys! Nice to meet you all!
This is my second script!
This Logic is trend following logic, This detects long & short trends by comparing the value of MAs.
This fits to the longer time frame.
### Long Condition
1. Compare 4 MAs (you can chose MA Type)
- Shortest MA (MA 1)
- Shorter MA (MA 2)
- Normal MA (MA 3)
- Longer MA (MA 4)
2. If MA 1 > MA 2 > MA 3 > MA 4, then Enter Long Position
- ‘The arrangement of MAs in descending orders’ is the proxy of the long trend.
### Short Condition
1. Compare 4 MAs (you can chose MA Type)
- Shortest MA (MA 1)
- Shorter MA (MA 2)
- Normal MA (MA 3)
- Longer MA (MA 4)
2. If MA 1 < MA 2 < MA 3 < MA 4, then Enter Short Position
- ‘The arrangement of MAs in ascending orders’ is the proxy of the short trend.
### Close Condition
1. When trend Changes
- When (MA 1 > MA 2 > MA 3 > MA 4) breaks or (MA 1 < MA 2 < MA 3 < MA 4) breaks.
2. When the price hits the stoploss
3. When the price hits the take profit level (basically 50% of qty will be closed)
### Etc
1. Trend filter (ATR should be bigger than SMA of ATR)
- If the volatility of price is to small (ATR), then there could be false signal. To filter this out, I used the condition ‘ATR should be larger than SMA of ATR’.
2. Stoploss
- Enabled Stoploss based on ATR, Percent, Risk-Reward Ratio,
- Enabled Trailing Stoploss.
3. Choose MA Type
- You can choose MA Type
+ Thanks for the stoploss template @jason5480

EMA + Bullish Engulfing Candle Pattern StrategyHello Guys! Nice to meet you all!
This is my first open source script!
### Long Condition
1. Bullish Engulfing Candle
2. No doge Candle
3. Present volume should be bigger than the previous volume (20%)
4. Trend filter (with 2 EMAs)
### Close Condition
1. When trend Changes
2. When Bearish Engulfing Candle appears
###
No stop loss and take profit.

Crypto_Troll_Turtle_StrategyTurtle Strategy for high marketcap cryptocurrencies
I'm glad to launch my strategy which is based on
moving averages / bollinger bands / RSI and volume
It's basically made for scalping with an interesting return over the last two years and a perspectively low drawdown
if you're interested in the strategy and you want to use it for futures trading you can contact me for a money & risk management rules that you can use and prevent you from a huge loss !! it's for free don't worry xD you can find my contact in the author's instructions' label
The optimal timeframe to use is 1H
I'll be trying to launch telegram signals for this strategy as soon as possible for the following pairs: BTCUSDT ETHUSDT BNBUSDT timeframe: 1H
I'm open to all reviews ! thanks !

Exponential Top and Bottom FinderThis is an indicator to identify possible tops and bottoms after exponential price surges and drops, it works best on ETH 1D, but you can also use it for bitcoin and altcoins.
It's based on stochastic first and second derivatives of a close moving average
customConfluenceSimplifiedThis indicator is intended to automatically search for confluence on a variety of indicators and conditions, highly customizable parameters, including Take profits, stop losses and classic indicator adjustments.
Best results in BTCUSDT 15m and 1H, but feel free to optimize it on any pair and timeframe. I don't recommend using it in non crypto assets.
Alerts are fully customizable too. You can put any alert() (buy/sell) to any pair.
I intended to maximize quality of signals over quantity. But anyway you can customize a lot of parameters to make it more frequent.
DM me for access.
WaveTecs StrategyWelcome to the Backtesting version of "WaveTecs Strategy", the indicator itself is an invite-only script called "WaveTecs Indicator" on TradingView.
WaveTecs Strategy
WaveTecs is a Strategy that combines Wave Trend Oscillator and verifies wave momentum by using RSI and Stochastic Oscillator Values.
What is Wave Trend?
One of the most effective indicators in identifying swings is the Wave Trend indicator. Wave Trend plots waves using highs and lows between an upper band and a lower band. It looks for the opening and closing of a new wave trend movement as well as overbought and oversold areas.
How does this modified strategy work?
By using RSI and Stochastic values we are able to verify Wave inflection points to determine if there is a suitable amount of momentum to ride the swing and make profitable trades. Positions are taken or closed based on the rising or falling momentum.
Each value input can be adjusted to best suit the type of market you are trading in. By using the strategy we can optimize these value inputs to yield greater net profits. I have found the RSI and Stochastic values hugely impact entries and exits regarding trades.
For Long conditions:
- RSI & Stochastic needs to be increasing and moving out of oversold conditions to show positive momentum.
- Falling momentum results in a sell signal. I have found RSI less than 65 to be sufficient in most markets however this can be adjusted at any time to yield different results depending on your comfort level.
For Short conditions:
- RSI & Stochastic needs to be decreasing and moving out of overbought conditions to show negative momentum.
Generally, Wave Trend Strategies only take trades that are outside of the bands. This strategy allows trades inside and outside of the bands, which can be selected under the input section title "Aggressive Trading". Trading in this mode is more frequent as signals are often. Due to volatility in crypto markets, I have defaulted the source for Wave Trend waves to be Open/High/Low/Close Average which yielded great results. High/Low/Close average works very well for all other securities, and can easily be adjusted through the drop-down menu inside the inputs.
Works for all types of markets. Parameters can be adjusted but not required as indicator values are standard in the industry.
The default parameters are set to those typically used in the markets currently. However, I have found that if you adjust you to adjust the parameters based on your asset and time frame desired you will yield different results.
----------------
For example:
----------------
ETHUSDT - 4 HR, results are shown below
Wave Trend Parameters:
Aggressive Trading: Yes
Channel Length: 12
Average Length: 24
Overbought Top: 90
Overbought Bottom: 75
Oversold Bottom: -90
Oversold Top: -55
Source: hlc3
Strategy Type:
Trade Direction: Long Only
Stochastic Inputs:
Stoch Length: 18
Smoother %K: 5
Moving Average %K: 4
%K Lower Limit: 21
%K Upper Limit: 80
%K Crossunder Sell: 80
Relative Strength Index Inputs:
RSI Lower Limit: 30
RSI Upper Limit: 70
RSI Sell Value: 68
==================
WaveTecs Features
==================
Profitable Trading Strategy;
Aggressive Trading feature for more trades, with earlier entries and exits;
Customizable inputs to fine-tune your trades;
Buy & Sell Alerts (Indicator Only);
Overlay indicator only to show alerts, WaveTecs Strategy needed to see Wave Trend;
Bot Integration through webhooks;
Two different strategy modes: Long Trades Only or Long & Short Trades
Adding new features & updates whenever possible.
Add both WaveTecs Indicator and WaveTecs Strategy to your chart. WaveTecs Indicator only plots Buy & Sell Alerts, whereas WaveTecs Strategy lets you see what the strategy is doing.

RSI & SMA Strategy By DenizIntroduction
It has always been a major challenge to detect the current market price in technical analysis . There are some basic but strong indicators that help us to estimate the next market action. Relative Strength Index and Simple Moving Average indicators were used in this strategy.
This strategy aims to detect the next market action with different calculations & usages of RSI and SMA indicators.
Strategy Features
As per the result of the calculation from RSI and SMA outputs the strategy will decide to go "Long" or "Short" if the directions are changed from long to short the trade will be closed and it's opening new trade as per to the new direction.
Apart from basic "take profit" and "stop" options there is an additional closing trade option named "Long/Short Bar Count". If the trade could not reach the target in a certain period, it will look for a quit with a 0 loss.
Advantages
Informative alarm messages.
High ratio of Profitable trade numbers.
Disadvantages
Less trade count.

Saper Aude [Alerts]Sapere Aude Strategy - Alerts
Trend based scalping strategy, to work on lower timeframes (15Minute - 1 Hour)
Calculations on ATR, strategy uses extra conditions to help filter out bad trades.
How to use the Indicator?
Simple as when green line shows below, that can be either a good entry point or a signal to start building limit orders on the plot.
I use the ATR as a trailing stop loss for exit.
vica versa for entering shorts. The strategy is only set up to take long positions though.
This is a great scalping strategy for bots in Ranging or up trending markets.
This scripts has 5 variations built within it which are fitted for certain coins & their timeframes
The coins included are
BTC /USDT 1 Hour
ETH/USDT 1 Hour
ADA/USDT 30 Minutes
DOGE/USDT 15 Minutes
LUNA/USDT/15 Minutes
You should find the preset alerts for these when you click "Add aler" on this indicator
You will see in the settings what default Stop losses I used
The script is written in Version 4
The strategy performs best on the Binance listings

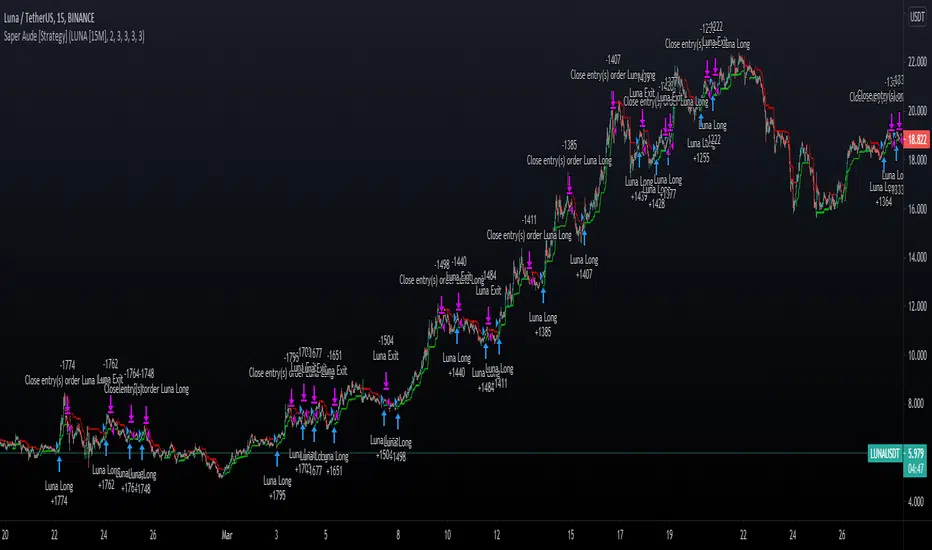
Saper Aude [Strategy]Sapere Aude Strategy
Trend based scalping strategy, to work on lower timeframes (15Minute - 1 Hour)
Calculations on ATR, strategy uses extra conditions to help filter out bad trades.
How to use the strategy?
Simple as when green line shows below, that can be either a good entry point or a signal to start building limit orders on the plot.
I use the ATR as a trailing stop loss for exit.
vica versa for entering shorts. The strategy is only set up to take long positions though.
This is a great scalping strategy for bots in Ranging or up trending markets.
This scripts has 5 variations built within it which are fitted for certain coins & their timeframes
The coins included are
BTC/USDT 1 Hour
ETH/USDT 1 Hour
ADA/USDT 30 Minutes
DOGE/USDT 15 Minutes
LUNA/USDT/15 Minutes
The Strategy backtest results includes Fess and there is NO Repaint! The script is written in Version 4
There is an option in the settings cog to choose from the 5 coins and their timeframes where they have been optimised
There is also an option to change the backtesting range
The stop Losses are also adjustable and listed under the settings
The strategy performs best on the Binance listings