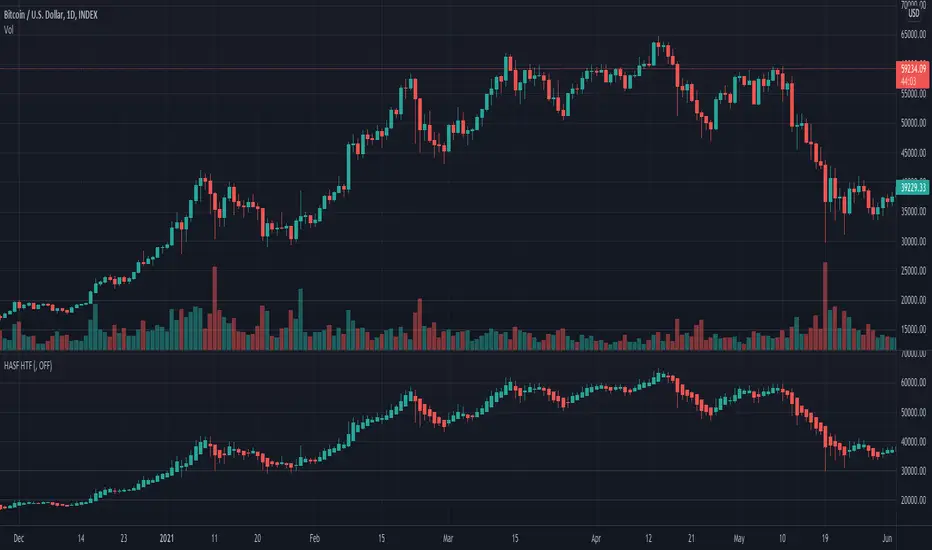
Heikin-Ashi Source Function HTFHigher TimeFrame using custom source function for toggling traditional Candle sources or Heikin-Ashi sources on a traditional Candles chart.
Thanks to PineCoders for rounding method: www.pinecoders.com
Thanks to @LucF and @RicardoSantos for their advice and enlightenment as always.
NOTICE: This is an example script and not meant to be used as an actual strategy. By using this script or any portion thereof, you acknowledge that you have read and understood that this is for research purposes only and I am not responsible for any financial losses you may incur by using this script!
Example
How To Show Vertical LinesExample of various methods to show dashed or solid vertical lines on chart based on using either session or time.
Credit for line method goes to midtownsk8rguy ->
Credit for plot method goes to PineCoders -> www.pinecoders.com
Special thanks to LucF, midtownsk8rguy, and PineCoders for permission to use their work.
NOTICE: This is an example script and not meant to be used as an actual strategy. By using this script or any portion thereof, you acknowledge that you have read and understood that this is for research purposes only and I am not responsible for any financial losses you may incur by using this script!

How To Limit n Round Trips Per Day [Alerts]Example how to limit the number of round trips per day. If entry condition is never met logic will force a round trip at end of day. Set chart to a timeframe that is lower than 1 Day period.
NOTICE: This is an example script and not meant to be used as an actual strategy. By using this script or any portion thereof, you acknowledge that you have read and understood that this is for research purposes only and I am not responsible for any financial losses you may incur by using this script!

Heikin-Ashi Source FunctionCustom source function for toggling traditional Candle sources or Heikin-Ashi sources on a traditional Candles chart.
Thanks to PineCoders for rounding method: www.pinecoders.com
Thanks to @LucF and @RicardoSantos for their advice and enlightenment as always.
NOTICE: This is an example script and not meant to be used as an actual strategy. By using this script or any portion thereof, you acknowledge that you have read and understood that this is for research purposes only and I am not responsible for any financial losses you may incur by using this script!
Example - How to create multiple level gridsExample on how to create custom grids with variable N lines/labels:

[RS]Example: function instantiationEXPERIMENTAL:
Practical example of how to create a shared function instance.

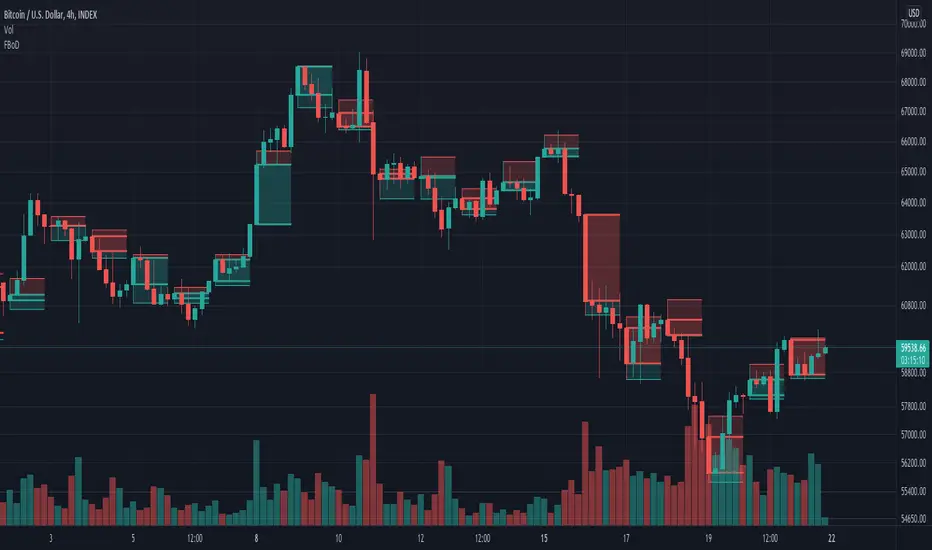
How to Overlay First LTF Bar of DayExample how to overlay the first lower timeframe bar of the day across the entire day. Set chart to a timeframe that is lower than 1 Day period. Also included option for coloring wick pressure of that bar.
NOTICE: This is an example script and not meant to be used as an actual strategy. By using this script or any portion thereof, you acknowledge that you have read and understood that this is for research purposes only and I am not responsible for any financial losses you may incur by using this script!
Growing or Waning Patterns [Alerts]Example how to color patterns of 3 bodies growing or waning by percentage with or without trend. Also included option for alert triggers. The yellow triangles on the chart denote where the alert triggers will fire.
• Choose Pattern Of Filter: shows bodies growing or waning or both.
• Sample Lengths Of AvgBar: number of recent bars to use for average size.
• BigBar Is Min% Of AvgBar: the minimum percent of average the big bar must be.
• MedBar Is Max% Of BigBar: the maximum percent of big bar the medium bar can be.
• SmlBar Is Max% Of MedBar: the maximum percent of medium bar the small bar can be.
• Repeat Pattern If n Bars: the number of bars to ignore repeat patterns, 1 allows all.
• Trending: on requires the growing or waning patterns to also be trending.
• GrayBars: colors non pattern bodies gray.
NOTICE: This is an example script and not meant to be used as an actual strategy. By using this script or any portion thereof, you acknowledge that you have read and understood that this is for research purposes only and I am not responsible for any financial losses you may incur by using this script!

How To Set Backtest Time Ranges
Example how to set the time range window to be backtested for both entries and exits. Additional examples are also included showing how to set the date range and toggle plot visibility.
By incorporating this code with your own strategy's logic, it will allow you to backtest various time windows.
Much gratitude to @LucF and @a.tesla2018 for help with including ':1234567' for time ranges on weekends. Thank you both!
NOTICE: This is an example script and not meant to be used as an actual strategy. By using this script or any portion thereof, you acknowledge that you have read and understood that this is for research purposes only and I am not responsible for any financial losses you may incur by using this script!

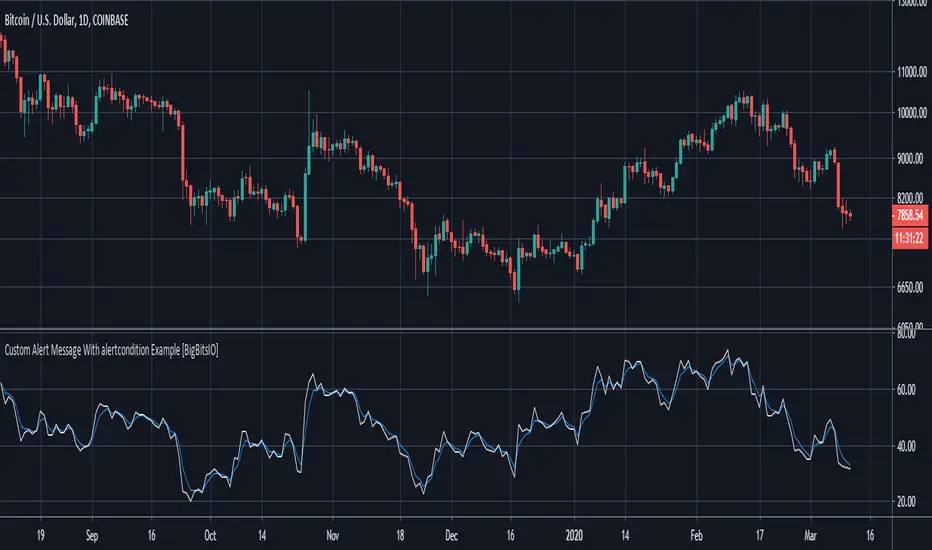
Custom Alert Message With alertcondition Example [BigBitsIO]This was a follower suggested script. This script shows an example of how to create a custom alert message using the alertcondition() function in pine.
Features:
- Well documented code with links to documentation for specific functions.
- Two alertconditions in a different order than the plots they reference to show the importance of plot IDs.
In order to actually get an alert with this script, you must create an alert through TradingView and reference this indicator and then reference the specific alert condition you want that alert to use.
For more information, contact me on social media or check YouTube for the associated video.
*** DISCLAIMER: For educational and entertainment purposes only. Nothing in this content should be interpreted as financial advice or a recommendation to buy or sell any sort of security or investment including all types of crypto. DYOR, TYOB. ***
Incremental Order size +This is an old and incomplete script that is being pulled up and dusted off as per request.
The sole purpose of this script was to provide code snippets allowing one to easily convert their own script/strategy to include incremental order sizes. More control over your pyramiding orders.
**It may repaint, and was not intended for trading but more as an attempt to provide examples for more control with pyramiding.

How To Color Prior BarsExample how to color the trigger bar of the condition and n-1 prior bars using only 1 barcolor() function.
Currently when offsets are used in barcolor(), bgcolor(), plot(), plotarrow(), plotchar(), or plotshape(), the offset only works with a simple (static) integer. If series (dynamic) integers are used instead, there is not an error, but the series values are ignored. Because of this limitation of offset being constrained to using only fixed offsets, the normal way to paint 3 Black Crows would be to use 3 barcolor() functions. Since there are a known number of bars to be painted in that scenario, this can be easily accomplished.
If a condition encompassed a variable length of n bars, then the number of barcolor() functions needed to use would be unknown. How to color the trigger bar of the condition and n-1 prior bars using only 1 barcolor() function? Dual examples below solves issue but requires n "future" bars, because of this it will not paint the most recent condition in realtime and may not be applicable for use in certain realtime situations. It paints similar in behavior to how a pivot does. Special thanks to LucF and RicardoSantos for illumination!
NOTICE: This is an example script and not meant to be used as an actual strategy. By using this script or any portion thereof, you acknowledge that you have read and understood that this is for research purposes only and I am not responsible for any financial losses you may incur by using this script!

Binary Options Arrows (example)An example of Binary Option Arrows (BOA) for candlestick patterns bearish and bullish harami.
With results as coloured background and an option to choose your expiration (one candle by default).
It's just an example for those who has their own strategy and wants to make nice arrows in their chart.
All you need to do is rewrite piece of script in lines 9:13 - feel free to ask me for any help.
Disclaimer: It's just an example how to script arrows for binary option trading, Poshtrader is not responsible for any loss of money by using this particular strategy.
Happy Trading

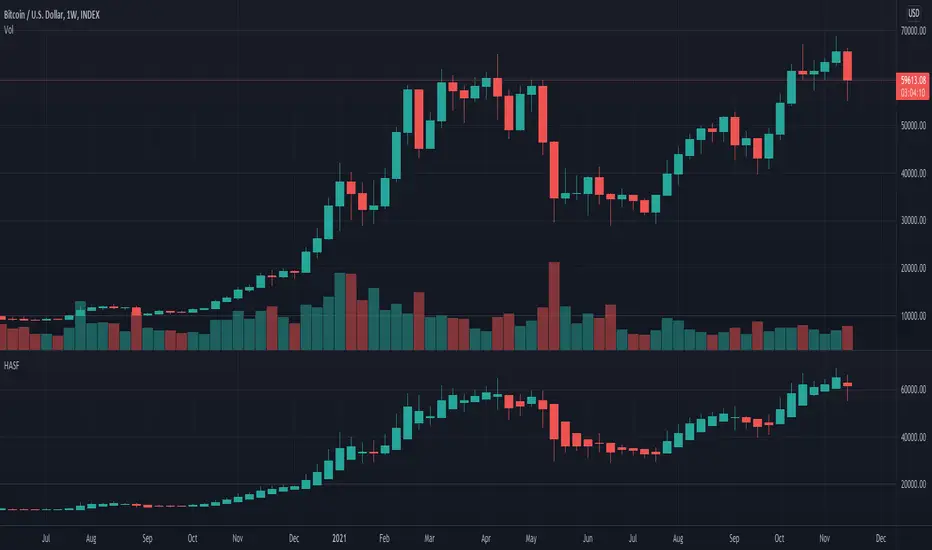
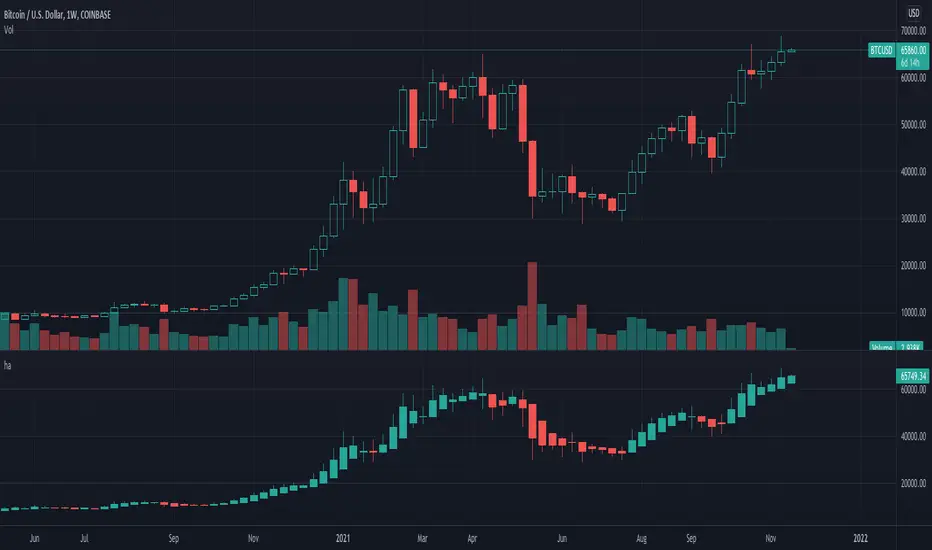
Heiken-Ashi CandlesSimple script to view Heiken-Ashi candles below a normal candles chart.
Could also be useful for using HA calcs in strategy scripts on normal candles chart for proper backtesting.
I adapted this to v4 from original v2 script by @samtsui. If you like please remember to give him a Thumbs Up for his original version! ->
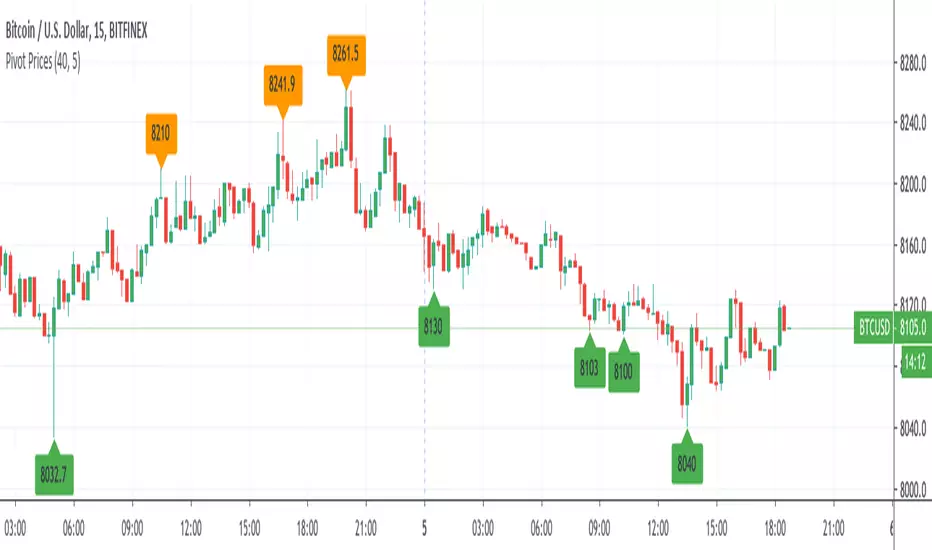
Pivot Prices - ExampleA simple example script showing how to use label.new() to plot pivot prices on the chart.
A full tutorial and commentary is available on the backtest-rookies website.
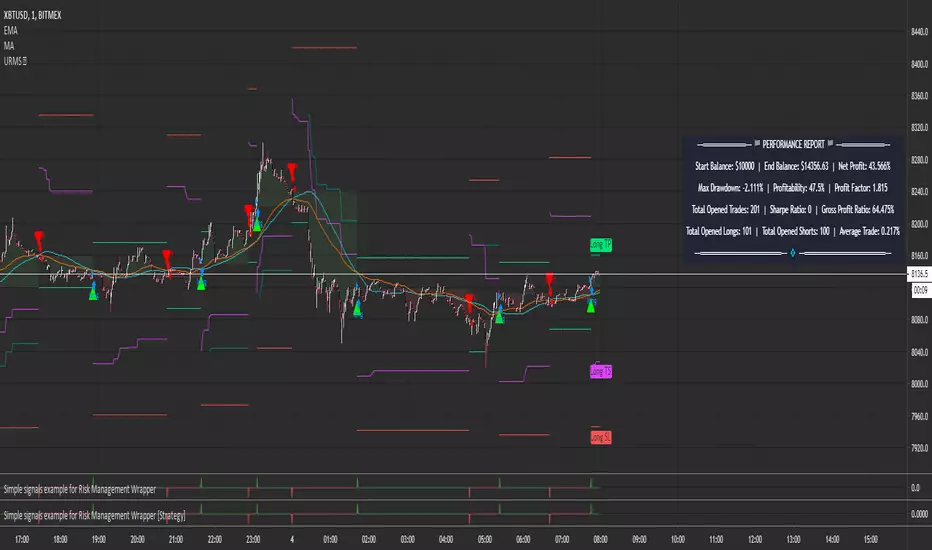
Simple signals example for Risk Management WrapperSimple signals example for Risk Management Wrapper
The unique part is that there is a single variable used for both Buy and Sell conditions.
Technically, a variable can have an infinity of values, so why not use that in our favour.
A value of -1 is used for the SELL alert condition , and a value of +1 is used for the BUY alert condition .
The Risk Management Wrapper can read them and act accordingly.
Any simple indicator on TradingView that gives Sell or Buy signals in a single variable should work.
More complex indicators that give multiple kinds of signals may not work due to TradingView limitations.
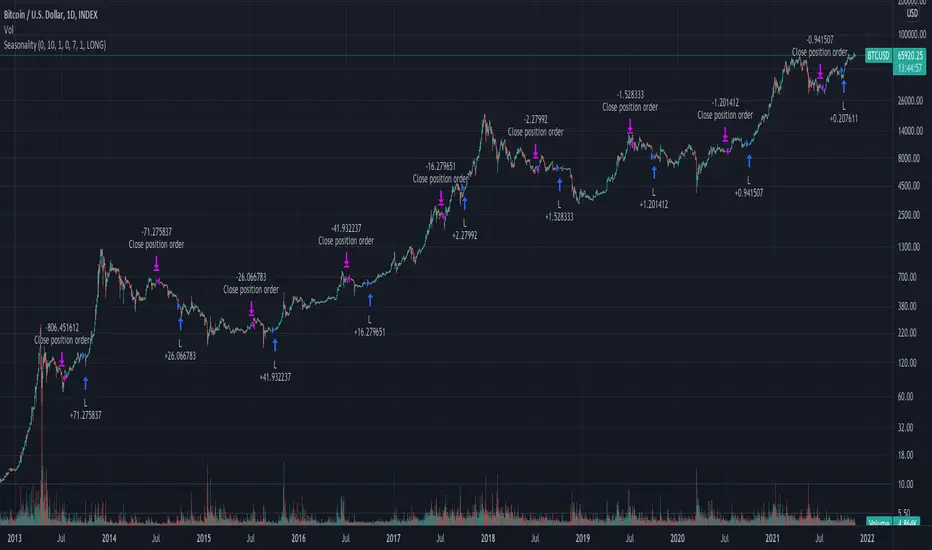
How To Set Trade Dates
Example how to backtest specific date(s) which can be useful for testing seasonality strategy ideas such as "Sell in May", etc.
If using Daily period with wild card dates it will not trade on 1st day of month. If market is closed will trade on next open day.
Works only with Daily or lower timeframes. When using on Daily timeframe set dates 1 day earlier to execute on desired dates.
Entering 0 in any of the date fields acts a wild card. Example -> Entry Year: 0 is "Every Year", Exit Month: 0 is "Every Month", etc.
NOTICE: This is an example script and not meant to be used as an actual strategy. By using this script or any portion thereof, you acknowledge that you have read and understood that this is for research purposes only and I am not responsible for any financial losses you may incur by using this script!
How To Use Dynamic ZonesExample of how to apply and use Dynamic Zones with an indicator by injecting it's source into my adaptation of the original idea by Leo Zamansky, Ph.D., and David Stendahl.
• Load your desired oscillating indicator on your chart (CCI, RSI, etc).
• Load my "How To Use Dynamic Zones" indicator on your chart.
• In the "How To Use Dynamic Zones" indicator settings choose your desired oscillating indicator as the Oscillator Source.
You will now have dynamic overbought and oversold levels. I have also included alerts which may be used to indicate when these conditions occur.
If desired you may repeat the above process by loading additional indicators along with additional copies of my indicator to use with each oscillator.
Oscillator Source: CLOSE uses your chosen indicator as a source or you may use price as a source
Sample Length: 70 uses number of previous values for evaluating
Hi is Above X% of Sample: 88 sets overbought zone
Lo is Below X% of Sample: 88 sets oversold zone
The simplest explanation of what these default settings are doing is that they take 70 previous values of your chosen indicator, then create an overbought level that is above 88% of those previous values and an oversold level that is below 88% of those previous values. As new bars form the levels are dynamically reevaluated and updated.
---
"This investing style follows a very simple form of logic: Enter the market only when an oscillator has moved far above or below traditional trading levels. However, these oscillator driven systems lack the ability to evolve with the market because they use fixed buy and sell zones. Traders typically use one set of buy and sell zones for a bull market and substantially different zones for a bear market. And therein lies the problem.
Once traders begin introducing their market opinions into trading equations, by changing the zones, they negate the system’s mechanical nature. The objective is to have a system automatically define its own buy and sell zones and thereby profitably trade in any market — bull or bear. Dynamic zones offer a solution to the problem of fixed buy and sell zones for any oscillator-driven system."
Reference: Stocks & Commodities V15:7 (306-310): Dynamic Zones by Leo Zamansky, Ph.D., and David Stendahl
---
NOTICE: This is an example script and not meant to be used as an actual strategy. By using this script or any portion thereof, you acknowledge that you have read and understood that this is for research purposes only and I am not responsible for any financial losses you may incur by using this script!

How To Auto Set Date RangeExample how to automatically set the date range window to be backtested from X days or weeks ago to present. Additional options are also included to manually set the date range or to show entire range available.
Normally when you change chart period it changes the number of days being backtested, which means as you increase the chart period (for example from 5min to 15min), you also increase the number of days traded. So you can not compare apples to apples for which period would yield best performance for your strategy.
By incorporating this code with your own strategy's logic (replacing buy and sell), it will allow you to compare results of different period backtests over the same duration of time.
Date Range: ALL uses entire history.
Date Range: DAYS uses number you set in # Days or Weeks
Date Range: WEEKS uses number you set in # Days or Weeks
Date Range: MANUAL uses manual dates you set in From and To fields
Much gratitude to @pinechrix for suggesting this improvement to me, and to @Gesundheit for pointing me in the right direction on the original example I published previously. Thank you both!
NOTICE: This is an example script and not meant to be used as an actual strategy. By using this script or any portion thereof, you acknowledge that you have read and understood that this is for research purposes only and I am not responsible for any financial losses you may incur by using this script!

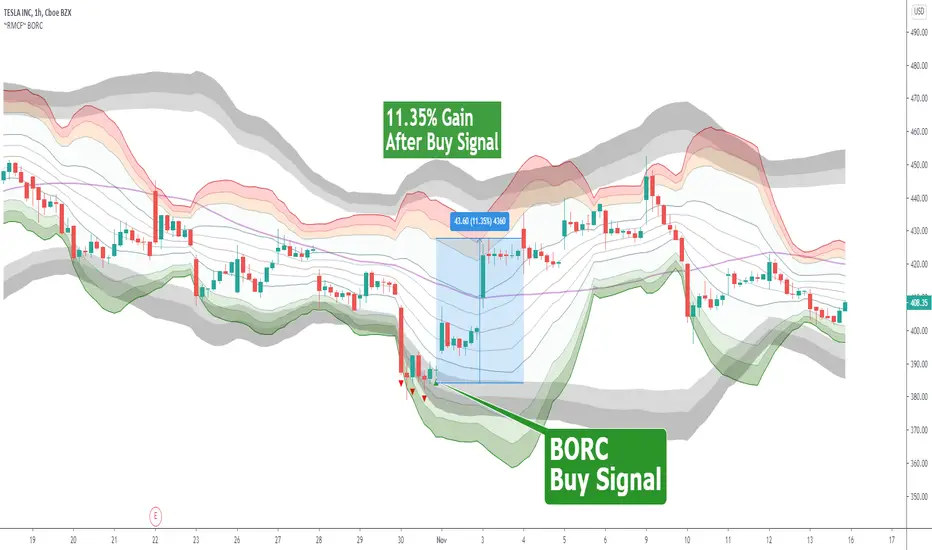
~RMCF~ BORC [with 17 page Annotated PDF with Example Charts]BORC, or Breakout Reversal Confirmation, is a signal based TV Indicator that analyzes multi-period price movements to determine when to enter in oversold and overbought tradeable assets. It works in any time frame and any type of security.
Green triangle means buy
Red Triangle means to get ready for the buy signal
$60 for lifetime access + complimentary PDF with example chart setups
DM @reaganmcf_ on twitter for more information and access
Pinescript v3 Compatibility Framework (v4 Migration Tool)Pinescript v3 Compatibility Framework (v4 Migration Tool)
This code makes most v3 scripts work in v4 with only a few minor changes below. Place the framework code before the first input statement.
You can totally delete all comments.
Pros:
- to port to v4 you only need to make a few simple changes, not affecting the core v3 code functionality
Cons:
- without #include - large redundant code block, but can be reduced as needed
- no proper syntax highlighting, intellisence for substitute constant names
Make the following changes in v3 script:
1. standard types can't be var names, color_transp can't be in a function, rename in v3 script:
color() => color.new()
bool => bool_
integer => integer_
float => float_
string => string_
2. init na requires explicit type declaration
float a = na
color col = na
3. persistent var init (optional):
s = na
s := nz(s , s) // or s := na(s ) ? 0 : s
// can be replaced with var s
var s = 0
s := s + 1
___________________________________________________________
Key features of Pinescript v4 (FYI):
1. optional explicit type declaration/conversion (you still can't cast series to int)
float s
2. persistent var modifier
var s
var float s
3. string series - persistent strings now can be used in cond and output to screen dynamically
4. label and line objects
- can be dynamically created, deleted, modified using get/set functions, moved before/after the current bar
- can be in if or a function unlike plot
- max limit: 50-55 label, and 50-55 line drawing objects in addition to already existing plots - both not affected by max plot outputs 64
- can only be used in the main chart
- can serve as the only output function - at least one is required: plot, barcolor, line, label etc.
- dynamic var values (including strings) can be output to screen as text using label.new and to_string
str = close >= open ? "up" : "down"
label.new(bar_index, high, text=str)
col = close >= open ? color.green : color.red
label.new(bar_index, na, "close = " + tostring(close), color=col, textcolor=color.white, style=label.style_labeldown, yloc=yloc.abovebar)
// create new objects, delete old ones
l = line.new(bar_index, high, bar_index , low , width=4)
line.delete(l )
// free object buffer by deleting old objects first, then create new ones
var l = na
line.delete(l)
l = line.new(bar_index, high, bar_index , low , width=4)

[RS]Function - Geometric Line Drawingsfunctions using the new line functions in V4 to draw multiple geometric shapes.

