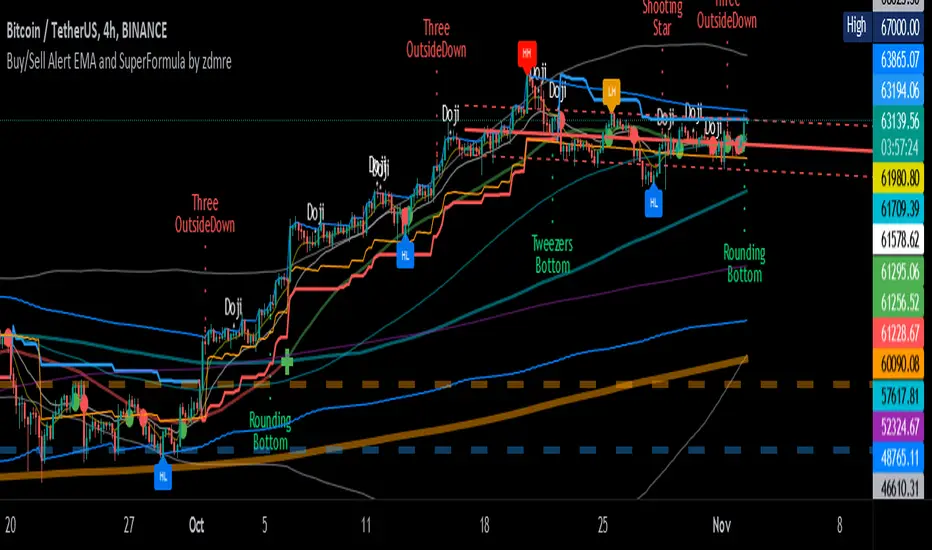
Buy/Sell Alert EMA with SuperFormula by zdmre*** Use it at your own risk
This indicator has 3 indicators and gives a buy/sell signal depending on the EMA.
3 indicators:
- Ichimoku
- Bollinger Band
- EMA
It also shows the value on the candle as a warning in the Buy and Sell signals. This value is calculated with a special formula I have created.
On the other hand Bollinger Band and Ichimoku Cloud are also included to check the accuracy of the signals.
For this indicator, I recommend a minimum of 4 hours chart.
Exponentialmovingaverages
Custom Moving Average (EMA & SMA)This script is a custom visualization tool to plot 4 Moving Averages (MA).
Each MA is customizable; you can:
enable (disable) the plot of MA;
select whether the MA is an EMA or an SMA;
the length;
the source (open, close, ...);
the offset value (default is 0).
Note:
The 1st MA is an EMA with length 50.
The others MAs are SMA with length 9, 30 and 100 respectively.

Multiple Time Frames Moving Averages (x3)This indicator is a set of 3 moving averages for which you can configure the type of the moving averages , their length , and of course the time frame . The moving averages you can choose from are:
- Simple Moving Average ( SMA )
- Exponential Moving Average ( EMA )
- Weighted Moving Average ( WMA )
- Running Moving Average (RMA)
- Hull Moving Average ( HMA )
- Volume Weighted Moving Average ( VWMA )
- Arnaud Legoux Moving Average ( ALMA )
The time-frames you can choose from - minutes (1, 3, 5, 15, 45), hours (1, 2, 3, 4, 12), days (1, 3), weekly or monthly .
Overall, it is a minimalistic indicator. No major improvements or trading logic like some of my other indicators, but I did make it slightly easier to use and visually appealing. The MAs' colors change from light to dark green/blue/red depending on the trend - bullish or bearish respectively. Initially, those were changing from green to red (based on direction) but it became a bit confusing when they started crossing each other. Anyway, feel free to change those colors to whatever you like.
If you have suggestions on how to improve this indicator or ideas about new ones, please drop me a line. Thanks.

Momentum Explosion 2CCI RSI"Momentum Explosion Template for Mobile Metatrader", that is a trading system trend momentum based on two Commodity Channel Index (CCI) , RSI and two Moving Averages.The trading signals are generated by the crossing of the moving averages confirmed by the agreement of the two CCIs and the RSI.
Two Moving averages Filtered by double CCI and RSI
Credit is to Dimitri Author Beejay (Forex Factory)
Trading Rules Momentum Explosion
Buy
EMA 8 crosses upward SMA 26.
CCI 34 periods > 0
CCI 55 periods > 0
RSI 26 > 48.
Sell
EMA 8 crosses downward SMA 26.
CCI 34 periods < 0
CCI 55 periods < 0
RSI 26 < 48.


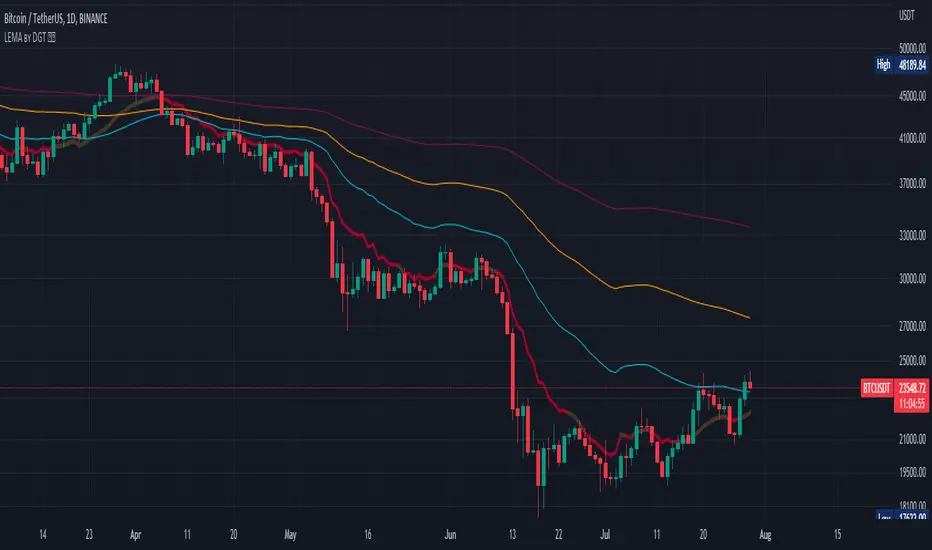
Logistic EMA w/ Signals by DGTLogistic Map Equation - The logistic map connects fluid convection, neuron firing, the Mandelbrot set and so much more.
This study is an attempt to apply Logistic Map Equation in Trading
Logistic Map Equation
Xn+1 = r * Xn * (1 - Xn)
Where,
r - growth rate
Xn - percentage of theoretical maximum of measured event (from 0 to 1)
(1 - Xn) - represents constraints of the environment, presents the idea of negative feedback
For trading the measured event will be the price of the instrument (price is commonly reffered as source in mathematicall forumlations),
hence
r - growth rate can be expressed as => change(source, length) / source, expressing r in such manner mades the equation dynamic with regards to the growth rate
Xn - percentage of theoretical maximum of the price for given duration can be expressed as => source / highest(length)
Putting pieces together we are ready to plot
Printed alone does not seem to provide much useful visualization for trading, in fact not easy to interpret especially when the market is an uptrend
What it has numerically,
Provides a ratio, where sudden changes are much more reflected thanks to negative feedback nature of the logistic equation.
As we know moving average indicators are lagging and the logistic map may fit here to reduce the lag
With this study you will find application of Logistic Map Equation with combination of Exponential Moving Average (EMA)
Logistic EMA (LEMA) and LEMA COLORS
one line with user defined periods of length, where the colors of the line will change automatically depending where the value is compared to 50-100-200 moving average
Multiple LEMAs : optional – three fixed lenght of 50-100-200 period lines
LEMA Signals
Various signals are added by using LEMA and applying some common market approaches. Use with caution and with conjunction of other indicators
Thanks to @allanster for the idea
A fascinating YouTube video explaining the logistic map - “This equation will change how you see the world (the logistic map)”
Disclaimer:
Trading success is all about following your trading strategy and the indicators should fit within your trading strategy, and not to be traded upon solely
The script is for informational and educational purposes only. Use of the script does not constitute professional and/or financial advice. You alone have the sole responsibility of evaluating the script output and risks associated with the use of the script. In exchange for using the script, you agree not to hold dgtrd TradingView user liable for any possible claim for damages arising from any decision you make based on use of the script
Lagged Donchian Channel + EMAThis strategy is based on a lagged 24 periods Donchian Channel and a 200 periods EMA .
The enter positions are calculated this way :
Bull entry
1. we wait for the close of a candle below the channel and it must be below the 200 EMA
2. the following candle must be a green one and close in the lagged channel
3. we put a long order at the close of the second candle, a stop loss at the low of last 3 candles and a x3 take profit
Bear entry
1. we wait for the close of a candle above the channel and it must be above the 200 EMA
2. the following candle must be a red one and close in the lagged channel
3. we put a short order at the close of the second candle, a stop loss at the high of last 3 candles and a x3 take profit
For both long or short positions :
If the order is not filled, it's cancelled if the price reach 50% of the TP or if the price reach the stop loss level
The position is closed if a new bear/bull condition appears in the other side of the position (if a bear appears when you're long and inversement)
Features :
Position calculator's included with leverage option
Labels of position can be plotted or not
Bull/Bear channels can be plotted with red and green filled
All parameters can be changed for backtesting
Better results have been got with defaults parameters on LTCUSDTPERP in H1 timeframe => profit factor of 2.84 with almost 100 positions.
Hope this strategy will be useful and it would be cool if I could get feedback, comments or better combinations of parameters !!
Don't hesitate to like and leave a comment ;)
@Mysteriown

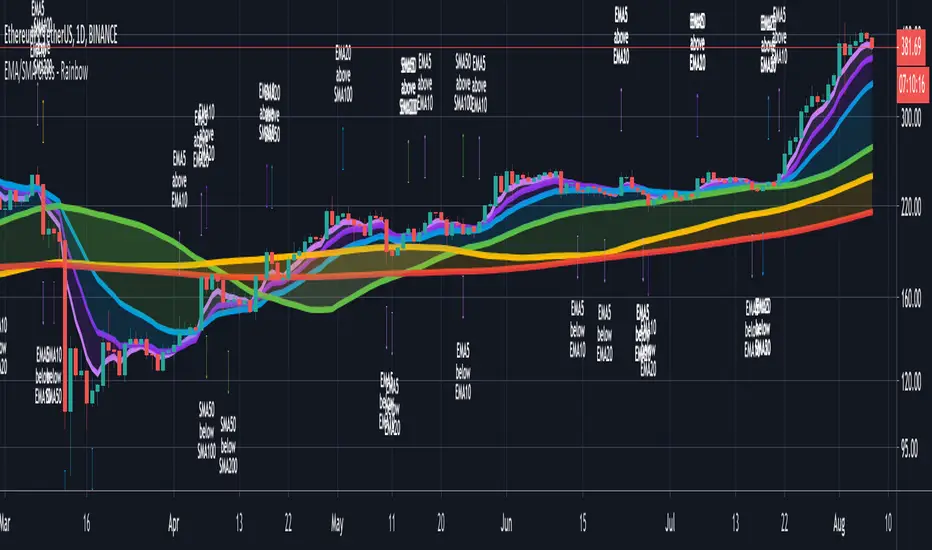
CryptoSignalScanner - Advanced Moving Averages - Cross & RainbowDESCRIPTION:
With this script you can plot 6 moving averages.
You can decide which Moving Average you want to show or hide.
For every plot you can decide to display the Simple Moving Average ( SMA ) or Exponential Moving Average ( EMA ).
It provides CrossOver and CrossUnder labels when loading the script. Those labels you can show or hide.
You have the possibility to show or hide the rainbow colors. This rainbow function gives you a clear view of the current trend.
HOW TO USE:
• When one Moving Average crosses above another Moving Average it signals an uptrend.
• When one Moving Average crosses below another Moving Average it signals a downtrend.
• The higher to length of the Moving Average the stronger the trend.
FEATURES:
• You can show/hide the preferred Moving Averages.
• You can set the length, type and source for every Moving Average.
• You can show/hide the rainbow colors.
• You can show/hide the CrossUp labels.
• You can show/hide the CrossDown labels.
• You can set alerts for every Moving Average.
• Etc...
DEFAULT SETTINGS:
• MA1 => EMA5
• MA2 => EMA10
• MA3 => EMA20
• MA4 => SMA50
• MA5 => SMA100
• MA6 => SMA200
Simple Moving Average vs. Exponential Moving Average:
SMA and EMA are calculated differently. The exponential moving average ( EMA ) focuses more on recent prices than on a long series of data points, as the simple moving average required.
The calculation makes the EMA quicker to react to price changes and the SMA react slower. That is the main difference between the two.
One is not necessarily better than another. It comes down to personal preference. Plot an EMA and SMA of the same length on a chart and see which one helps you make better trading decisions.
Moving Average Trading Strategies:
The first strategy is a price crossover, when the price crosses above or below a moving average, it signals a potential change in trend.
The second strategy applies when one moving averages crosses another moving average.
• When the short-term MA crosses above the long-term MA, it signals a buy signal.
• When the short-term MA crosses below the long-term MA, it signals a sell signal.
REMARKS:
• This advice is NOT financial advice.
• We do not provide personal investment advice and we are not a qualified licensed investment advisor.
• All information found here, including any ideas, opinions, views, predictions, forecasts, commentaries, suggestions, or stock picks, expressed or implied herein, are for informational, entertainment or educational purposes only and should not be construed as personal investment advice.
• We will not and cannot be held liable for any actions you take as a result of anything you read here.
• We only provide this information to help you make a better decision.
• While the information provided is believed to be accurate, it may include errors or inaccuracies.
If you like this script please donate some coins to share your appreciation.
Good Luck,
SEOCO
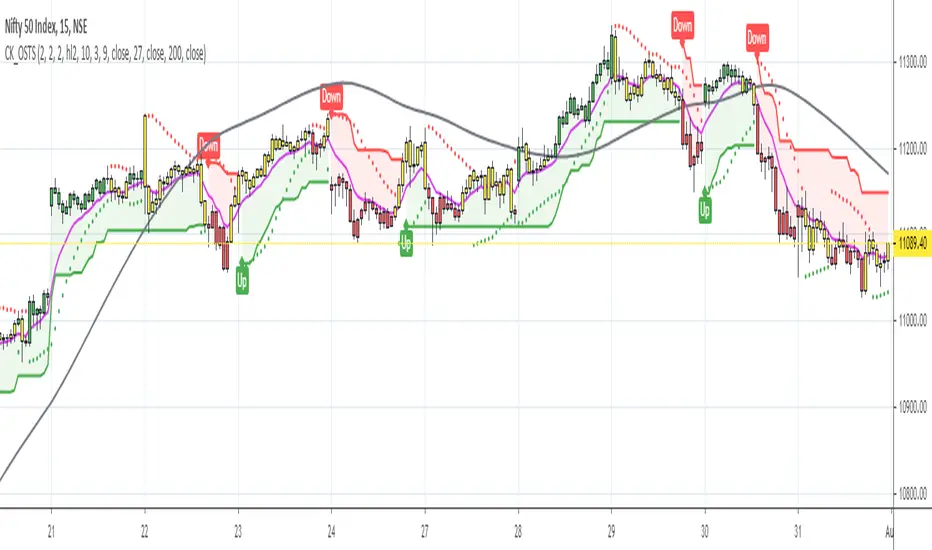
One-Stop Trading SetupOne-Stop Trading Setup:
This script designed to identify up, down, and sideways trends. 200 HMA, 9 EMA, PSAR, and ATR are used to identify the strength of any instrument.
Candle Colors - Simpler approach to follow:
Green color indicates for up side trade signals
Red color indicates for down side trade signals
Yellow color can be interpreted for stop, sideways, and counter trade trade signals
Multiple Trade Setups:
Green Zone - Trading green candles within green zone has better odds of long trades
Red Zone - Trading red candles within red zone has better odds of short trades
200 HMA - Candles above 200 HMA mostly for long trades. Candles below 200 HMA usually for short trades. But the zone also very important to consider
9 EMA - Cross over above 200 HMA in Green zone, look for long trades. Cross over below 200 HMA in red zone, look for short trades
PSAR - This can be used as potential initial warning sign. Also can be used to exit partial or wait for it goes to opposite side for taking trade decisions
Candle Above all - If Green candle and above all the indicators, then very good sign of long side. If red candle and below all indicators, then very good sign of short side.
Multiple Time Frame:
This works very well with any instrument and on any time frame. Always its better to do analysis on multi time frame before entry, exit, and trade execution. Back test it with this setup and also observe it on live market. That will give edge in taking trade decisions. All the best and happy trading.
Disclaimer:
This script and setup is written with the sole purpose of identifying the strength of any instrument. Interpretation, trade decisions, and changing inputs are up to each individual users/trades.
Trends & RangesTrends & Ranges uses EMA ATR bands as a SuperTrend indicator.
How to use:
This indicator can be used to give you a direction bias, with the added function to create ranges which often lead to reversals or flat trading periods. Trade the break-out or wait for pull backs in the direction of the trend.
I'm not great at explaining stuff and will probably make things only more complicated, so I won't bother for now,
but if you have a question on how the script works I will gladly give it a try.
The option "Flexible Trends" will disable the min/max function (trailing or non trailing).
Flexible Trends enabled:
Flexible Trends disabled:
Settings are not optimized for any asset or time frame, you will have to do that for yourself. Feel free to share them in the comments.
Thanks for showing interest, enjoy and good luck! :)

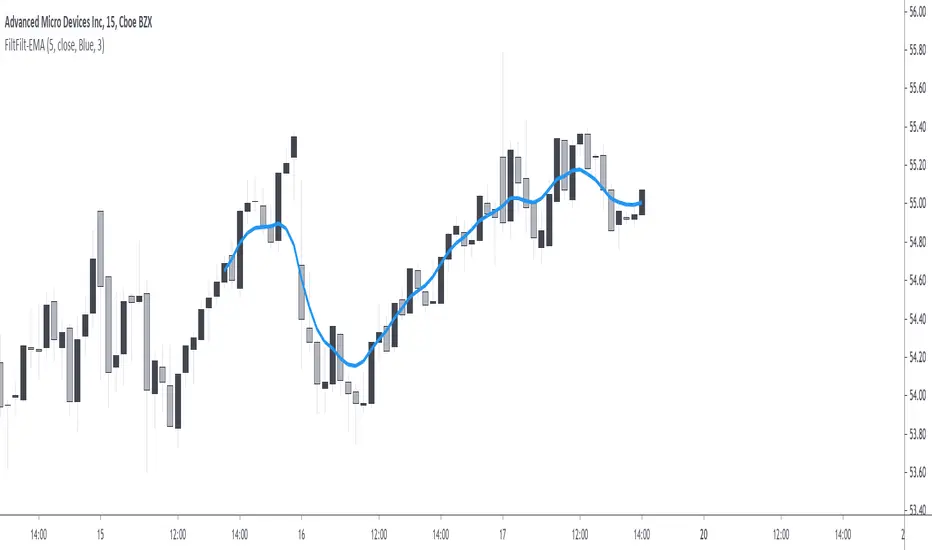
Forward Backward EMA [Repaint]Perform forward-backward filtering using exponential averaging, thus providing a zero-phase exponential moving average. The output repaint and cannot be used as input for other indicators.
Settings
Length : moving average period
Src : data input of the moving average
Plot Color : the color of the displayed plot
Line Width : width of the plotted line
Usages
The main usage of moving averages is to provide an estimate of the underlying trend in the price by removing higher term variations from it. Non-causal (repainting) indicators are limited to offline applications, as such, they are most useful for summary analyses, note that it is still possible to infer from the output of repainting indicators, however since past outputs are subject to changes, it is extremely difficult to track the effectiveness of such indicators, and in online applications they only track the price, making them equally useful for predictive applications than following the direction of an individual candle.
Non-causal filters can be useful in order to have a better view of symbols with a relatively uninformative evolution.
Details
Causal filters have lag, this is the cost of using past observations as inputs, the more past observations you use, the more lag you will obtain (assuming these past observations have non-zero weights). There are various solutions to reduce the lag of a moving average, the most simple one relying on giving higher weights to more recent observations, another one relies on introducing gain in the filter passband, that is amplifying certain variations in the input signal while attenuating/removing higher term ones, finally, we can use adaptive moving averages to avoid excessive lag.
All these previous solutions can be used causally, but they are far from being perfect, as the lag reduction is often done at the cost of smoothness, if we were to keep the original smoothness of the filter while having no lag we would need to use non-causal solutions. The most common solution is to directly use future values as inputs, such moving averages are called "two-sided" moving averages since they use past values as input (left side) as well as future input values (right side), this is equivalent to shifting the results of a moving average backward.
The advantages of two-sided moving averages is that they conserve the original amplitude response of the moving average, however, it won't be possible to compute the most recent values of the moving average (since we won't have access to future values at a certain point), an alternative method heavily used in digital signal processing is forward-backward filtering.
The method consists of applying a filter forward in time, then we apply it once again backward. In order for you to have an easier understanding of this process think about applying a moving average normally starting at time t = 0 , then apply that moving average once again using the previous results as input but start from t = N-1 , that is from the most recent point, and proceed backward, plotting the result from left to right until you get back to t = 0 .
From this, it follows that forward-backward filtering applies a filter twice, the resulting filter is thus a two-passes filter, this results in an even smoother output (more precisely the filter amplitude response is squared).
Forward-backward filtering can be done in Pinescript by using the function "line.new" inside a loop, an exponential moving average is applied forward first, then once again backward inside the loop, "line.new" is used to plot the results backward.
Notes
It is important to note that forward-backward filtering is a repainting process, all the results of the indicator you see on the chart are subject to change over time. Since the method make use of line.new you will have around only 54 visible observations, with the impossibility of using them as input for other indicators. If you see indicators in the future with the same characteristics be aware that they will repaint.
Never purchase/rent filters that appear as having no lag, they are either repainting or the results are coming from a lucky shot or from an overfitted model, it is impossible to make both zero-lag and causal moving averages with pinescript, if you have doubt don't test your luck, better safe than sorry.
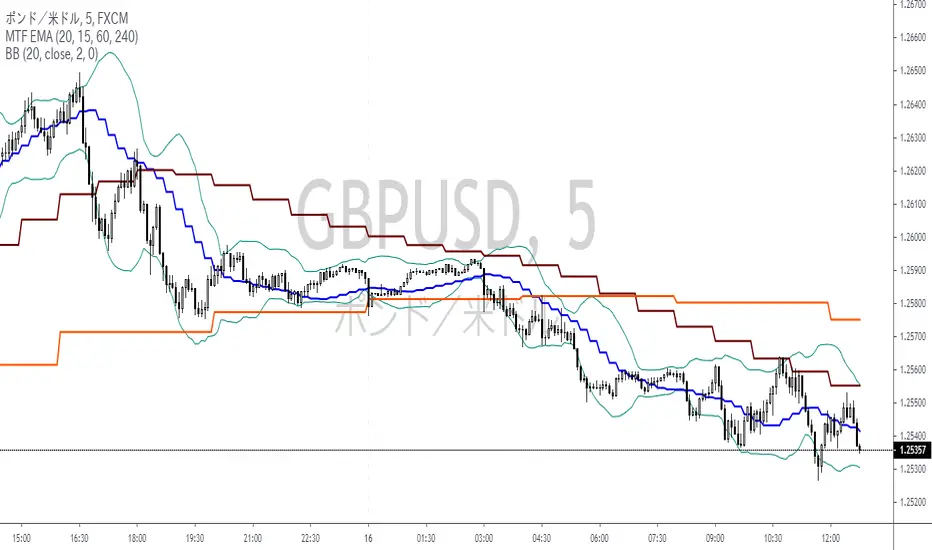
MTF EMA 3Set(Multi Time Frame Exponential Moving Averages 3 Set)Multi Time Frame Exponential Moving Averages 3 Set
One indicator displays the three types of moving averages of the top bar.
It can be used for environment recognition.
It is easy to repel when the 4 hour foot and the pivot overlap.
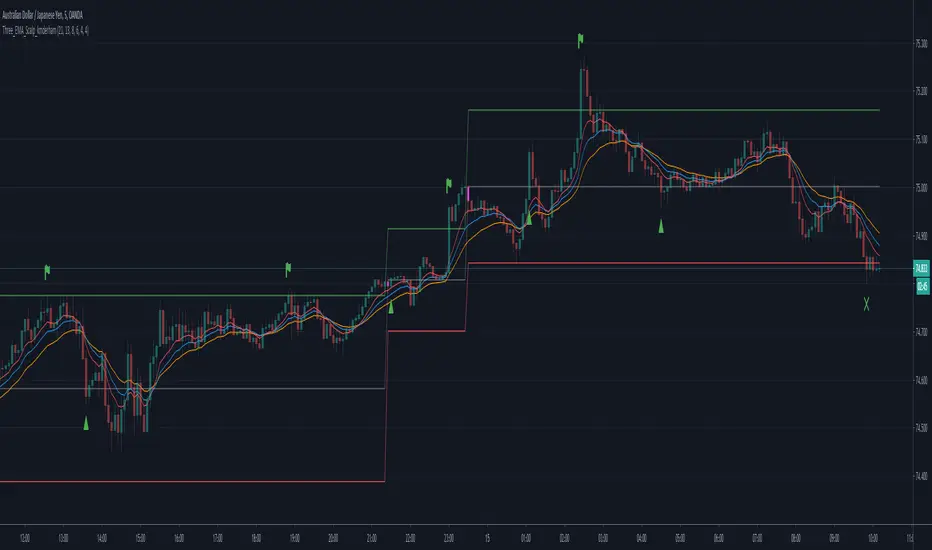
Three EMA Scalp Signals by kmderhamThis script looks for a set up condition where 5 consecutive candles have broken away from the fast EMA (set to 8 by default) followed by a "trigger" candle that crosses back over the fast EMA but not the medium EMA (set to 13 by default). It then determines the entry point based on the bar high or low (not tail or wick) depending on direction of the trend. Once the entry point is crossed, we can enter the position. Win or loss is determined whether the lower or upper levels are crossed (as per trend). After the position is won or lost and if the entry level is re-crossed before a new set up condition is found then a new entry signal is given.
Please note that this should really be used in conjunction with a higher timeframe "Anchor" chart with a fast and a slow EMA so setups and positions should should correspond to the trend of the higher timeframe chart. This was designed for a 5 minute timeframe and a 60 minute anchor chart.
[CP]6 EMA Multi Timeframe InceptionA collection of 6 EMAs.
Each EMA can be attached to a different timeframe and have a different offset.
Great for building strategies that combine EMAs from different timeframes.

Multiple Moving Averages in one indicatorHi, that's an "enhanced" version of this indicator gently published by myfye13 .
Here's the things I've implemented:
Up to 8 moving averages
Now you can set the source of each moving average
Now you can set the length of each moving average.
Hope this will help especially those who have an indicato limit or who use multiple emas and don't wan't to see a stack of indicators list on the upper left of the chart.

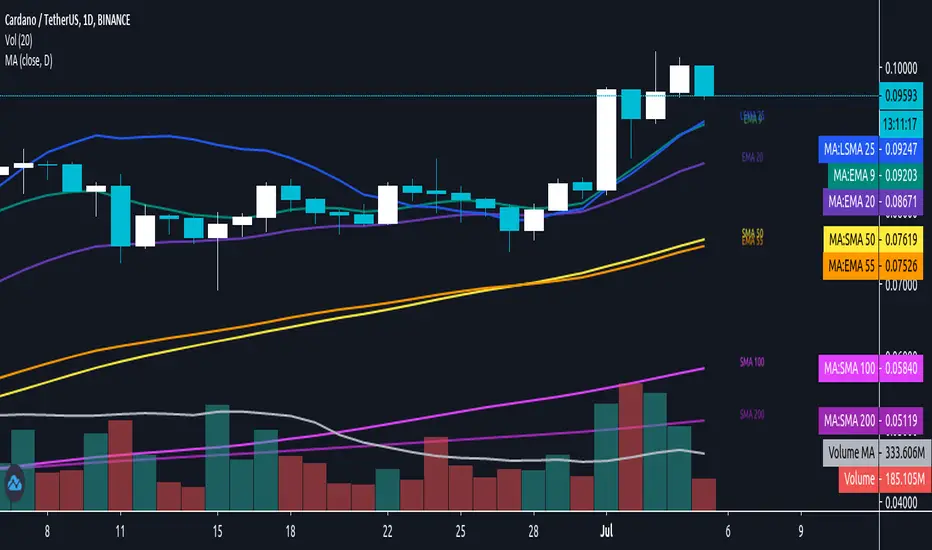
Daily/MTF Moving Averages (EMA20, EMA55, SMA50, SMA100, SMA200)Script to plot common daily/alternative timeframe moving averages on when viewing securities at other resolutions.
There's lots of different MA scripts out there, but I couldn't find one that just represented the standard support/resistance indicators that were typical for my markets. So, this is the DIY. :)
EMA 20/100/200 alwaysThis script will always show the EMA 20/100/200 daily values across any time frame chart (e.g. showing daily 20 EMA while viewing the 5 minute chart)

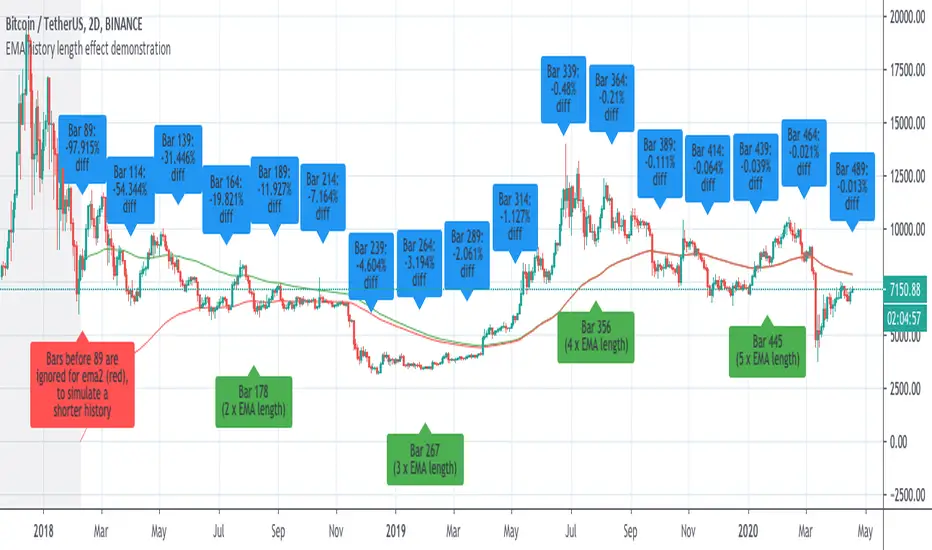
Demonstration of how history length affects all EMA valuesI saw some discussion of this so I whipped up an example to prove the that effect of history length on EMA values is pronounced, even for bars much further than the EMA length from the first candle of the chart.
This chart has two 89-bar EMAs of the close: a green one and a red one. However, for the red one, the first 89 bars of the graph are considered to have a close of "0", which is exactly whatTradingView's EMA calculation uses for bars before the start of the graph.
This is because unlike other moving averages, which reference the price of previous bars, the EMA references the EMA of previous bars. Therefore, bars closer to the beginning of the chart, where TradingView can't calculate an EMA because there is no previous EMA and therefore uses 0, will return substantially different values for the EMA() function that the same cart would with more history.
The further a bar is back in history, the less influence it has. However, every single historical bar has some influence on the EMA of every later bar.
To allow you to see this for yourself, this script contains the following inputs which you can change to see the effect:
-EMA period (default 89)
-Number of bars to ignore for EMA2 (default 89)
-decimal precision to show differences in. By making this a large number you can see that, although the effects diminish, history length affects all EMA values for the char.
-label spacing (increase this if you have a long history and run into TV's 50-label limit)
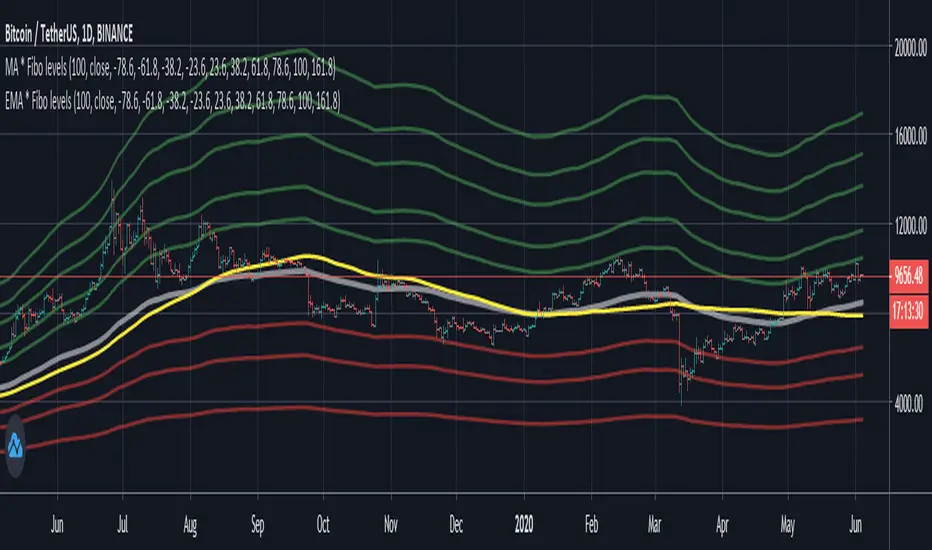
EMA / Fibonacci / Bollinger Indicator for Market Sniper SuiteHello all,
this script was created to be used in conjunction with Market Sniper - Trading/Scalping Suite . It was put together to make instrument analysis faster and less convoluted.
It includes
9 Fibonacci Exponential moving averages + 2 Simple moving averages
Auto Fibonacci levels - Tradingviews Auto Fib Retracement - with some modifications
Bollinger Bands - To faster spot squeeze momentum

Multi Timeframe Moving Averages This indicator allows you to view a moving average ( EMA or SMA ) of your choosing on other time frames than what you are currently on. You just need to edit the script and plot MAs that you want to see.
This is based on awesome work of @millerrh at but now instead of read inputs, I just plot what I desire with correct labels.
The reason I used that was that I wanted to see daily MAs in 15min, 5min and 1min charts.
To use the script add to your chart and edit it, you can add or remove any MA you want at end of file and then add it to your chart again.
The code off course is open source.

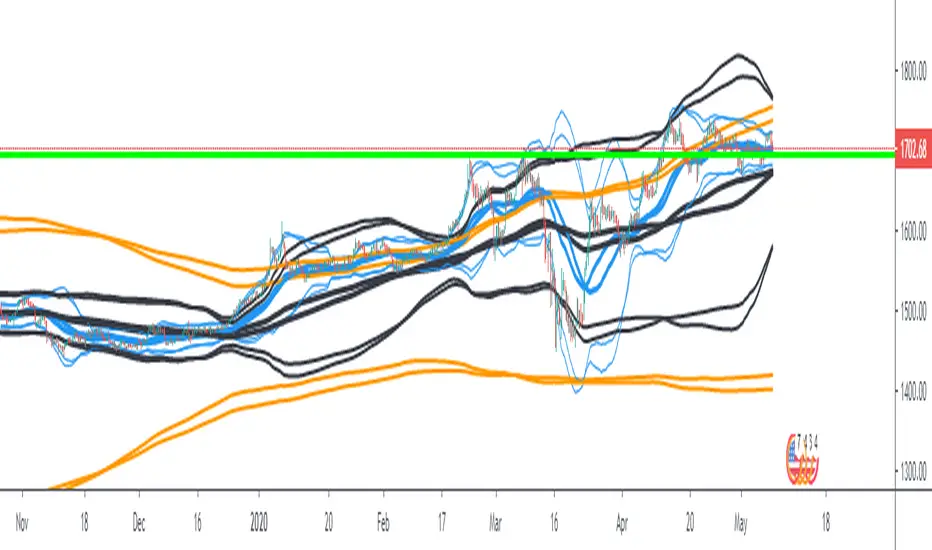
Bollinger Bands Ema 50,200,800EMAs converted to Bollinger Bands The bands are 50, 200 and 800 period, forming a strategy and having clear trends and stronger supports and resistances (when the lines converge the area is stronger).
EMA Noodle Fan by KviateqJust a very simple EMA fan using Highs and Lows instead of closes. This results in these "EMA noodles". Price very rarely reacts rigidly to a close price of an EMA, sometimes it comes short, other times it overshoots it. Hence the idea behind the noodles.
You can obviously change the lengths of each of the noodle, I chose these lengths for a M5 timeframe and these represent your typical 50, 100 and 200 EMAs on higher timeframes.
