Portfolio and Risk Management: Gold Based Net Growth CoefficientHello, if our topic is stocks, whatever signal we get, we have to divide and reduce the risk.
Apart from the risk, we need inflation-free figures to detect a clear growth.
Gold is one of the most successful tools to beat inflation in this regard in the historical context.
When the economy is good, we have to beat both commodities and inflation.
For this purpose, I found it appropriate to develop a net growth factor free from gold growth.
Investors need several stocks with a high growth rate and as much risk-free as possible.
Personally, I think that the science of portfolio and risk management will last a lifetime and should continue.
I think this subject is a research and development subject.(R & D)
My research and publications on this matter will continue publicly.
I wish everyone a good day.
NOTE : You can determine the return in the time period you want to look back by adjusting the period in the rate you want from the menu.
The standard value is 200 days. (1 year)
Gold

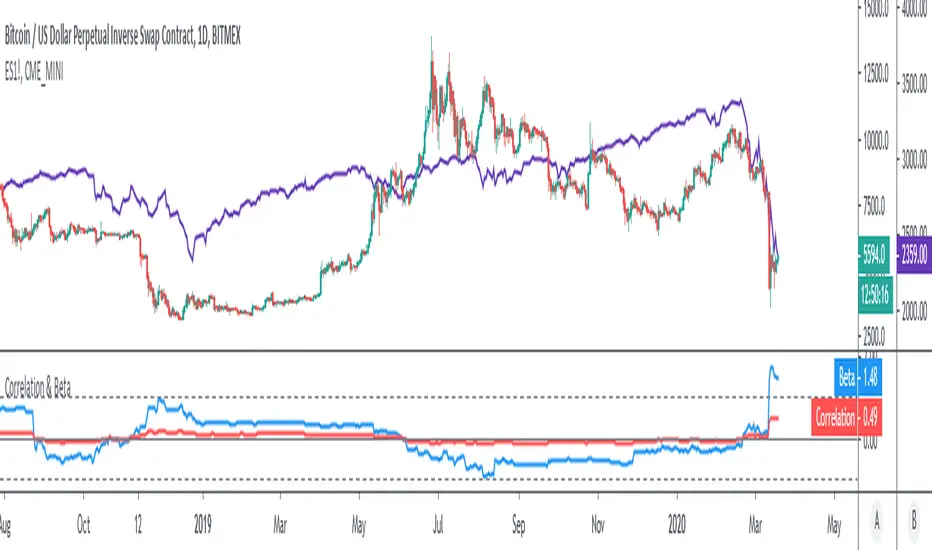
Correlation & BetaDisplay the correlation coefficient and/or Beta of an asset to a specified market.
Options to:
- Specify market (S&P500 futures by default)
- Display one or other metrics
- Modify assessment period (200 bars by default)
- Calculate on price, returns or log-returns
Yield Curve Inversion MonitorIdentifies when the US Treasury Yield Curve inverts (2 and 10 year bond rates).
When they ‘invert’ long-term bonds have a lower interest rate than short-term bonds. In other words, the bond market is pricing in a significant drop in future interest rates (which might be caused by the US Fed fighting off a recession in the future).
In the last 50 years, every time the US treasury yield curve inverted a recession followed within 3 years. On average the S&P500 gained 19.1% following the inversion and peaked 13 months later. In other words, as far as investors are concerned, the recession began roughly one year later.
However, once the market peaks, it then drops 37.6% on average, wiping out all those gains and more.
...Looks like 2020 is shaping up to be another prime example.

Gold-Stocks RatioA historic risk-off flag.
When the Gold-Stocks Ratio is above the 200 week moving average, investors may fair better holding gold and avoiding equities, as was the case for the last 20 years.

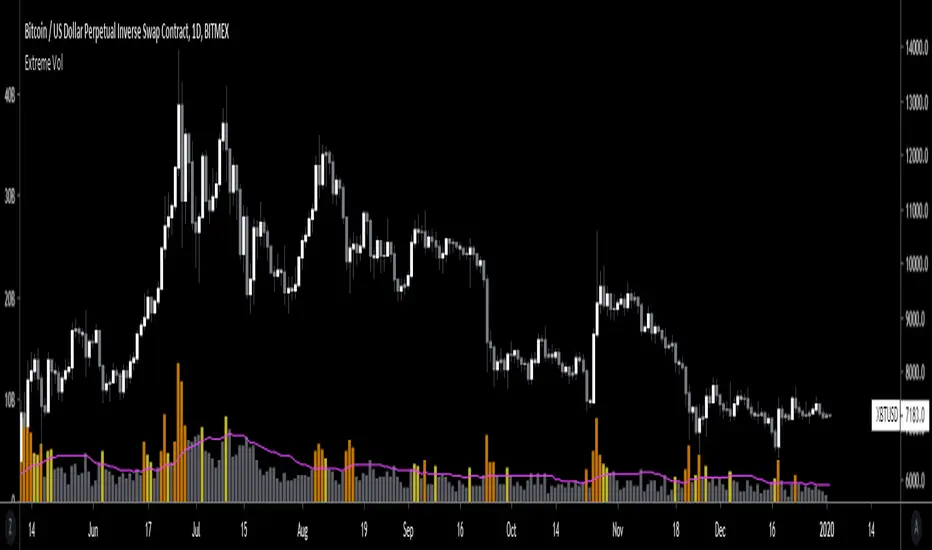
Extreme VolumeThis indicator colors volume bars that are significantly higher volume than the vol moving average ( SMA ). Utilizes two multiplier that can be adjusted by user. Defaults are that the indicator colors volume bars yellow if 20% higher than average, and orange if over 50% higher than average.
Reason why i created this indicator is i typically don't care about volume unless it is significantly higher than average. I find extreme volume useful for confirmation of a breakout, etc. This is why the rest of the volume bars are gray, they are still available for reference, but I dont pay much attention until volume is higher than average.
Also, when you load this indicator it will be in its own pane below the chart. To try and figure out how to add it to same pane as the chart was a huge pain in the ass. Once you figure it out it is pretty easy. I'll try to explain below...
Next to the indicator name you have the following options ... Hide, Settings, Show Source Code{}, Delete(X), and More (3 dots)
1) Click on "More" (3 dots)
2) Click on "Move To" then chose "Existing Pane Above"
3) Volume will likely be too large. Volume scale should be on left side, use your mouse to adjust volume smaller
4) Volume will likely be in the middle of your chart, click on it and drag it down.
ZoneBand (@Mido_yuiya)Bollinger band is converted to EMA , and support and resistance bands are made into regions

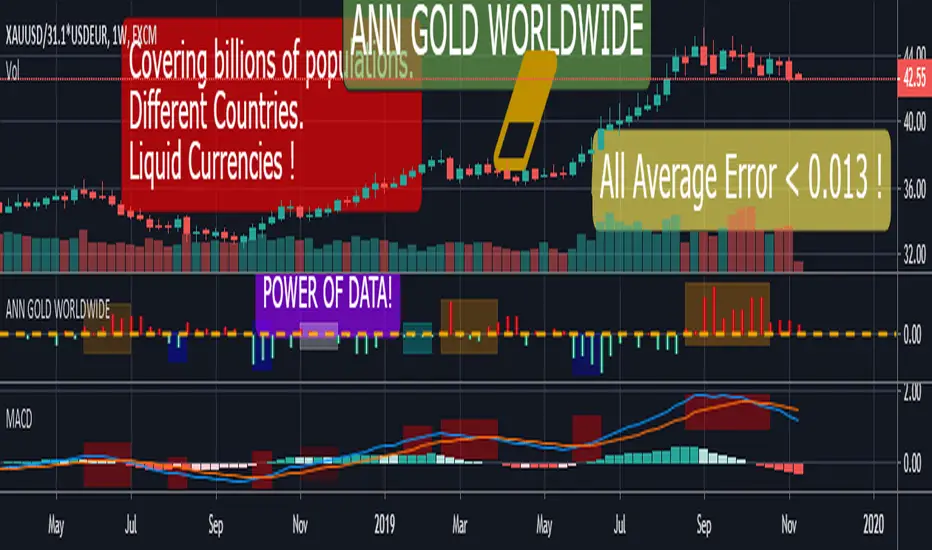
ANN GOLD WORLDWIDE This script consists of converting the value of 1 gram and / or 1 ounce of gold according to the national currencies into a system with artificial neural networks.
Why did I feel such a need?
Even though the printed products in the market are digitally circulated, only precious metals are available in full or near full.
Silver is difficult to carry because you have to buy too much because the unit price is low.
Platinum is very difficult to find and used in industry.
Gold is both practical and has less volatile movements, even more balanced than dollars, to preserve the value of money.
Uncertainty and tensions benefit gold.
Obviously this is my own opinion and is not worth the investment advice:
If there is to be an economic crisis, it is obvious that the dollar will rise against the emerging currencies, but I expect a crisis where gold and the dollar will rise together.
The world has been on a mercantilist line more than ever!
Spot gold can be bought from goldsmiths and banks.
I think this command will benefit people everywhere but in economies that are subject to developing currencies.
Now we can look at the details:
All you have to do is load the appropriate chart and select it from the menu.
Thus, the system will adjust itself to that instrument.
MENU and Tickers :
"GOLD" : XAUUSD or GC1! or GOLD (Average error = 0.0128)
"GOLDSILVER" : XAUXAG or GOLDSILVER (Gold Silver Ratio ) ( Average error : 0.01 )
"GOLD CZK " : XAUUSD/USDCZK ( 1 Ounce Gold Czech Koruna) ( Average error = 0.010879 )
"GOLD NZD " : XAUUSD/USDNZD ( 1 Ounce Gold New Zealand Dollar ) (Average error = 0.010736 )
"GOLD EURO" : XAUUSD/USDEUR ( 1 Ounce Gold Euro) ( Average error = 0.010000 )
"GOLD HUF " : XAUUSD/USDHUF ( 1 Ounce Gold Hungarian Forint ) ( Average error = 0.010000 )
"GOLD INR " : XAUUSD/USDINR (1 Ounce Gold Indian Rupee ) (Average error = 0.010458 )
"GOLD DKK" : XAUUSD/USDDKK (1 Ounce Gold Danish Krone) (Average error = 0.010671 )
"GOLD CHF" : XAUUSD/USDCHF (1 Ounce Gold Swiss Franc ) (Average error = 0.010967 )
"GOLD CNH" : XAUUSD/USDCNH(1 Ounce Gold Offshore RMB) (Average error = 0.012017 )
"GOLD MXN" : XAUUSD/USDMXN(1 Ounce Gold Mexican Peso) (Average error = 0.010000 )
"GOLD PLN" : XAUUSD/USDPLN (1 Ounce Gold Polish Zloty ) (Average error = 0.010173 )
"GOLD ZAR" : XAUUSD/USDZAR (1 Ounce Gold South African Rand (Average error = 0.010484 )
"GOLD NOK" : XAUUSD/USDNOK (1 Ounce Gold Norwegian Krone ) (Average error = 0.010842 )
"GOLD TRY" : XAUUSD/USDTRY (1 Ounce Gold Turkish Lira ) (Average error = 0.010000 )
"GOLD THB" : XAUUSD/USDTHB (1 Ounce Gold Thai Baht ) (Average error = 0.011747 )
Important note : XAUUSD/USDCUR = 1 Ounce Gold , XAUUSD/31.1*USDCUR = 1 gram Gold (CUR = Currency )
If you want to physically hold it, look gram value, because as far as I know, all goldsmiths and jewelleries in the world are selling gram gold.
I think that this command is the most useful and the concrete one that I have ever written.
I end my sentences with this anonymous proverb :
"Even if gold falls into the mud, it's still gold ! "
ANN MACD GOLD (XAUUSD)This script aims to establish artificial neural networks with gold data.(4H)
Details :
Learning cycles: 329818
Training error: 0.012767 ( Slightly above average but negligible.)
Input columns: 19
Output columns: 1
Excluded columns: 0
Training example rows: 300
Validating example rows: 0
Querying example rows: 0
Excluded example rows: 0
Duplicated example rows: 0
Input nodes connected: 19
Hidden layer 1 nodes: 5
Hidden layer 2 nodes: 1
Hidden layer 3 nodes: 0
Output nodes: 1
Learning rate: 0.7000
Momentum: 0.8000
Target error: 0.0100
NOTE : Alarms added.
And special thanks to dear wroclai for his great effort.
Deep learning series will continue . Stay tuned! Regards.


Bollinger Band Strategy (Basic) Version 1 This strategy is for learning purposes only. Pay special attention to these strategies on longer aggregation periods (like 1 hr chart or more). Don't expect accurate results when you set a limit to 10 cents above your entry to be accurate. For example if you set the chart to 1 day, the price may move down and hit a stop 10 times then tag your limit. If this doesn't make sense, just don't use strategies here. Learn more first. That being said, I don't have specific recommendations for each aggregation period, backtesting isn't always perfect.
Now then, this strategy can be used as the traditional BB method by setting the "Stop" and "Limit Out" to like 10000, check "Reversal Entry" and uncheck "Limit Time of Day" This will keep the strategy running just reverse your position when price crosses outside each band.
INPUTS:
Length - length of WMA that I used for mean of Bollinger Band (this may suppose to be SMA, too bad)
Source - O-H-L-C basis for WMA
Deviation - normal Standard deviation that would be set when using Bollinger Band
Trailing stop check box - your stop value will be either a hard stop or trailing stop for an exit
Stop - the stop value - remember you can set this really high and it won't stop out
Limit Out - the limit value for exit
Reversal Entry check box - This changes each entry from a reversal (traditional idea of BB) to enter a trend trade - hopefully version 2 will have choice to trend one direction and reversal in the other.
Limit Time of Day - Especially when trading futures, you may want to only trade a specific time of day, when this box is checked, you can set the entry times below, exit will still only occur based on limit/stop or a flip entry order (the opposite entry condition is met)
Tips:
when I don't know a thing about a price range, like gold. I can set the limit out to 10000 and play with a trailing stop to get a better idea of what is even possible before tuning further.

Asset Correlation Tool v3, improvedI found this useful tool among the indicators but it wasn't doing the correlation study correctly.
Everything in markets, with only a few exceptions, are rising in value over time and therefore trended to time. The simplest method I found is to use link relative or first difference detrending, before calculating a correlation between assets.
I also updated it to include more assets, to use the latest Cryptocap indices like BTC.D/ETH.D/TOTAL2 and the top 100 crypto index CIX100. I improved the colour schemes, too
Included in the source code are some other ideas like the FRED:M1 and FRED:M2 (only on daily charts), the Yuan/Yen/EUR/USD, etc. There's lots of scope for correlating unrelated markets.
I'll keep updating it as I use it to find truly correlated assets. Some kind of signal line of known correlations, to subtract from the baseline fuzz of market activity.
Any improvements are most welcome; I'm a novice at best at statistics and build on others' work.
- mabonyi

Gold trading strategy with trend follow and TDOW conceptMy strategy uses a combination of three indicators MACD Stochastic RSI.
The Idea is to buy when ( MACD > Signal and RSI > 50 and Stochastic > 50) occures at the same time
This strategy works well on stocks and cryptos especially during market breaking up after consolidation
The best results are on Daily charts , so its NOT a scalping strategy. But it can work also on 1H charts.
The strategy does not have any stops and profit targets, so we can take all the market can give us at the moment.
The exit point only when MACD goes under Signal
In addition I've decided to add a stop loss and "Trading day of week" concept
So the results are much more stable and we get more profit !
So, use it, trade it.
If it will help you to imprive your trading results, please donate me
BTC: 12kd1F8buWisUBdq27BBwRkUvzW7Ey3og5

Gap finder (gold minds)This tool highlights where gaps happens and outlines in the chart where the gap zones are. If there is a gap up there is a green line, a gap down it is red. The gap zone is highlighted in blue. You can choose the size of your gap with the input menu to the desired size. Feel free to ask comment below. Made for the Gold Minds group

Dhananjay Volatility stop strategy v1.0
Sharing one more strategy after getting good feedback on my earlier published strategy.
This is simple volatility stop strategy where in we are using VStop as entry and exit point.
Again smart traders can add MA to decide the trend and can avoid trading in opposite direction of trend which will help them to minimize loss making trades.
There are more than 1 parameters which traders can use/change to make this strategy compatible to their instrument.
To understand what is VStop use google.com :-)
Looking forward to receiving feedback from all of you.

Ichimoku Cloud strategy for gold marketThis strategy is based on main ichimoku features (Leading span , conversion line and base line) compared to cloud conditions.
I indicated all possibilities in this indicator and strategy decision is based on crossing factors of each main line through two other line confirmations.

Tick Tick BoomThis is THE tick tick boom method from the GOLD MINDS group!
When we enter a trade the line changes color.
If your charts are not in UTC time then you can adjust the UTC offset time. If your charts are in UTC-9 then set this to 9, if you are in UTC+1 set this to -1, if your charts are un UTC then set this to 0.
I noticed daily pivots, support, and resistance levels are pretty useful targets here. Uncheck the box if you would like to see the levels.
Many thanks to Dimitri Wallace!

15 Minute Gold Trend-Following StrategyThis is the main strategy that I will be forward testing on demo for a month or two, then making it an EA in MetaTrader4
You can see the code for yourself this time, all the strategy is, is a crossover of various moving averages.
Commission included, $10,000 account.
Results over the past 3 months, beginning in January 2017.

Gold/Silver 30m Only Strategy Buy/Sell SignalsIn my free time I felt like coding this strategy, and after backtesting it, it appears that the 30m time frame is the most profitable.
I only have been working on it for gold, but it should work similarly for silver as well.
This includes no pyramiding, and with pyramiding orders of 5, this strategy is upwards of 100% profitable.
Buy order - when price is above the 162 day EMA and RSI is less than 35
Sell order - when price is below the 162 day EMA and RSI is greater than 65
I will probably be adjusting it to increase the profitability and %success rate.

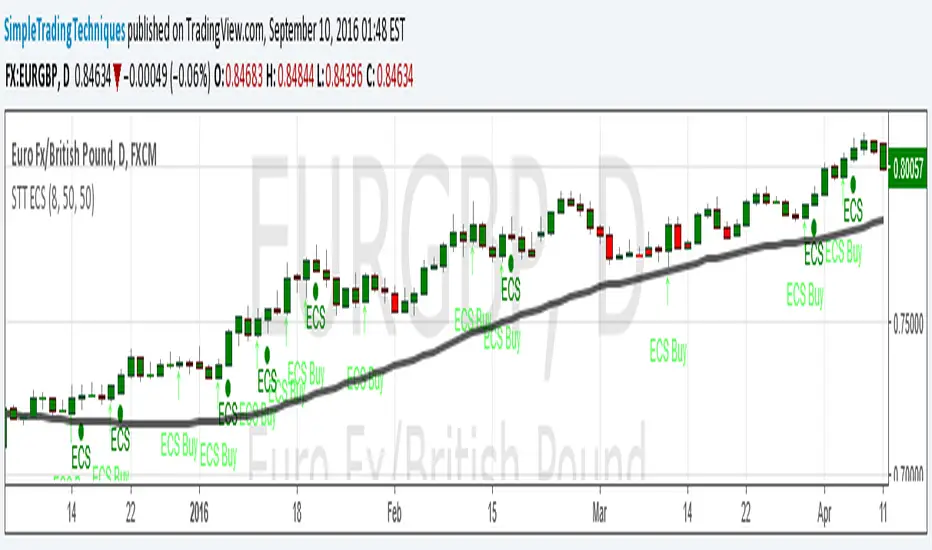
ENGULFING CANDLESTICK STRATEGY(i) Arrow represent trade setup
(ii) Circle represent triggering of the trade
--------------------------------------------------------------------
1. Where to place stop loss?
2. Where to exit the trade?
3. How to protect gains in your trade?
4. How to apply money management rule?
5. How to trade gap opening?
Correlation of chart symbol to different Index-ETF-currencyScript plots correlation of chart symbol to a variety of indexes, symbols, equities. ** Original idea was to find Bitcoin correlation, which I did not. Built in correlations are: Nikie, DAX, SPY, AAPL, US Dollar, Gold, EURUSD, USDCNY, EEM, QQQ, XLK, XLF, USDJPY, EURGBP

GoldFinger .007Goldfinger.
He's the man, the man with the midas touch.
A spider's touch.
Such a cold finger.
Beckons you to enter his web of sin
But don't go in.

[RS]Gold to Custom Currency V0Request for: sankar2389
Gold conversion from dollar to INR and to grams.