Adaptive Multi-TF Indicator Table with Presets giua64📌 Script Name:
Adaptive Multi-Timeframe Indicator Table with Presets — giua64
📄 Description:
This script displays an adaptive multi-timeframe dashboard that summarizes the signals of three key technical indicators:
Moving Averages (MAs), Relative Strength Index (RSI), and MACD.
It provides a fast and visually intuitive overview of market conditions across five timeframes (5m, 15m, 30m, 1h, 4h), helping traders quickly identify potential directional biases (e.g., bullish, bearish, or neutral) based on either predefined presets or fully manual settings.
🧰 Preset Configurations:
You can choose between four trading styles, each with optimized indicator parameters:
Scalping
• MAs: 5 / 10 (Fast), 20 / 50 (Slow)
• RSI: 7 periods | Overbought: 70 | Oversold: 30
• MACD: 5 / 13 | Signal: 3
Intraday
• MAs: 9 / 21 (Fast), 50 / 100 (Slow)
• RSI: 14 periods | Overbought: 60 | Oversold: 40
• MACD: 12 / 26 | Signal: 9
Swing
• MAs: 10 / 20 (Fast), 50 / 200 (Slow)
• RSI: 14 periods | Overbought: 65 | Oversold: 35
• MACD: 12 / 26 | Signal: 9
Manual
• Full custom control over all indicator settings.
🛠️ All settings can be customized manually from the options panel, including the exact MA periods, RSI thresholds, and MACD structure.
🧠 How It Works:
For each timeframe, the script evaluates:
MA crossover status (two levels):
The first symbol refers to the crossover of the fast MAs
The second symbol refers to the crossover of the slow MAs
🟢 = Bullish crossover
🔴 = Bearish crossover
➖ = Flat or no clear signal
RSI Direction:
↑ = RSI above upper threshold (potential overbought)
↓ = RSI below lower threshold (potential oversold)
→ = RSI in neutral range
MACD Line vs Signal Line:
↑ = MACD line is above signal line (bullish)
↓ = MACD line is below signal line (bearish)
→ = Flat or neutral signal
Each signal is assigned a numerical score. These are aggregated per timeframe to compute a combined score that reflects the directional bias for that specific time window.
🧠 Adaptive Logic by Asset:
This script is designed to be universally compatible across all asset types — including forex, crypto, stocks, indices, and commodities.
Thanks to its multi-timeframe nature and flexible indicator presets, the script automatically adjusts its behavior based on the asset selected, ensuring relevant analysis without requiring manual recalibration.
🧾 Summary Table Output:
At the bottom of the dashboard, a combined sentiment is displayed for:
3TF → 5m, 15m, 30m
4TF → Adds 1h
5TF → Adds 4h
Each row shows:
Signal → LONG / SHORT / NEUTRAL
Confidence (%) → Based on score aggregation and signal consistency
📌 Customization Options:
Table Position: Left, Right, or Center
Text Size: Small, Normal, or Large
Full Manual Configuration: All MA, RSI, and MACD parameters can be adjusted as needed
⚠️ Disclaimer:
This script is for educational and analytical purposes only.
It does not constitute financial advice or guarantee any trading results.
Always do your own research and apply responsible risk management.
Gold

ATR Volatility giua64ATR Volatility giua64 – Smart Signal + VIX Filter
📘 Script Explanation (in English)
Title: ATR Volatility giua64 – Smart Signal + VIX Filter
This script analyzes market volatility using the Average True Range (ATR) and compares it to its moving average to determine whether volatility is HIGH, MEDIUM, or LOW.
It includes:
✅ Custom or preset configurations for different asset classes (Forex, Indices, Gold, etc.).
✅ An optional external volatility index input (like the VIX) to refine directional bias.
✅ A directional signal (LONG, SHORT, FLAT) based on ATR strength, direction, and external volatility conditions.
✅ A clean visual table showing key values such as ATR, ATR average, ATR %, VIX level, current range, extended range, and final signal.
This tool is ideal for traders looking to:
Monitor the intensity of price movements
Filter trading strategies based on volatility conditions
Identify momentum acceleration or exhaustion
⚙️ Settings Guide
Here’s a breakdown of the user inputs:
🔹 ATR Settings
Setting Description
ATR Length Number of periods for ATR calculation (default: 14)
ATR Smoothing Type of moving average used (RMA, SMA, EMA, WMA)
ATR Average Length Period for the ATR moving average baseline
🔹 Asset Class Preset
Choose between:
Manual – Define your own point multiplier and thresholds
Forex (Pips) – Auto-set for FX markets (high precision)
Indices (0.1 Points) – For index instruments like DAX or S&P
Gold (USD) – Preset suitable for XAU/USD
If Manual is selected, configure:
Setting Description
Points Multiplier Multiplies raw price ranges into useful units (e.g., 10 for Gold)
Low Volatility Threshold Threshold to define "LOW" volatility
High Volatility Threshold Threshold to define "HIGH" volatility
🔹 Extended Range and VIX
Setting Description
Timeframe for Extended High/Low Used to compare larger price ranges (e.g., Daily or Weekly)
External Volatility Index (VIX) Symbol for a volatility index like "VIX" or "EUVI"
Low VIX Threshold Below this level, VIX is considered "low" (default: 20)
High VIX Threshold Above this level, VIX is considered "high" (default: 30)
🔹 Table Display
Setting Description
Table Position Where the visual table appears on the chart (e.g., bottom_center, top_left)
Show ATR Line on Chart Whether to display the ATR line directly on the chart
✅ Signal Logic Summary
The script determines the final signal based on:
ATR being above or below its average
ATR rising or falling
ATR percentage being significant (>2%)
VIX being high or low
Conditions Signal
ATR rising + high volatility + low VIX LONG
ATR falling + high volatility + high VIX SHORT
ATR flat or low volatility or low %ATR FLAT

Thai Gold BahtIndicator Name: Thai Gold Baht
Short Title: Thai Gold Baht
Purpose
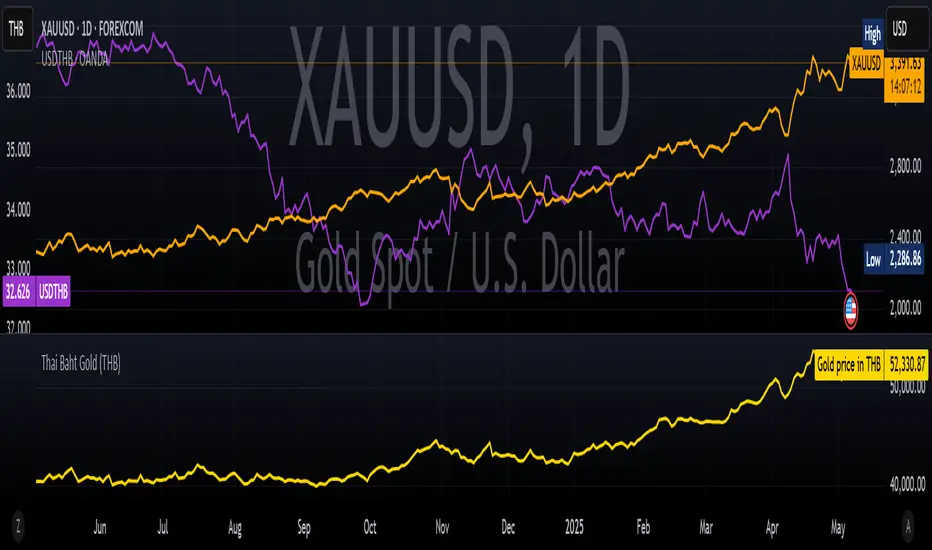
This indicator calculates and visualizes the real-time price of 1 Thai Gold Baht (15.244 grams) based on the global gold price ( XAU/USD ) and the USD/THB exchange rate .
Users can customize gold weight and purity to simulate the local Thai gold market price.
What it does
Retrieves live gold price per troy ounce in USD
Retrieves current USD to Thai Baht exchange rate
Converts the value using user-defined weight and purity
Displays result as a real-time chart
Shows calculation details in the Data Window
Ideal for
Traders tracking Thai gold based on international prices
Analysts comparing local and global bullion markets
Anyone needing a configurable, transparent gold price conversion
Pine Script Functionality
// Uses XAU/USD and USD/THB as inputs
// Calculates 1 Baht Gold (96.5% default purity)
// Outputs the value in THB as a chart line
ชื่ออินดิเคเตอร์: Thai Gold Baht
ชื่อย่อ: Thai Gold Baht
วัตถุประสงค์
อินดิเคเตอร์นี้ใช้คำนวณและแสดงราคาทองคำไทย 1 บาท (15.244 กรัม) แบบเรียลไทม์
โดยอ้างอิงจากราคาทองคำในตลาดโลก ( XAU/USD ) และอัตราแลกเปลี่ยน USD/THB
ผู้ใช้สามารถกำหนดน้ำหนักทองและความบริสุทธิ์เองได้ เพื่อจำลองราคาทองคำในประเทศไทยอย่างแม่นยำ
สิ่งที่อินดิเคเตอร์นี้ทำ
ดึงราคาทองคำแบบเรียลไทม์ต่อทรอยออนซ์ในสกุลเงิน USD
ดึงอัตราแลกเปลี่ยน USD → THB แบบเรียลไทม์
คำนวณราคาจากน้ำหนักและเปอร์เซ็นต์ความบริสุทธิ์ที่ผู้ใช้กำหนด
แสดงผลลัพธ์เป็นกราฟแบบเรียลไทม์ในหน่วยบาทไทย
แสดงรายละเอียดการคำนวณในหน้าต่าง Data Window ของ TradingView
เหมาะสำหรับ
นักเทรดที่ต้องการติดตามราคาทองคำไทยจากราคาทองคำตลาดโลก
นักวิเคราะห์ที่เปรียบเทียบราคาทองคำในประเทศและต่างประเทศ
ผู้ใช้งานที่ต้องการการแปลงราคาทองคำระหว่างประเทศให้โปร่งใสและปรับแต่งได้
การทำงานของ Pine Script
// ใช้ข้อมูล XAU/USD และ USD/THB เป็นอินพุต
// คำนวณราคาทองคำไทย 1 บาท (ความบริสุทธิ์เริ่มต้นที่ 96.5%)
// แสดงผลเป็นเส้นกราฟของราคาทองคำในหน่วยบาทไทย
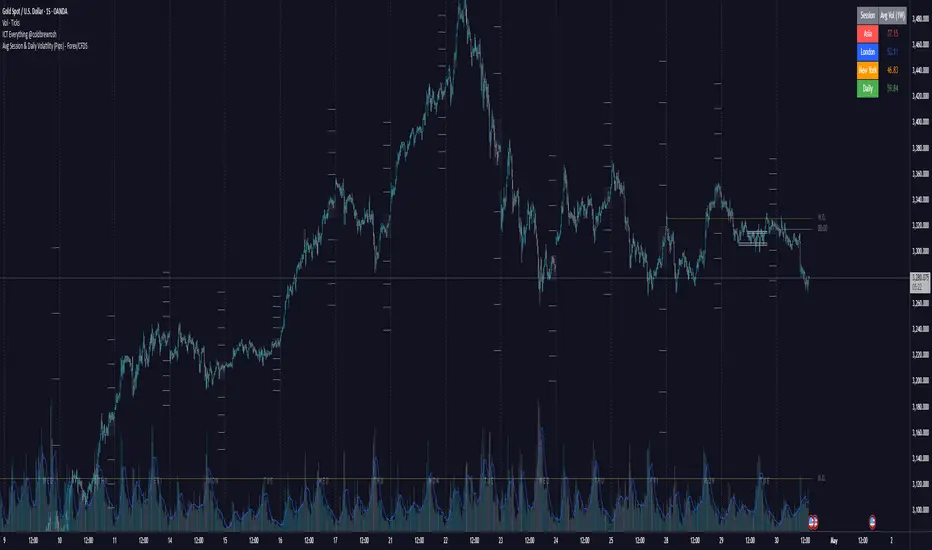
Avg Session & Daily Volatility (Pips) - Forex/CFDS🔍 Overview
The Avg Session & Daily Volatility (Pips) indicator measures the average High–Low range (volatility) of three major Forex sessions—Asia, London, New York—and the entire trading day, then displays the results in a compact overlay table.
⚙️ Key Features
Session Windows
Asia: Default 23:00 – 07:00 server time
London: 07:00 – 16:00
New York: 13:00 – 22:00
Daily Range
– Tracks the full High–Low from midnight to midnight.
Flexible Lookback
– Choose 1W / 2W / 4W / 8W (≈ 5 / 10 / 20 / 40 trading days)
Pip Conversion
Forex Pairs: 1 pip = 0.0001 → (ticks / mintick) / 10
XAU/USD (Gold): 1 pip = 1 USD → direct price difference
Custom Styling
– Pick your own colors per session & daily
– Table position: Left/Center/Right × Top/Middle/Bottom
📈 Benefits & Use Cases
Optimal Stop-Loss & Take-Profit
Gauge each session’s typical movement to size SL/TP appropriately.
Intraday Performance Check
Compare your real-time trade swings against historical averages.
Risk Management
Align position sizes with average volatility to control risk.
Multi-Asset Support
Works seamlessly for major Forex pairs and Gold (XAU/USD) thanks to smart pip logic.
🚀 How It Works
Session Scanning – Continuously tracks the session’s high and low.
Array Storage – At session close, calculates range in pips and pushes it into a rolling buffer.
Averaging – Computes the arithmetic mean of the last N values (your chosen lookback).
Visualization – Paints the four averages in a neat 2×5 table overlay.
👍 Pro Tips
Check Your Time Zone – Make sure chart timezone matches your broker’s session times.
Tweak Lookback – Use shorter windows (1W) to react quickly; longer (4–8W) to smooth out outliers.
Combine Indicators – Pair with volume or trend tools for deeper insights.
Happy Trading,
Riseofatrader
Gold/Silver RatioOverview
This indicator displays the Gold/Silver Ratio by dividing the price of gold (XAUUSD) by the price of silver (XAGUSD) on the same timeframe. It is a widely used tool in macroeconomic and precious metals analysis, helping traders and investors evaluate the relative value of gold compared to silver.
📈 What it does
Plots the ratio between gold and silver prices as a line on the chart.
Displays two key horizontal levels:
Overbought level at 90 (dashed red line).
Oversold level at 70 (dashed green line).
Highlights the chart background to show extreme conditions:
Red shading when the ratio exceeds 90 (gold is likely overvalued relative to silver).
Green shading when the ratio drops below 70 (silver is likely overvalued relative to gold).
🧠 How to Use
When the ratio exceeds 90, it suggests that gold may be overbought or silver may be undervalued. Historically, these have been good times to consider shifting exposure from gold to silver.
When the ratio falls below 70, it may indicate silver is overbought or gold is undervalued.
This tool is best used in conjunction with technical analysis, macroeconomic trends, or RSI/Bollinger Bands applied to the ratio.
⚙️ Inputs
This version of the script uses OANDA's XAUUSD and XAGUSD pairs for spot gold and silver prices. You may edit the request.security() calls to change data sources (e.g., FXCM, FOREXCOM, or CFD tickers from your broker).
✅ Best For:
Macro traders
Commodity investors
Ratio and spread traders
Long-term portfolio reallocators

Global M2 [BizFing]MARKETSCOM:BITCOIN ECONOMICS:USM2
This is an indicator designed to show the correlation between the global M2 money supply and Bitcoin.
This indicator basically provides a Global M2 index by summing the M2 money supply data from the United States, South Korea, China, Japan, the EU, and the United Kingdom.
Furthermore, it is configured to allow you to add or remove the M2 data of desired countries within the settings.
I hope this proves to be a small aid in predicting the future price of Bitcoin.
If you have any questions or require any improvements while using it, please feel free to contact me.
Thank you.

Reversal Strength Meter – Adib NooraniThe Reversal Strength Meter is an oscillator designed to identify potential reversal zones based on supply and demand dynamics. It uses smoothed stochastic logic to reduce noise and highlight areas where momentum may be weakening, signaling possible market turning points.
🔹 Smooth, noise-reduced stochastic oscillator
🔹 Custom zones to highlight potential supply and demand imbalances
🔹 Non-repainting, compatible across all timeframes and assets
🔹 Visual-only tool — intended to support discretionary trading decisions
This oscillator assists scalpers and intraday traders in tracking subtle shifts in momentum, helping them identify when a market may be preparing to reverse — always keeping in mind that trading is based on probabilities, not certainties.
📘 How to Use the Indicator Efficiently
For Reversal Trading:
Buy Setup
– When the blue line dips below the 20 level, wait for it to re-enter above 20.
– Look for reversal candlestick patterns (e.g., bullish engulfing, hammer, or morning star).
– Enter above the pattern’s high, with a stop loss below its low.
Sell Setup
– When the blue line rises above the 80 level, wait for it to re-enter below 80.
– Look for bearish candlestick patterns (e.g., bearish engulfing, inverted hammer, or evening star).
– Enter below the pattern’s low, with a stop loss above its high.
🛡 Risk Management Guidelines
Risk only 0.5% of your capital per trade
Book 50% profits at a 1:1 risk-reward ratio
Trail the remaining 50% using price action or other supporting indicators

Reversal Scalping Ribbon - Adib NooraniThe Reversal Scalping Ribbon is a trend-following overlay tool designed to visually identify potential reversal zones based on price extremes and dynamic volatility bands. It calculates adaptive upper and lower bands using price action and custom ATR logic, helping traders quickly assess market direction and possible turning points
🔹 Volatility-adjusted bands based on price highs/lows
🔹 Color-coded ribbons to indicate trend bias and potential reversal shifts
🔹 No repainting, works on all timeframes and assets
🔹 Visual-only display, no trade signals — supports discretion-based entries
This ribbon is designed for scalpers and intraday traders to spot reversal setups with clarity. It enhances your trading by showing real-time market bias without unnecessary distractions. By focusing on probabilities, it helps to improve decision-making in fast-paced environments
How to use the indicator efficiently
For Reversal Trading:
Buy: When price closes below the green ribbon with a red candle, then re-enters with a green candle. Enter above the high of the green candle with a stop loss below the lowest low of the recent green/red candles
Sell: When price closes above the red ribbon with a green candle, then re-enters with a red candle. Enter below the low of the red candle with a stop loss above the highest high of the recent red/green candles
Risk Management:
Limit risk to 0.5% of your capital per trade
Take 50% profit at a 1:1 risk-reward ratio
For the remaining 50%, trail using the lower edge of the green band for buys and the upper edge of the red band for sells

Breaking Structures (javieresfeliz)This TradingView script is designed to identify market structure changes, using a break of highs and lows approach, as well as technical indicators such as ATR, RSI, and EMAs (Exponential Moving Averages). It is aimed at detecting bullish and bearish trends, signaling possible entry and exit points based on various factors. It also offers additional confirmations to avoid false signals and provides a clear visualization of buy and sell signals.
Main Features:
Indicators Used:
ATR (Average True Range): Used to calculate a volatility range, which helps set stop-loss levels and price targets based on the current market volatility.
EMAs (50 and 200): Exponential Moving Averages (EMAs) are used to determine the short-term and long-term trends. The 50-period EMA is used to identify the short-term trend, while the 200-period EMA is used to identify the long-term trend.
RSI (Relative Strength Index): Used to identify overbought or oversold conditions in the market, providing additional buy or sell signals.
Volume: Used to confirm the validity of a signal. An increase in volume can confirm a structure break and provide more reliability to the signal.
Break of Structure Detection (BOS):
Bullish Break: Generated when the price surpasses previous highs.
Bearish Break: Generated when the price falls below previous lows.
Change of Character (CHOCH):
Bullish Trend: Defined by a close above the open and above the 50 EMA.
Bearish Trend: Defined by a close below the open and below the 50 EMA.
Buy and Sell Conditions:
Buy (Long): Activated when several conditions are met, including a bullish change of character, a bullish structure break, the price closing above the previous value plus a multiple of the ATR, and additional confirmations from RSI and volume.
Sell (Short): Activated when several conditions are met, including a bearish change of character, a bearish structure break, the price closing below the previous value minus a multiple of the ATR, with additional confirmations from RSI and volume.
Entry and Exit Signals:
Long Entry (Buy): Executed when the buy conditions are met.
Short Entry (Sell): Executed when the sell conditions are met.
Position Close: Positions are closed when the price crosses below (for long positions) or above (for short positions) the 50 EMA.
Historical Highs and Lows Lines:
The script draws lines of historical highs and lows from the last 288 and 60 periods to show key support and resistance levels on the chart.
Signal Table Across Multiple Timeframes:
The script displays a table in the top-right corner of the chart with indicators like the EMA trend, RSI value, and MACD histogram for timeframes of 1 minute, 5 minutes, 30 minutes, 1 hour, 4 hours, daily, and weekly.
Precautions:
Does not guarantee profits: Although the script is designed to detect structure breaks and possible trend changes, it does not guarantee 100% profitable signals. The market is always subject to risk and unpredictable volatility.
Requires adjustments for each asset: Parameters such as ATR length and EMA lengths should be adjusted according to the asset being analyzed and market conditions.
Use of additional confirmations: To reduce false signals, the script uses additional confirmations like RSI and volume, but it is always recommended to perform additional analysis before making trading decisions.
Changing trends: The change of character (CHOCH) can be a useful indicator, but it can give false signals in highly volatile markets or during prolonged consolidations.
Relies on historical data: This script relies on historical data to identify highs and lows. It does not consider fundamental events that may significantly impact the market.
Requires constant monitoring: Although the signals are automated, it is important to monitor open positions and make adjustments if market conditions change.
Risk of false signals: In low liquidity markets or consolidations, structure breaks can be false, so it’s recommended to pay attention to any additional confirmation signals or use a proper risk management strategy.

Volumen trend indicator 5MVOLUMEN TREND INDICATOR
Introduction
This indicator on TradingView provides a combination of technical analysis through a data table and visual elements on the chart. Its purpose is to provide a comprehensive view of the analyzed asset, facilitating decision-making.
How It Works
The indicator operates on two levels:
Data Table:
Displays key information about the asset's trend.
Includes metrics such as the current price, percentage change, volatility, and other relevant variables.
Can be customized to include additional indicators as needed.
Provides a quick analysis without the need to interpret complex charts.
Technical Elements on the Chart:
Incorporates dynamic support and resistance lines.
Can include moving averages, Bollinger Bands, RSI, or other custom indicators.
Offers visual alerts for significant changes in the asset's trend.
Facilitates detailed technical analysis through direct observation of patterns and signals.
Default Technical Indicators
The indicator comes with the following default pre-configured technical indicators:
Exponential Moving Average (EMA) 9:
This EMA responds more quickly to price movements, making it ideal for identifying short-term trends. It is generally used to detect crossovers with other EMAs or prices and is considered an entry or exit signal.
Exponential Moving Average (EMA) 21:
The 21-period EMA is used to identify medium-term trends. Its interaction with the 9 EMA is key to confirming buy or sell signals when both cross.
RSI (Relative Strength Index):
It is used to measure the magnitude of recent gains and losses of an asset, helping to identify overbought or oversold conditions.
Bollinger Bands:
These bands help identify volatility levels and potential reversal points. Price touching the upper or lower bands can be an important signal of trend change or continuation.
Customization
The user can modify several aspects of the indicator, such as:
Colors and styles of visual elements on the chart.
Types of indicators to include in the table.
Configuration of alerts and notifications.
Time interval for calculations and data updates.
EMA values (the periods can be changed if other configurations are desired).
Recommended Usage
To make the most of the indicator:
Use the data table to get an overview of the asset.
Analyze the technical elements on the chart to confirm trends.
Set alerts to avoid missing key opportunities.
Compare the information with other indicators and data sources before making decisions.
Precautions and Best Practices
Avoid relying solely on the indicator: Complement it with other technical and fundamental analysis.
Adjust the settings according to the asset's volatility: Not all strategies work the same across different markets.
Don’t overload the chart with too many elements: This can create visual noise and confusion in interpretation.
Test it on a demo account before trading live: To familiarize yourself with the indicator's functionality and adjustments.
----------------------------------------------
Remember that no system is perfect, keep these considerations in mind for this indicator:
Do not trade when a signal appears during an opposite trend:
Do not trade when the market is uncertain in its direction or within a parallel channel:

RiskCalc FX & GoldRiskCalc FX & Gold is a multi-market position sizing tool designed to help you manage risk quickly and accurately. With this script, simply enter your account capital, the percentage of risk you wish to take, and your stop in ticks. Depending on the selected market—Forex or XAUUSD—the script automatically adjusts its calculations:
Forex: Assumes 1 lot equals 100,000 units.
XAUUSD: Assumes 1 lot equals 100 ounces.
The script calculates your risk in dollars and, using a fixed value of 1 USD per tick per lot, determines the ideal position size in both lots and total contracts. Results are displayed in a clear, centralized table at the top of the chart for real-time decision-making.
Perfect for traders operating across multiple markets who need an automated and consistent approach to risk management.

Economic Crises by @zeusbottradingEconomic Crises Indicator by @zeusbottrading
Description and Use Case
Overview
The Economic Crises Highlight Indicator is designed to visually mark major economic crises on a TradingView chart by shading these periods in red. It provides a historical context for financial analysis by indicating when major recessions occurred, helping traders and analysts assess the performance of assets before, during, and after these crises.
What This Indicator Shows
This indicator highlights the following major economic crises (from 1953 to 2020), which significantly impacted global markets:
• 1953 Korean War Recession
• 1957 Monetary Tightening Recession
• 1960 Investment Decline Recession
• 1969 Employment Crisis
• 1973 Oil Crisis
• 1980 Inflation Crisis
• 1981 Fed Monetary Policy Recession
• 1990 Oil Crisis and Gulf War Recession
• 2001 Dot-Com Bubble Crash
• 2008 Global Financial Crisis (Great Recession)
• 2020 COVID-19 Recession
Each of these periods is shaded in red with 80% transparency, allowing you to clearly see the impact of economic downturns on various financial assets.
How This Indicator is Useful
This indicator is particularly valuable for:
✅ Comparative Performance Analysis – It allows traders and investors to compare how different assets (e.g., Gold, Silver, S&P 500, Bitcoin) performed before, during, and after major economic crises.
✅ Identifying Market Trends – Helps recognize recurring patterns in asset price movements during times of financial distress.
✅ Risk Management & Strategy Development – Understanding how markets reacted in the past can assist in making better-informed investment decisions for future downturns.
✅ Gold, Silver & Bitcoin as Safe Havens – Comparing precious metals and cryptocurrencies against traditional stocks (e.g., SPY) to analyze their performance as hedges during economic turmoil.
How to Use It in Your Analysis
By overlaying this indicator on your Gold, Silver, SPY, and Bitcoin chart (for example), you can quickly spot historical market reactions and use that insight to predict possible behaviors in future downturns.
⸻
How to Apply This in TradingView?
1. Click on Use on chart under the image.
2. Overlay it with Gold ( OANDA:XAUUSD ), Silver ( OANDA:XAGUSD ), SPY ( AMEX:SPY ), and Bitcoin ( COINBASE:BTCUSD ) for comparative analysis.
⸻
Conclusion
This indicator serves as a powerful historical reference for traders analyzing asset performance during economic downturns. By studying past crises, you can develop a data-driven investment strategy and improve your market insights. 🚀📈
Let me know if you need any modifications or enhancements!

MACD Volume Strategy for XAUUSD (15m) [PineIndicators]The MACD Volume Strategy is a momentum-based trading system designed for XAUUSD on the 15-minute timeframe. It integrates two key market indicators: the Moving Average Convergence Divergence (MACD) and a volume-based oscillator to identify strong trend shifts and confirm trade opportunities. This strategy uses dynamic position sizing, incorporates leverage customization, and applies structured entry and exit conditions to improve risk management.
⚙️ Core Strategy Components
1️⃣ Volume-Based Momentum Calculation
The strategy includes a custom volume oscillator to filter trade signals based on market activity. The oscillator is derived from the difference between short-term and long-term volume trends using Exponential Moving Averages (EMAs)
Short EMA (default = 5) represents recent volume activity.
Long EMA (default = 8) captures broader volume trends.
Positive values indicate rising volume, supporting momentum-based trades.
Negative values suggest weak market activity, reducing signal reliability.
By requiring positive oscillator values, the strategy ensures momentum confirmation before entering trades.
2️⃣ MACD Trend Confirmation
The strategy uses the MACD indicator as a trend filter. The MACD is calculated as:
Fast EMA (16-period) detects short-term price trends.
Slow EMA (26-period) smooths out price fluctuations to define the overall trend.
Signal Line (9-period EMA) helps identify crossovers, signaling potential trend shifts.
Histogram (MACD – Signal) visualizes trend strength.
The system generates trade signals based on MACD crossovers around the zero line, confirming bullish or bearish trend shifts.
📌 Trade Logic & Conditions
🔹 Long Entry Conditions
A buy signal is triggered when all the following conditions are met:
✅ MACD crosses above 0, signaling bullish momentum.
✅ Volume oscillator is positive, confirming increased trading activity.
✅ Current volume is at least 50% of the previous candle’s volume, ensuring market participation.
🔻 Short Entry Conditions
A sell signal is generated when:
✅ MACD crosses below 0, indicating bearish momentum.
✅ Volume oscillator is positive, ensuring market activity is sufficient.
✅ Current volume is less than 50% of the previous candle’s volume, showing decreasing participation.
This multi-factor approach filters out weak or false signals, ensuring that trades align with both momentum and volume dynamics.
📏 Position Sizing & Leverage
Dynamic Position Calculation:
Qty = strategy.equity × leverage / close price
Leverage: Customizable (default = 1x), allowing traders to adjust risk exposure.
Adaptive Sizing: The strategy scales position sizes based on account equity and market price.
Slippage & Commission: Built-in slippage (2 points) and commission (0.01%) settings provide realistic backtesting results.
This ensures efficient capital allocation, preventing overexposure in volatile conditions.
🎯 Trade Management & Exits
Take Profit & Stop Loss Mechanism
Each position includes predefined profit and loss targets:
Take Profit: +10% of risk amount.
Stop Loss: Fixed at 10,100 points.
The risk-reward ratio remains balanced, aiming for controlled drawdowns while maximizing trade potential.
Visual Trade Tracking
To improve trade analysis, the strategy includes:
📌 Trade Markers:
"Buy" label when a long position opens.
"Close" label when a position exits.
📌 Trade History Boxes:
Green for profitable trades.
Red for losing trades.
📌 Horizontal Trade Lines:
Shows entry and exit prices.
Helps identify trend movements over multiple trades.
This structured visualization allows traders to analyze past performance directly on the chart.
⚡ How to Use This Strategy
1️⃣ Apply the script to a XAUUSD (Gold) 15m chart in TradingView.
2️⃣ Adjust leverage settings as needed.
3️⃣ Enable backtesting to assess past performance.
4️⃣ Monitor volume and MACD conditions to understand trade triggers.
5️⃣ Use the visual trade markers to review historical performance.
The MACD Volume Strategy is designed for short-term trading, aiming to capture momentum-driven opportunities while filtering out weak signals using volume confirmation.

MATA GOLD RATIOMata Gold Instrument: User Guide
The Instrument to Gold Oscillator is a technical analysis tool that normalizes the ratio of an instrument's price (e.g., BTC/USD) to the price of gold (XAU/USD) into a 0-100 scale. This provides a clear and intuitive way to evaluate the relative performance of an instrument compared to gold over a specified period.
---
How It Works
1. Calculation of the Ratio:
The ratio is calculated as:
\text{Ratio} = \frac{\text{Instrument Price}}{\text{Gold Price}}
2. Normalization:
The ratio is normalized using the highest and lowest values over a user-defined period (length), typically 14 periods:
\text{Normalized Ratio} = \frac{\text{Ratio} - \text{Min(Ratio)}}{\text{Max(Ratio)} - \text{Min(Ratio)}} \times 100
3. Overbought/Oversold Levels:
Above 80: The instrument is relatively expensive compared to gold (overbought).
Below 20: The instrument is relatively cheap compared to gold (oversold).
---
How to Use the Oscillator
1. Identify Overbought and Oversold Levels:
If the oscillator rises above 80, the instrument may be overvalued relative to gold. This could signal a potential reversal or correction.
If the oscillator falls below 20, the instrument may be undervalued relative to gold. This could signal a buying opportunity.
2. Track Trends:
Rising oscillator values indicate the instrument is gaining value relative to gold.
Falling oscillator values indicate the instrument is losing value relative to gold.
3. Crossing the Midline (50):
When the oscillator crosses above 50, the instrument's value is gaining strength relative to gold.
When it crosses below 50, the instrument is weakening relative to gold.
4. Combine with Other Indicators:
Use this oscillator alongside other technical indicators (e.g., RSI, MACD, STOCH) for more robust decision-making.
Confirm signals from the oscillator with price action or volume analysis.
---
Example Scenarios
1. Trading Cryptocurrencies Against Gold:
If BTC/USD's oscillator value is above 80, Bitcoin may be overvalued relative to gold. Consider reducing exposure or looking for short opportunities.
If BTC/USD's oscillator value is below 20, Bitcoin may be undervalued relative to gold. This could be a good time to accumulate.
2. Commodities vs. Gold:
Analyze the relative strength of commodities (e.g., oil, silver) against gold using the oscillator to identify periods of overperformance or underperformance.
---
Advantages of the Oscillator
Relative Performance Insight: Tracks the performance of an instrument relative to gold, providing a macro perspective.
Clear Visual Representation: The 0-100 scale makes it easy to identify overbought/oversold conditions and trend shifts.
Customizable Periods: The user-defined length allows flexibility in analyzing short- or long-term trends.
---
Limitations
Dependence on Gold: As the oscillator is based on gold prices, any external shocks to gold (e.g., geopolitical events) can influence its signals.
No Absolute Buy/Sell Signals: The oscillator should not be used in isolation but as part of a broader analysis strategy.
---
By using the Instrument to Gold Oscillator effectively, traders and investors can gain valuable insights into the relative valuation and performance of assets compared to gold, enabling more informed trading and investment decisions.

Fractal levels Gold [AstroHub]This indicator detects key fractal points on a price chart and visually marks them with shapes and levels. It helps traders identify potential reversal zones and dynamic support/resistance levels, enhancing market analysis.
Key Features:
Fractal Detection:
The indicator identifies top and bottom fractals using a 5-bar pattern.
A top fractal forms when the middle bar has a higher high compared to the two bars on either side.
A bottom fractal forms when the middle bar has a lower low compared to the two bars on either side.
Fractal Filtering:
The indicator can filter out "pristine" fractals (uninterrupted fractal patterns) based on custom conditions, making it more selective and reducing false signals.
Fractal Plotting:
are plotted as downward triangles.
are plotted as upward triangles.
Users can choose to display or hide fractal points and their corresponding labels.
Fractal Levels:
The indicator automatically plots fractals' levels on the chart, marking potential resistance and support zones.
Fractal levels change dynamically as new fractals are identified.
Customizable Display Options:
Show or hide fractals and levels with adjustable settings.
Choose whether to apply filtering for pristine fractals.
Display the pivot labels to easily track fractal positions.
How It Works:
The indicator uses a simple approach to recognize top and bottom fractals . When a valid fractal is detected, it highlights it on the chart and plots the corresponding price level.
By default, top fractals are shown above the bars (red color), and bottom fractals are shown below the bars (green color).
Fractal levels represent potential reversal points and can act as dynamic support and resistance zones.
Best Use:
The indicator is particularly useful in identifying reversal points and trend changes, helping traders to spot key price levels.
It can be used across various timeframes and markets, particularly for trend-following or reversal strategies.
Customizable Settings:
Show Pivots: Toggle the display of pivot points.
Show Pivot Labels: Display labels for pivot levels.
Show Fractals: Toggle fractal points on the chart.
Show Fractal Levels: Show or hide the levels corresponding to the detected fractals.
Filter for Pristine Fractals: Enable this option to filter out non-pristine fractals for higher accuracy.
Conclusion:
This indicator provides clear, actionable fractal signals, helping traders easily identify critical levels for entry and exit. With customizable settings and visual cues, it's suitable for both novice and expe

Marcel's Dynamic Profit / Loss Calculator for GoldOverview
This Dynamic Risk / Reward Tool for Gold is designed to help traders efficiently plan and manage their trades in the volatile gold market. This script provides a clear visualisation of trade levels (Entry, Stop Loss, Take Profit) while dynamically calculating potential profit and loss. It ensures gold traders can assess their positions with precision, saving time and improving risk management.
Key Features
1. Trade Level Visualisation:
Plots Entry (Blue), Stop Loss (Red), and Take Profit (Green) lines directly on the chart.
Helps you visualise and confirm trade setups quickly which is good for scalping and day trades.
2. Dynamic Risk and Reward Calculations:
Calculates potential profit and loss in real time based on user-defined inputs such as position size, leverage, and account equity.
Displays a summary panel showing risk/reward metrics directly on the chart.
3. Customisable Settings:
Allows you to adjust key parameters like account equity, position size, leverage, and specific price levels for Entry, Stop Loss, and Take Profit.
Defaults are dynamically generated for convenience but remain fully adjustable for flexibility.
How It Works
The script uses gold-specific conventions (e.g., 1 lot = 100 ounces, 1 pip = 0.01 price change) to calculate accurate risk and reward metrics.
It dynamically positions Stop Loss and Take Profit levels relative to the entry price, based on user-defined or default offsets.
A real-time summary panel is displayed in the bottom-right corner of the chart, showing:
Potential Profit: The monetary value if the Take Profit is hit.
Potential Lo
ss: The monetary value if the Stop Loss is hit.
How to Use It
1. Add the script to your chart on a gold trading pair (e.g., XAUUSD).
2. Input your:
Account equity.
Leverage.
Position size (in lots).
Desired En
try Price (default: current close price).
3. Adjust the Stop Loss and Take Profit levels to your strategy, or let the script use default offsets of:
500 pips below the Entry for Stop Loss.
1000 pips above the Entry for Take Profit.
4. Review the plotted levels and the summary panel to confirm your trade aligns with your risk/reward goals.
Why Use This Tool?
Clarity and Precision:
Provides clear trade visuals and financial metrics for confident decision-making.
Time-Saving:
Automates the calculations needed to evaluate trade risk and reward.
Improved Risk Management:
Ensures you never trade without knowing your exact potential loss and gain.
This script is particularly useful for both novice and experienced traders looking to enhance their risk management and trading discipline in the Gold market. Enjoy clearer trades at speed.

GOLD MonitorI'm using this platform from sometime and I carry out trading on Gold, using a kind of scalping strategy.
Scalping is not an easy task to do. Personally I found a lot of problems while detecting the trend direction.
So I decided to develop an indicator that is capable, in a discrete way, to give an instant-view on the market that is interesting.
This indicator can summarize in a small table all interesting figures related to gold scalping trading and is useful while joined with technical and fundamental analysis.
In this way it is possible to easy take under control all important aspects related to gold trading that I summarize here and you can find inside the table:
1) Gold / USD current direction
2) USD dollar strength (instant DXY) indicator take under consideration the DXY value every each tick and measures the increase or decrease in percentage. If there is a decrease the indicator displays a red low arrow, if there is an increase the indicator displays a green high arrow
also Gold friends are important so it is possible to find also:
3) NZDUSD (that is a Gold friend) variation percentage. If there is a decrease the indicator displays a red low arrow, if there is an increase the indicator displays a green high arrow
4) AUDUSD (that is a Gold friend) variation percentage. If there is a decrease the indicator displays a red low arrow, if there is an increase the indicator displays a green high arrow
then it is possible to find DXY USD dollar strength calculated between previous period (e.g. in timeframe M5 last 5 minutes) and current period (current 5 minutes). This indication is represented by an high arrow if there has been an increase, or by an low arrow if there has been a decrease.
Last but not least the information about the Gold trend itself with the possible forecast for the current period. This information must be carefully interpreted together with other instruments for technical analysis like Fibonacci lines.

Bitcoin to GOLD [presentTrading]**Introduction and How it is Different**
Unlike traditional indicators, the BTGR offers a unique perspective on market sentiment and asset valuation by juxtaposing two seemingly disparate assets: Bitcoin, the digital gold, and Gold, the traditional store of value. This article introduces an advanced version of this ratio, complete with upper and lower bands calculated using standard deviations. These bands add an extra layer of analytical depth, allowing for more nuanced trading strategies.
BTCUSD 12h bigger picture
**Economic Principles**
The BTGR is rooted in the economic principles of asset valuation and market sentiment. Gold has long been considered a safe haven asset, a place where investors park their money during times of economic uncertainty. Bitcoin, on the other hand, is often viewed as a high-risk, high-reward investment. By comparing the two, the BTGR provides insights into the broader market sentiment.
- Risk Appetite: A high BTGR indicates a bullish sentiment towards riskier assets like Bitcoin.
- Market Uncertainty: A low BTGR suggests a bearish sentiment and a flight to the safety of Gold.
- Asset Diversification: The BTGR can be used as a tool for portfolio diversification, helping investors balance risk and reward.
**How to Use It**
Setting Up the Indicator
- Platform: The indicator is designed for use on TradingView.
- Time Frame: A 480-minute time frame is recommended for more accurate signals.
- Parameters: The moving average is set at 200 periods, and the standard deviation is calculated over the same period.
**Trading Signal**
Long Entry: Consider going long when the BTGR crosses above the upper band.
Short Entry: Consider going short when the BTGR crosses below the lower band.
Note: Due to the issue that the number of trading is less than about 100 times, the corresponding strategy is not allowed to publish.

Correlation Coefficient - DXY & XAUPublishing my first indicator on TradingView. Essentially a modification of the Correlation Coefficient indicator, that displays a 2 ticker symbols' correlation coefficient vs, the chart presently loaded.. You can modify the symbols, but the default uses DXY and XAU, which have been displaying strong negative correlation.
As with the built-in CC (Correlation Coefficient) indicator, readings are taken the same way:
Positive Correlation = anything above 0 | stronger as it moves up towards 1 | weaker as it moves back down towards 0
Negative Correlation = anything below 0 | stronger moving down towards -1 | weaker moving back up towards 0
This is primarily created to work with the Bitcoin weekly chart, for comparing DXY and Gold (XAU) price correlations (in advance, when possible). If you change the chart timeframe to something other than weekly, consider playing with the Length input, which is set to 35 by default where I think it best represents correlations with Bitcoin's weekly timeframe for DXY and Gold.
The intention is that you might be able to determine future direction of Bitcoin based on positive or negative correlations of Gold and/or the US Dollar Index. DXY has been making peaks and valleys prior to Bitcoin since after March 2020 black swan event, where it peaked just after instead. In the future, it may flip over again and Bitcoin may hit major highs or lows prior to DXY, again. So, keep an eye on the charts for all 3, as well as the indicator correlations.
Currently, we've moved back into negative correlation between Bitcoin and DXY, and positive correlation with Bitcoin and Gold:
Negative Correlation b/w Bitcoin and DXY - if DXY moves up, Bitcoin likely moves down, or if DXY moves down, Bitcoin likely moves up (or if Bitcoin were to move first before DXY, as it did on March 2020, instead)
Positive Correlation b/w Bitcoin and Gold - Bitcoin and Gold will likely move up or down with each other.
DXY is represented by the green histogram and label, Gold is represented by the yellow histogram and label. Again, you can modify the tickers you want to check against, and you can modify the colors for their histograms / labels.
The inspiration from came from noticing areas of same date or delayed negative correlation between Bitcoin and DXY, here is one of my most recent posts about that:
Please let me know if you have any questions, or would like to see updates to the indicator to make it easier to use or add more useful features to it.
I hope this becomes useful to you in some way. Thank you for your support!
Cheers,
dudebruhwhoa :)

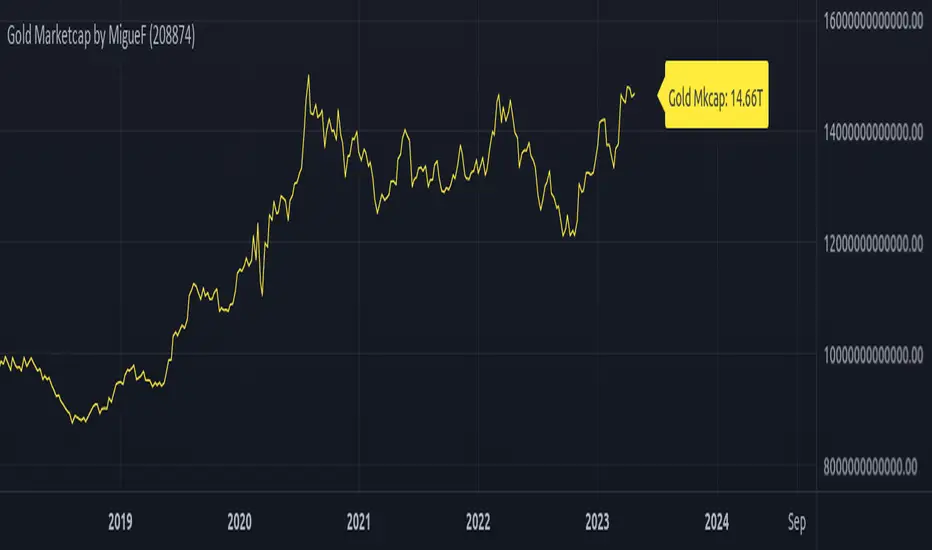
Total Gold Market Capitalization by MigueFinanceThis is the Current Market Capitalization and Historical Chart of Gold
There might be discrepancies in the future in the current market cap of gold due to the number of gold ever mined which is always increasing, so as to update it when necessary, you can go and check the site: "https://www.gold.org/goldhub/data/how-much-gold" and edit the amount of tonnes on the settings of this indicator
Market Relative Candle Ratio ComparatorIntroducing the Market Relative Candle Ratio Comparator, a visually captivating script that eases the way you compare two financial assets, such as cryptocurrencies and market indices. Leveraging a distinctive calculation method based on percentage changes and their averages, this tool presents a crystal-clear view of how your chosen assets perform in relation to each other, both for individual candles and over a range of previous candles.
Tailoring the script to your preferences is a walk in the park, as it allows you to easily adjust input symbols, moving average lengths, and other parameters to match your analytical approach. The visually arresting column chart it creates employs vivid red and green colors to underscore the differences between the two assets on each candle. Simultaneously, the lower-opacity columns depict the accumulated differences over a specified lookback period. This vibrant blend of colors and opacities results in a dynamic visual experience, enabling you to better grasp market trends relative to each other.
The reverse bool input is a handy feature that lets you invert the effect of the input symbol (DXY by default) in the comparison. When you set the reverse input to true, the script multiplies the calculated DXY percentage change by -1, effectively reversing the comparison. This is particularly useful when examining assets with an inverse relationship or when you'd like to analyze the input symbol's impact in the opposite direction.
For instance, if the input symbol represents a market index that generally moves in the opposite direction of the selected cryptocurrency, enabling the reverse input will help you better visualize and understand the relationship between the two assets by inverting the input symbol's effect on the comparison.
In the accompanying chart, you can observe the comparison of Bitcoin's movement relative to the Dollar, Gold, Bonds, and the S&P 500. The indicator reveals that in the last day, Bitcoin outperformed Bonds, Gold, and the Dollar but not the S&P 500!

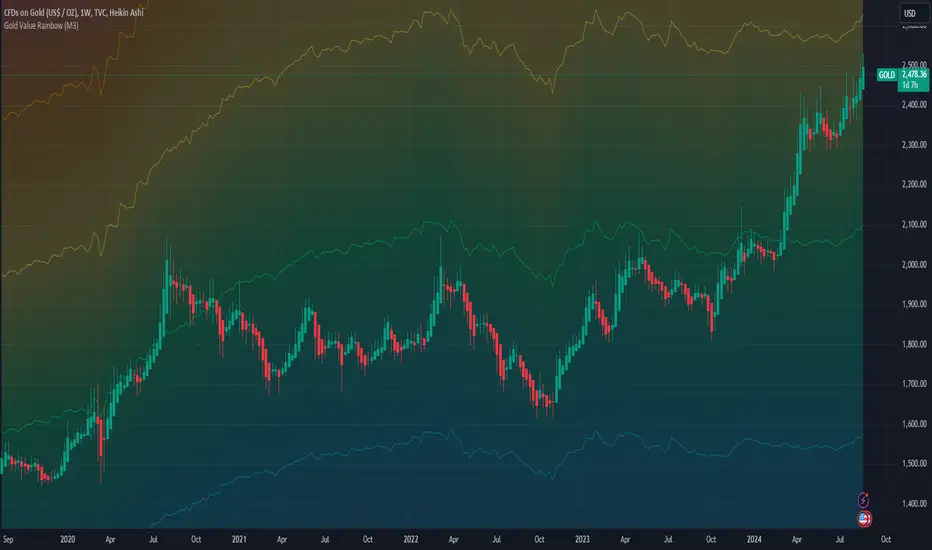
Gold Value RainbowThis indicator can only be used with 'GOLD' ticker. It is used to estimate Gold valuation based on major countries base money supply M0 such as US, EU, JP and CN. These 4 countries represent nearly 75% of total global money supply in the world. The chart will compare how gold value will move alongside with base money supply for comparison study. The chart presented here is just a relative comparison with some scaling and shifting so it doesn't refers to any real measurement. However it can be used to track gold price whether it's too cheap or too expensive in relative to money supply available in the market.
- The gray line represent major countries money supply M0
- The rainbow above the gray line represent the multiplication factors from 1x, 2x, ..., 10x
- The rainbow below the gray line represent the division factors from 0.8x, 0.6x, ..., 0.2x
Check other script to value stock and index:
- Stock Value Rainbow: script to value stock based on book value, earning, dividend and cash flow
- Index Value Rainbow: script to value index based on fed balance sheet and base money supply
- Gold Value Rainbow: script to value gold based on global money supply
- Stock Value US: script to check US stock value
- Stock Value EU: script to check EU stock value
- Stock Value JP: script to check JP stock value
- Stock Value CN: script to check CN stock value
Recession Warning Traffic LightThis is an indicator that uses 6 different metrics to determine the combined probability of a recession and compares the high probability warning periods against actual historical periods of recession.
GREEN tells us that the referenced recession indicators are not exhibiting any warning. Observe the long stretches of “all-green” in between recessionary periods in the chart above.
RED will show a full-on warning level for that particular recession indicator, signaling that monitoring of this sector is clearly showing a problem – which has in the past, reliably exhibited itself as a forewarning of recessions.
Adding green and red together can help determine a combined probability of recession.
IMPORTANT: Your chart should be on 1d and set to SPX , DJI ,or NDQ indices
Precious metals: This indicator calculates the relative prices of Gold & rhodium. Gold is a flight-to-quality asset. Rhodium is the rarest of precious industrial metals and prices spike when the economy is heating up. In front of a recession, the upper relative movement of rhodium precedes gold.
Stock markets: This indicator compares closing prices to growth rate curves of the SPX. This indication is the noisiest but tells us very well when the recession has ended. Stock market indices, which respond to “smart money” moving out of markets when the other indicators begin to warn of recession, or when markets become overheated and rise to historically unsustainable levels.
Yield curve: This indicator compares the 3m & 10y treasuries and detects yield curve inversions. Interest rates are controlled by the Federal Reserve and by the purchasers in the Federal Treasury auction markets, which together create the treasury yield curve. This inversion is the most reliable recession indicator. These happen during a flight to quality.
Federal Reserve: This indicator measures GDP and detects contraction which is technically a recession. This is usually one of the last indicators to enter a Warning state, and it could be 6 months delayed simply confirming what may have already been projected.
Money Supply. This indicator measures the M2 money supply, which typically grows about 1% per calendar quarter. When this shrinks, it's tapping the brakes on the economy. This can also lead to yield curve inversion. This is also a measure of inflation and its effects on the aggregate money supply (liquid capital) available for short-term economic activity, or which can be directed into the purchase of long-term, less liquid assets.
Leading Economic factors: There is a whole basket of leading economic indicators that, as collections, reflect overall growth or contraction of economic activity. These indicators include measures of level and growth in productivity, employment, housing, consumer confidence, industrial purchasing confidence, and much more. These indicators may or may not be detached from the broader economy, and often provide up to 6 months of foresight. For more information please visit www.conference-board.org
Actual Recession: Central Bank indicators are published by the Federal Reserve and reflect their own analysis of national and regional economic health, as well as their calculations of the likelihood of a recession. The Federal Reserve has a recession ticker which is used to plot periods of actual recessions on this indicator for comparison.
