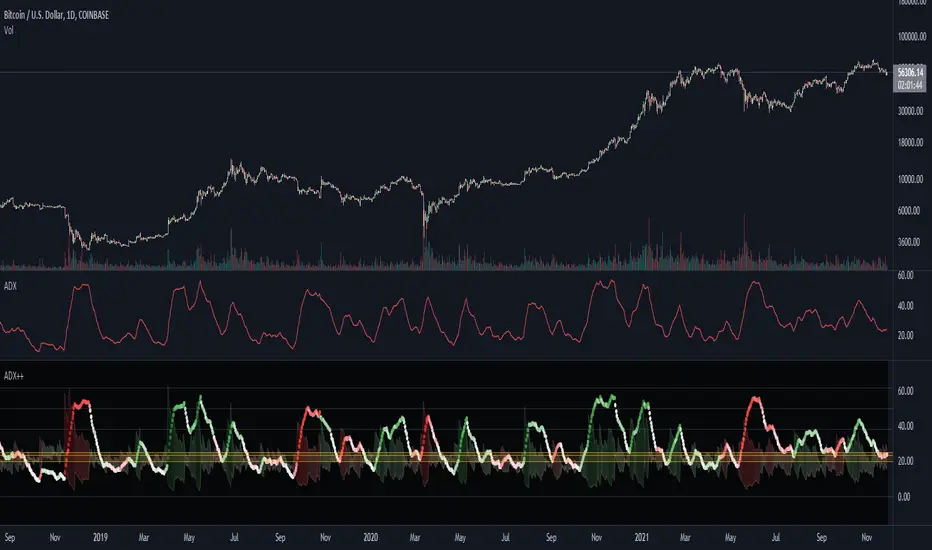
ADX Heatmap & Di's + Fib Referencial by [JohnnySnow]For quicker and easier interpretation, ADX line is displayed in a heatmap style. The more absolute difference between both DIs, the more intense the color.
Because some people use 20 ADX reference and others use 25 ADX reference to confirm the trend, I just add both as reference lines in a 'golden box'
Additionally, reference lines were added with default values set to Fib levels
Heatmap
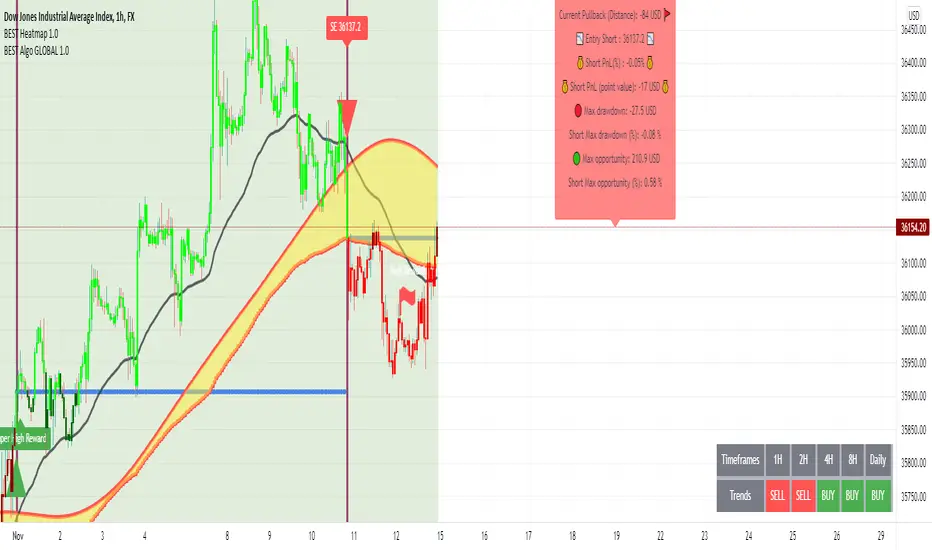
BEST Algo HeatmapHello traders
How to access?
Offered to all the current customers
To be used alongside the BTI Algo Global script.
Heatmap
This heatmap screens the BTI Algo Global signals across different timeframes.
The screened timeframes are for now: m1/m2/m5/m15/m30/H1/H2/H4/H8/Daily
The trends are based on the triangle primary signals
Limitations
- I could only access the last 20K loaded candles, then you might see a blank case for the screened high timeframes when you're loading the screener on a low timeframe chart.
Example: a 1-minute chart with the screener might struggle sometimes to display the 4H/8H/Daily data
- What to do then?
I found a hack.
Just load the chart on a much higher timeframe and you should be able to see the latest timeframes from the heatmap
If any questions, please let me know
Dave
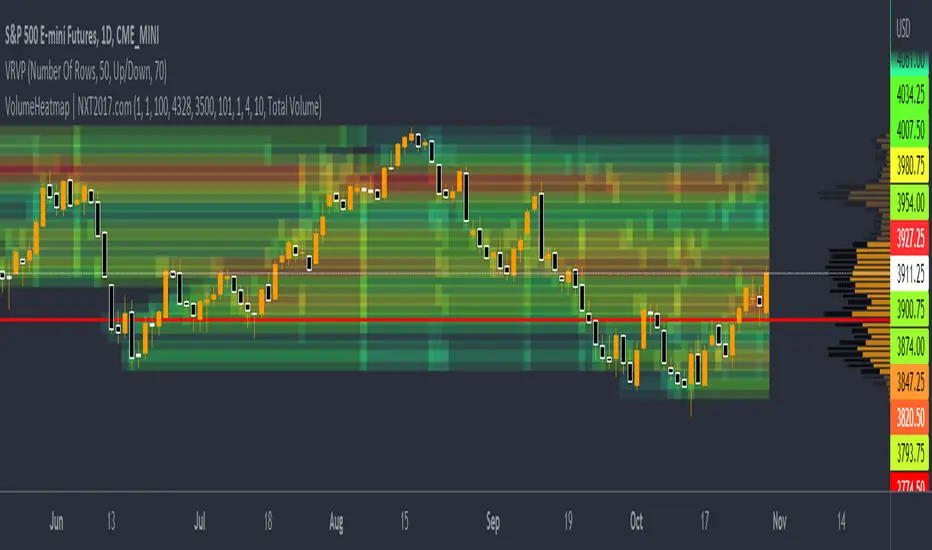
Volume Profile HeatmapA variation of a Volume Profile based on code originally by LuxAlgo. () The traditional bar chart is replaced with full-width bars that are brighter for high volume price levels.
Like a traditional VP, its purpose is to visualize how volume corresponds to specific price levels, allowing you to get a quick idea of where the most activity is occurring, and where it hasn't been. This information may provide clues as to where price action may return, areas of support and resistance , and regions where price may move quickly. The basic concepts behind any Volume Profile (or Price by Volume Chart) should apply here as well. (investopedia article)
Inputs are set up such that you can customize the lookback period, number of rows, and width of rows for most major timeframes individually. Timeframes between those available will use the next lower timeframe settings (e.g., 2m chart will use the 1m settings.)
This indicator is experimental and is likely to receive further updates.

Volume Zones Multi-Timeframe OverlayAt its core, this indicator is a variation of my other indicator, Welkin Advanced Volume Overlay (for VSA )
This version is based on the power of multi-timeframe analysis. The basic functionality is simple: Plot lines from the high and low of candles formed during periods of high volume and fill the space between them. The volume levels for deciding what counts as "high volume" are based on standard deviations of the volume's SMA , and the higher the volume , the brighter the zone. i.e., a volume zone set by a volume level that is 4 standard deviations higher than average will be more "filled in" and less transparent than a volume zone from a 2 standard deviation candle.
These zones tend to act as areas of congestion, and the "ceilings" and "floors" of the zones as support and resistance . Overlapping zones tend to indicate strength and are likely to require more effort to get through. The more timeframes that agree with each other, the stronger the zone, ceiling, or floor.
By default, these zones are drawn based on the chart's timeframe and 1 timeframe higher, automatically set based on some "standard" values:
1m -> 5m
5m -> 15m
10m -> 30m
15m -> 60m
30m -> 60m
60m -> 1d
1d -> 1w
Finally, both the base timeframe and the higher timeframe are customizable; this is intended to make it easy to "double" up copies of the indicator to fit even more timeframes on the chart, creating a sort of heatmap for volume price analysis.
An example of three copies of the indicator, showing volume zones from 6 different timeframes.

Intraday Volume Spikes HeatmapHello friends,
Here's something truly special for intraday traders: this script identifies and visualizes abnormal volume activity clusters throughout the trading day, giving you an instant overview of when the market gets unusually active. It's designed specifically for intraday charts with volume data available.
No setups, no guesswork — just plug it in and see where volume truly spikes.
🛠 How It Works
The indicator divides the trading session into a 60×24 grid — minutes across the horizontal axis and hours down the vertical one.
It tracks each bar's volume (or price spread, or relative change — depending on your selected metric) and highlights the frequency of abnormal activity using a smooth color heatmap.
You can analyze the full chart history or focus on a specific date range.
All the data is neatly displayed in a customizable on-chart table, allowing you to instantly spot intraday periods with heightened trading activity.
🔥 Key Features
Pine Script V6 — optimized and refactored for performance and maintainability
Detects abnormal volume activity — instantly see where volume spikes most often within the day
4 analytical modes — Volume Amount, Volume % Change, High/Low Spread, and Price % Change
Configurable analysis window — use entire chart history or a specific date range
Overlay Mode — display the heatmap directly on your chart or in a separate panel
Customizable appearance — fine-tune colors, borders, text, and layout
17 professional color palettes — including Viridis, Inferno, Magma, and Plasma
Time zone offset support — align analysis with your local time if needed
📸 Visual Examples
Viridis palette
Inferno palette
If you'd like access or have any questions, feel free to reach out to me directly via DM.
👋 Good luck and happy trading!
付費腳本

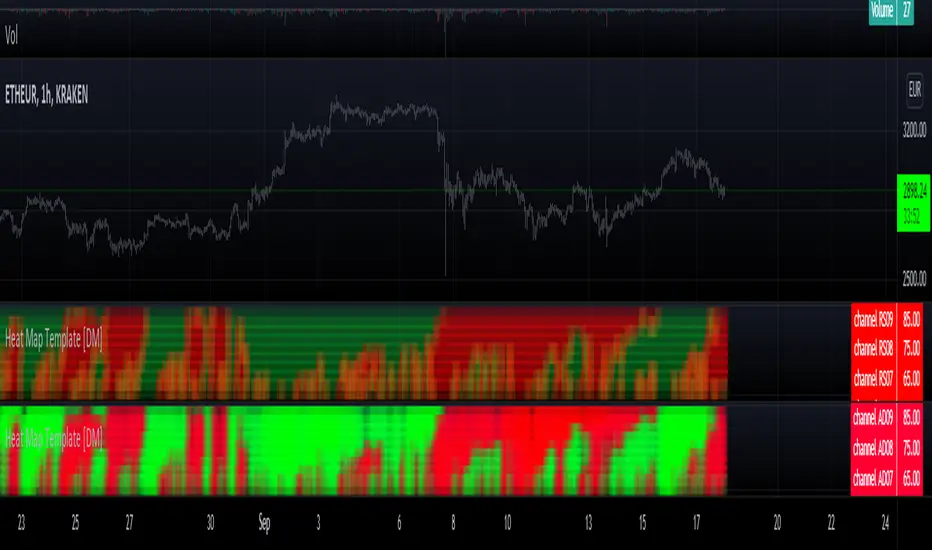
Heat Map Template [DM]Greetings colleges
Today I share a simple template to make your composite heat map
Remember that they can overlap, although here you can only alternate
The source for heat map is an RSI of various lengths which are described in the footer of the script
Enjoy”
Simple Watchlist with % Change Screener & AlertsHi fellow traders..
TV has generously increased the number of alerts!!
A Simple Watchlist with heatmap based on % change on daily timeframe.
Gives % change and RSI
you can set the percentage in the input box and then set alerts on your favorite watchlist.
Alerts also include days high and low..
Simple Table and array based code.
set for scrip close >10 can be easily changed in line 43..
Hope you Like it!

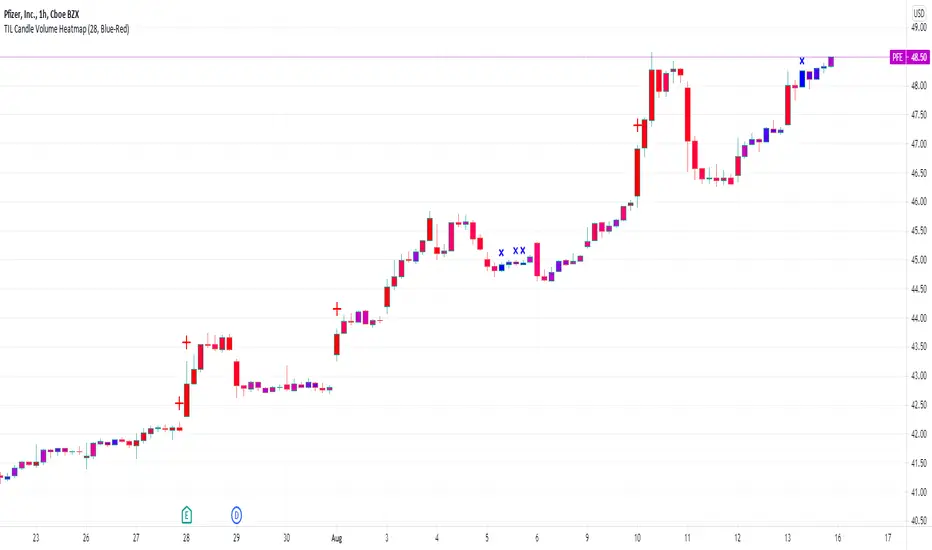
TIL Candle Volume HeatmapTrading Indicator Lab’s Candle Volume Heatmap for TradingView merges volume with price by applying gradient colors in the bars. It can also detect bars that have the most volume and the least volume.
Gradient Coloring
When applied to a chart, the Candle Volume Heatmap indicator applies colors to each bar which may vary according to its number of volume. The chart becomes a heatmap where you can easily spot which parts of the chart that are “hottest” or the bars that had the greatest number of volume and the “coldest” or ones that had the least volume. The indicator uses colors that transitions from BLUE to RED where shades closer to blue are “cold” (low volume) and those that are more in the shade of red are considered “hot” (high volume).
- Blue candlesticks – has low volume
- Red candlesticks – has high volume
High and Low Volume Bars
In addition to bar color changes, the Candle Volume Heatmap indicator also marks bars that have the lowest and highest volume within a certain length. Low and high-volume bars are marked as follows.
- – Low volume bars are marked with a small cross above them signifying a very low volume. Please note that this symbol always appears in new bars which are only starting to accumulate volume.
- – High volume bars are marked with a large plus sign above them signifying a very high volume. These bars along with other red-colored bars are the ones that should be monitored most.
Uses
Identifying low and high-volume bars can be useful in determining whether there is weight or “force” behind the price action that occurs in each bar. High volume bars can be used to validate candlestick reversal patterns and confirm breakouts in support and resistance levels.
Available Alert Conditions
- High Volume – triggers when a high-volume bar (marked with a plus sign) is detected
- Low Volume – triggers when a low-volume bar (marked with a cross sign) is detected
Inputs
- Length – sets the number of bars the indicator analyzes at each execution.
- Color Gradient – sets the color set for applying the heatmap on the chart candlesticks. Choices available are Blue-Red (good for light mode) and Yellow-Red (good for dark mode). Red color always signifies the highest concentration of volume.
- Apply Heatmap Colors – applies the color gradient on the chart candlesticks to indicate the amount of volume in each one
- Display Markers Below – moves the position of the high volume (plus) and low volume (cross) markers below the candlestick
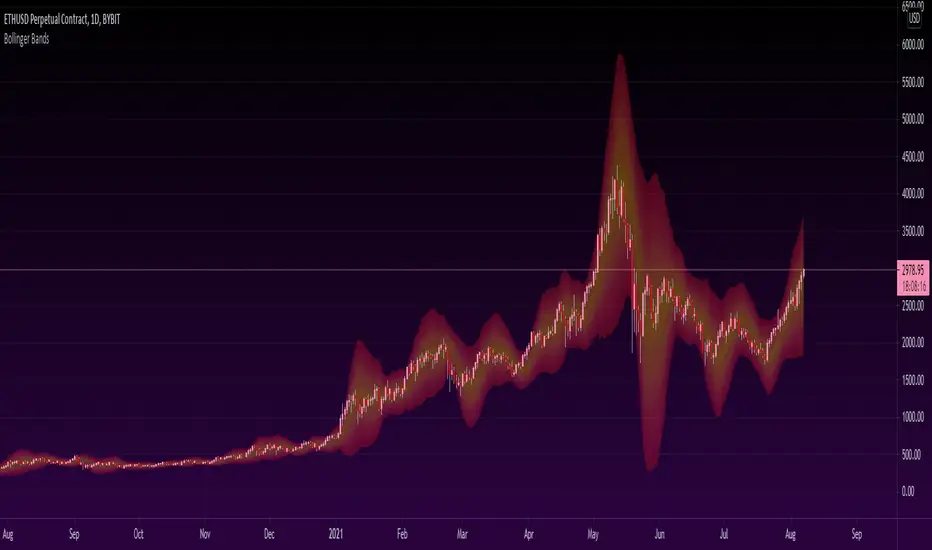
Heatmapped Bollinger BandsBollinger Bands have been used for many years to determine the volatility and potential reversal area of markets. This script takes standard Bollinger Bands (BB) and transforms it into a heatmap of reversal areas.
A basic explanation on how this indicator works is:
- Yellow is where the price likes to stay,
- Orange is where the price might begin to reverse in a weak trend, and
- Red is where the price will either pause to let the yellow range catch up, or where the price will jump back down into the yellow range to stabilize.
For educational purposes: this script is essentially just taking the standard method of creating Bollinger Bands (seen in the 'Main Lines' portion of the script), coloring the plots 'na' so that they aren't seen, and using the 'fill' function to plot the yellow to red rainbow up to the top. I believe I made the yellow range 0.2*stdev to 1*stdev, the orange range 1*stdev to 2*stdev, and the red range 2*stdev to 3*stdev. You can get the hex code rainbow from any website that has a color slider.
** Disclaimer: THIS IS NOT TRADING ADVICE. Bollinger Bands should be used in conjunction with other indicators to make better decisions but NO STRATEGY IS PERFECT. Always backtest any strategy before using it live. **
Bjorgum MTF MAScope:
Up to 3 MA's can be applied at the users discretion
Choose between 10 different average types including favorites from the Bjorgum series from HEMA to Reversal T3's
Each MA can be independently set
Go Multi-timeframe! Any MA can be set to any timeframe of reference you choose (ex. using 3 different timeframes of higher resolution to your chart reference to establish a multi-time frame trend)
RSI HEATMAP. Use the bar color or the MA color selection toggle to set your color to reference RSI on a gradient. This helps to establish clear visual reference to momentum on top of trend analysis
Assigning RSI bar color to an MA of a higher time frame can allow you to see visual reference of momentum of the greater trend that may be at play.
Example: trying to get short on a 15min while your 1hr and 4hr RSI Heatmap burns deep in oversold.
RSI color can be assigned to the bar color, the MA (1,2 or 3), or both. Alternatively, bar color can be assigned to a more simple rising/ falling MA color and price above/ below the MA for bar color.
ALL MTF FUNCTIONS ARE NON_REPAINTING.
The Idea
The original inspiration behind the script came from an observation of a constant struggle of Pinecoders of both youth or experience to find accurate multi-timeframe indicators that do not repaint, and appear as should on historical bars, while performing reliably in real time. I encourage you to scroll the Pinecoders FAQ on a recent piece explaining the difficulties and caveats of different approaches, but I would like to reference the elimination of the historical bar offset for THIS purpose. MA's are based on closing prices, that is to say they are confirmed and will not change once the bar has closed. There is no need to offset these for historical reference. The purpose of the historical offset is best exemplified, for example, with an intraday strategy involving daily breakouts. Let's entertain going long on a break to a new daily high. We would not know that in real time so we need to reference the previous bars close for BACKTESTING purposes, otherwise we get "lookahead bias". There is no shortage of strategies unintentionally employing this bias out there (I'm sure you have come across them with their unrealistic results).
There is no worry of repainting with the MTF security function included within this script, nor will it offset for something involving lookahead bias. I encourage those that are playing with the code or perhaps writing strategies of their own to borrow the functions within. There is also a function that will return the 10 MA variable selection - yours to keep.
With all that in mind, I wanted a practical script that is easily deployable in everyday trading for the average trader that gives the user a firm grip on their trading steering wheel equipped with the feel of the road. Incorporating several MA's of differing times with the RSI heatmap gives a good visual reference and feel to your trading environment, while offering a level of customization that will fit an individuals personal trading style. The RSI heatmap gradient is per percentage between 30 and 70 and your 2 colors - anything outside of those levels gives you the vibrant bias color
Below I walk through 2 examples of live trades scenarios I made using the mindset the script offers.
The Trade
LONG IZEA
Timeframe: 4hr chart
- 3 Tilson MA's of varying length are deployed at varying intraday time frames
- A bullish pattern in an uptrend offers a possible trade allowing entry from a low risk point from the pattern low
- See the chart for notes and observations using the script
- Notice how the heatmap brightens up as price extends far away from the averages - your risk has elevated for a new position
- Notice the heatmap cool off while price action consolidates sideways
The Trade
SHORT BTCUSDT
Timeframe: 4hr chart
- 3 EMAs are employed - same length (50), with 3 successive timeframe resolutions
- A downtrend is formed with a sharp move to stack the EMAs into layers
- A pull back opportunity presents itself in bearish consolidation
- Notice a Doji star at resistance establishing a swing high as RSI cools off into the EMA dynamic resistance for entry
- An '"equal legs" measured move can be used for a trade target with a stop out above the swing high.
- Again, take note of distance from EMA's, the heatmap in combination with trend development surrounding the MA's
These were just two ideas to show you an example of how to implement some strategy into your trading and to get some interesting use from the indicator. Hope you enjoyed the read and happy trading.

MM MTF HeatmapThe MM Mtf HeatMap can scan multi symbol and multi timeframe on any given market
it detects trends with options on what type of trend detection moving average and smoothing type you prefer based on your backtest.
detects trends on four selectable timeframes
10 selectable symbols
Directions are simple
make sure you are using this on a lower timeframe your lowest selected timeframe is on. for example if your lowest timeframe is the 15min
make sure you are using current charts below the 15min like the 10 or 5min
selectable moving averages
are the
SMA
EMA
Tema
WMA
Hull
Variable
This HeatMap displays the trend overall market you are trading at one glance (Talk about top down analysis)
Enjoy happy Trading
Link below or PM us for access to this indicator Happy Trading
3D Wave-PMThe Wave-PM (Whistler Active Volatility Energy - Price Mass) indicator is an oscillator described in Mark Whistler's book 'Volatility Illuminated'.
The Wave-PM was specifically designed to help read cycles of volatility. When visualizing volatility cycles as a heatmap we can get a clear overview of market volatility phases on multiple timeframes, and more importantly as traders give us insight into 'potential' volatility from to pent up energy signaled by the blue and green plumes which invariably give way to big moves signaled by the orange and red plumes.
This indicator can be quite GPU intensive, so simple and also line based visualization methods are included. Also, its free and open source so go ahead and hack it to your hearts content. Enjoy!

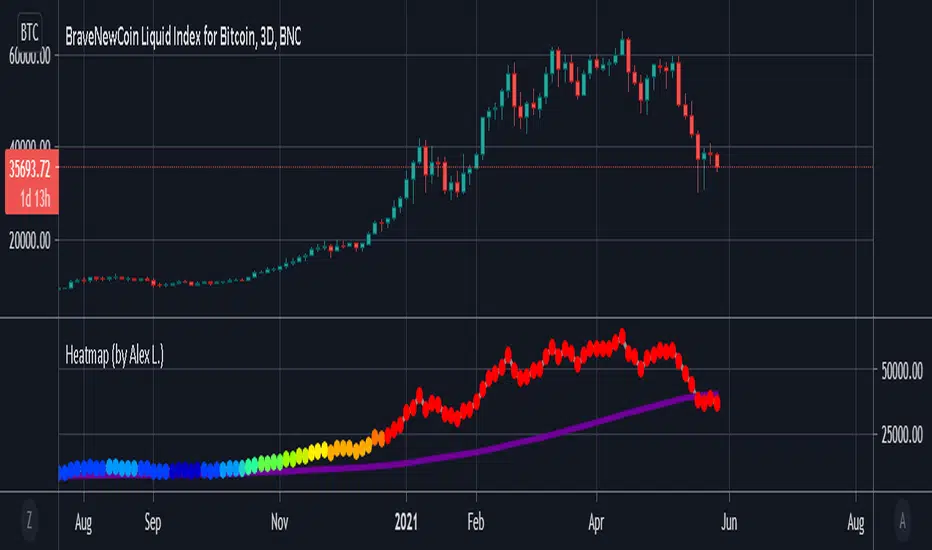
Bitcoin Heatmap (by Alex L.)This indicator is a based on "200 Week Moving Average Heatmap" by Plan B. It shows "heatmap" of a security based on % increase of its 200 week (or other) moving average. It can be used for Bitcoin, as well identifying overheated Stocks (like TSLA). Plan B designed this indicator for Bitcoin using MA = 1400 (which is 200 trading days in Crypto), I personally found it useful to indicate overheated Stock Market stocks using MA = 250 (which is ~1 year of net trading days, excluding weekends and holidays).
Enjoy!
CCI/MFI/VZO/RSI - HEATMAPHeatmap I made/reverse engineered.
Currently tracks the 4 following oscillators:
- CCI (Channel Commodity Index)
- MFI (Money Flow Index)
- VZO (Volume Zone Oscillator)
- RSI (Relative Strength Index)
Any feedback or suggestions highly appreciated.
/* Inspiration taken from @ByzantineGeneral (TradingView profile: /u/ByzantineGeneral, indicator: /script/keAGdnWO-Byzantium-Oscillator-Heatmap) */

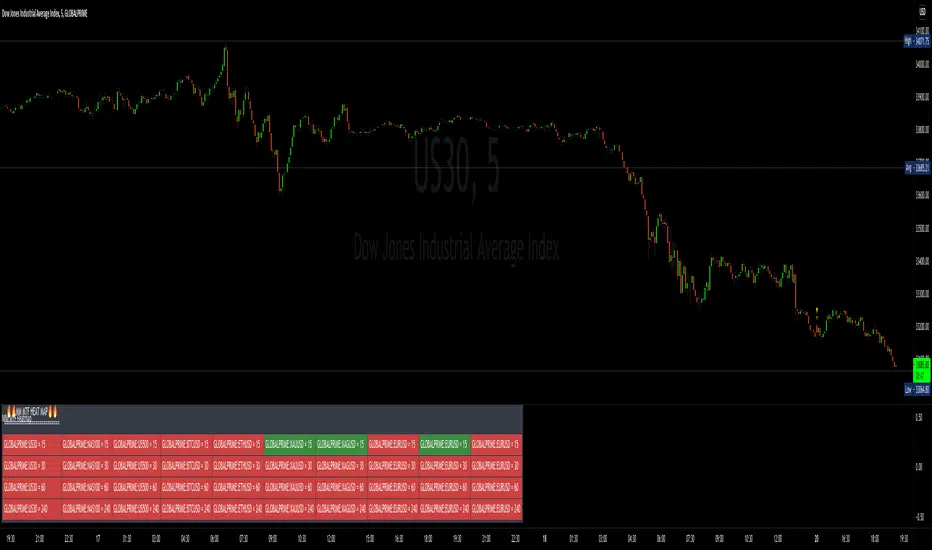
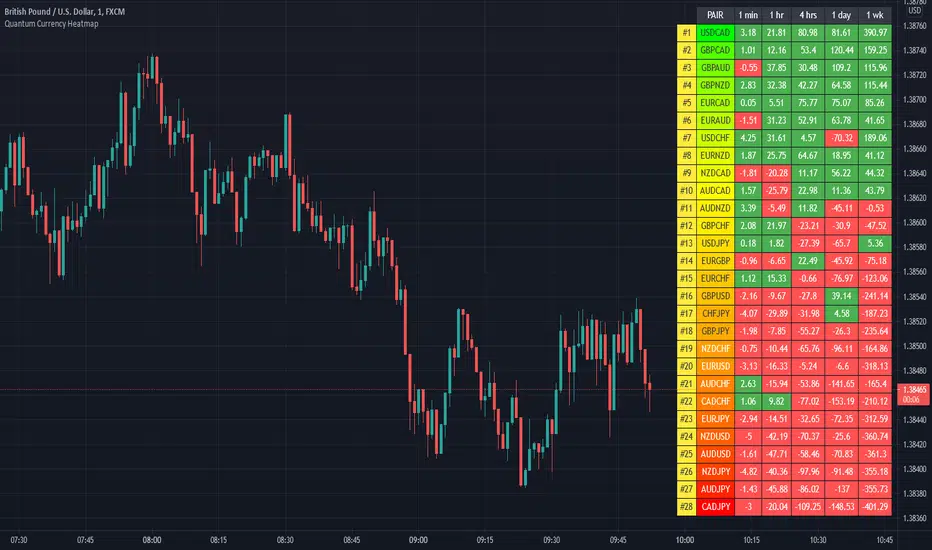
Quantum Currency HeatmapTrading the currency markets is a complex business. With so many pairs and multiple timeframes it is almost impossible to monitor them all – but with the Currency Heatmap you can. The Currency Heatmap indicator delivers the information you need to base your trading decisions on the entire spectrum of currency pairs derived from the 8 major currencies: namely the US dollar, the Euro, the British Pound, the Swiss Franc, the Japanese Yen, the Canadian Dollar, the Australian Dollar and finally the New Zealand Dollar. In one clear and simple table, you can see instantly the entire weight of market sentiment across all 28 pairs and across all timeframes. A global view of risk and sentiment on one chart.
It instantly displays the “hottest” and “coldest” areas of the financial landscape. Vertically, 28 currency pairs are listed and ranked from the most bullish (top) to the most bearish pair (bottom) and reflect the data ranking on the associated currency matrix indicator. And this is where it gets interesting: horizontally, the performance scores of each currency pair are displayed in 5 customizable timeframes.
Interpreting the colors
Each cell of the Currency Heatmap indicator is color coded making it possible to interpret it instantly with just a glance, much like looking at a sophisticated thermal imagery scanner, but for Forex. If you check out the indicator, you will see how easy and intuitive it is, but let us just expand on them here.
If we start with the performance scores. This is the value the indicator assigns to each currency pair representing how positively or negatively its price moved over a certain period. If you have the Currency Matrix indicator, you will also notice that the figures are the same. This is because both use the same algorithm in calculating the performance scores. The cells can be any of the two colors depending on the performance score. This is the color coding used when viewing the currency pairs ACROSS the 5 timeframes or what we like to call the time horizon:
- Green – if the currency pair’s performance score for the aligned timeframe is POSITIVE.
- Red – if the currency pair’s performance score for the aligned timeframe is NEGATIVE.
However, the pairs are then ranked VERTICALLY using a dynamic graded color code transitioning from green, to yellow and to red in that order. The performance scores of the currency pairs in 5 timeframes are added together. The currency pairs are then ranked by their sum from the most positive to the most negative and are color coded as follows:
- Green shades – the sum of the currency pair’s performance scores in 5 timeframes is well above the fulcrum of zero.
- Yellow shades – the sum of the currency pair’s performance scores in 5 timeframes is relatively flat and around the fulcrum of 0. It can either be positive or negative but trails the numbers closest to 0.
- Red shades – the sum of the currency pair’s performance scores in 5 timeframes is well below the fulcrum of zero.
The gradation of color is dynamic and hence the transition of colors will depend entirely on the sum of the currency pair’s performance scores in 5 timeframes as explained above. As with all our other indicators, this is dynamic and is constantly shifting in real time to reflect the ebb and flow of sentiment across the timeframes.
Customizable timeframes
The Currency Heatmap for TradingView allows you to change the timeframe of each of its 5 columns. This can be configured in the indicator settings where you can select 1 of many timeframe options namely:
- 1 min
- 2 min
- 3 min
- 4 min
- 5 min
- 10 min
- 15 min
- 30 min
- 45 min
- 1 hr
- 2 hrs
- 3 hrs
- 4 hrs
- 1 day
- 2 days
- 3 days
- 1 wk
- 1 mo
The 5 default timeframes (from left to right) are listed below:
- Timeframe 1: 1 min
- Timeframe 2: 1 hr
- Timeframe 3: 4 hrs
- Timeframe 4: 1 day
- Timeframe 5: 1 wk
The ranking of the 28 currency pairs changes depending on the timeframes you select for each column. This flexibility allows you to monitor the strength of the pairs within your own range of timeframes in real time.
Weight of the timeframes
One important factor to consider when interpreting the Currency Heatmap indicator and the ranking aspect, is the fact that the performance scores in each timeframe inherently possess weight, and this is reflected in how the indicator has been developed. As you can appreciate, the weight of sentiment in a slower timeframe is greater than that in a faster timeframe. Simply put, the weight of each timeframe is directly proportional to the timeframe itself. Faster timeframes carry less weighting to the overall ranking, whilst slower timeframes carry more. This means currency pairs ranking near or at the bottom of the ladder (bearish) are most likely to have red cells through the slower timeframes or the columns at the right-hand side of the indicator. Similarly, the currency pairs at the top and ranking as bullish or very bullish, again are most likely to have green cells through the slower timeframes.
Stepping back, the changing colors deliver a heatmap reflecting the relative performance of the 28 currency pairs across ALL timeframes in real time. This gives a horizontal analysis of the currency pairs across time. Immensely powerful. And empowering you as a trader to make clear, logical, and fast decisions.
Currency filter
The Currency Heatmap allows you to filter the currency pairs relevant to the currency you are analyzing. An input is provided in the indicator’s settings window which you can click to select a currency.
- USD selects all currency pairs that contain the US Dollar.
- EUR selects all currency pairs that contain the Euro.
- GBP selects all currency pairs that contain the British Pound.
- CHF selects all currency pairs that contain the Swiss Franc.
- JPY selects all currency pairs that contain the Japanese Yen.
- CAD selects all currency pairs that contain the Canadian Dollar.
- AUD selects all currency pairs that contain the Australian Dollar.
- NZD selects all currency pairs that contain the New Zealand Dollar.
Click the Filter option box and select a currency in the list to apply a filter. If you like to undo a filter, simply select NONE. When a certain currency filter is in effect, the currency pairs that include the selected currency in the heatmap appear in color.
Getting started
Here are some further details on the Currency Heatmap indicator to help you get started:
- Your Quantum Currency Heatmap indicator must always be applied in a 1 min chart.
- The indicator occupies its own indicator window in the chart. We recommend expanding the indicator vertically to get a complete view.
- When you first apply the indicator, please allow a few seconds for the data to build in history.
Currency Dashboard
By itself, the Quantum Currency Heatmap indicator is a powerful trading tool for identifying trading opportunities, quickly, easily on a single chart. However, its development is part of a new indicator bundle that we like to call the Quantum Currency Dashboard which consists of the following indicators:
- Quantum Currency Strength Indicator (CSI)
- Quantum Currency Matrix
- Quantum Currency Array
- Quantum Currency Heatmap
These four indicators then provide a unique and compact insight into all the various aspects of strength and weakness for both currencies and currency pairs from trend and momentum to overbought and oversold. What is unique is that using four charts you are then able to monitor the myriad combinations of strength, weakness, momentum, congestion and divergence across the entire forex complex at a click of a button. And even more powerfully giving you the confidence to get in and stay in for maximum profits. No more missed opportunities, no more struggling with multiple charts, and no more trader regret whatever your trading style approach.
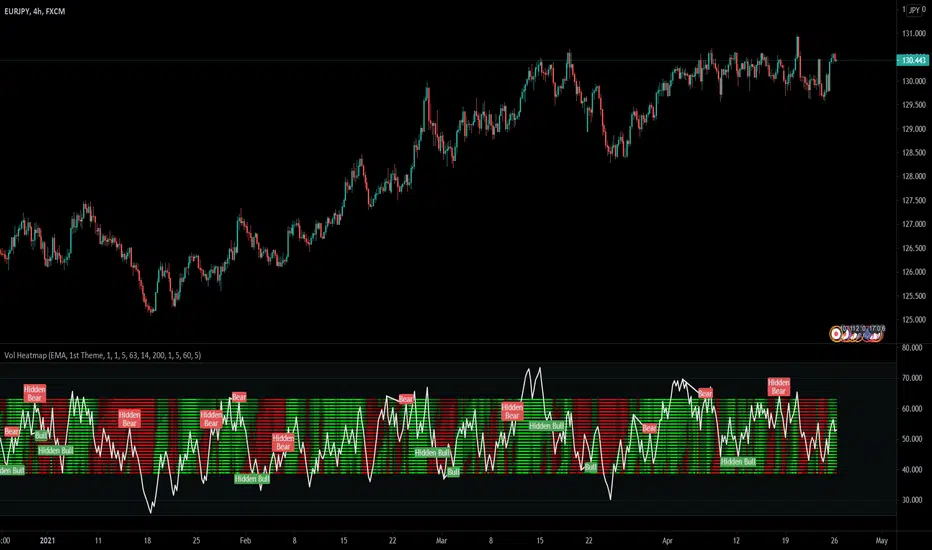
Mayfair Heatmap Volume 1.0This is our most popular indicator. It gives three separate signals and is best used on a 4H timeframe, to alert you to trading opportunities.
The heatmap area represents buying and selling pressure.
The white line works like a volume-driven RSI indicator, indicating overbought/oversold situations.
There is also a divergence indicator, represented by the Bear/Bull Hidden Bear/Hidden Bull markers, which show where the price action and the indicator's direction are moving in different directions.
Like all indicators, it is not perfect, and you should never rely on one indicator in any situation, but this one alerts you to opportunities, which you can then study on lower timeframes to find an entry.
(FireflyTA) BB Pressure HeatmapThis is a simple heatmap based on multi-timeframe Bollinger Bands to find range support & resistance . It makes dynamic confluence zones visible and can be used to add evidence to a thesis or as a basis for a custom range S&R trading strategy.
Colors are optimized for a dark chart layout.
There are currently 3 presets ( LTF , MTF, HTF) available in case you don't know how to customize the BB settings.
You need to add two of these to show support AND resistance at the same time.
Enjoy!

cheesywedges MTF MACD+Stoch+Ichi+PSARThis is a heatmap created to show 4 key indicators MACD, Stochastic, Ichimoku and PSAR. Adjust TF accordingly. Default is incremental by 45 minutes.
One advantage is you can see as the indicator current candles change from green to red or the other way round as the current trend changes. Eg. MACD attempting to cross Signal and the candle will flicker red to green and you can see it happen on multiple TF.
Standard Settings
PSAR - Start, Increment and Max Value
Stochastic - K,D,Smooth, Upper and Lower
MACD - Fast, Slow and Smooth
Ichimoku - Conversion Line, Base Line Periods, Lagging Span and Displacement
Advanced Settings (MACD)
MACD/Signal Crossover , eg. Long = MACD > Signal
MACD/Signal + Histogram Crossover , eg. Long = MACD > Signal and Hist > 0 and Signal > 0
MACD/Signal Crossing, eg. Long = MACD > Signal and previous MACD < previous Signal
MACD/Signal + Histogram Crossing, eg. Long = MACD > Signal and previous MACD < previous Signal and Hist > 0 and Signal > 0 and previous Hist > previous Signal
For normal usage, just use MACD/Signal Crossover
Recommended Settings
Ichimoku 20, 60, 120, 30
If customized enhancement required drop a message and I'll see what I can do.

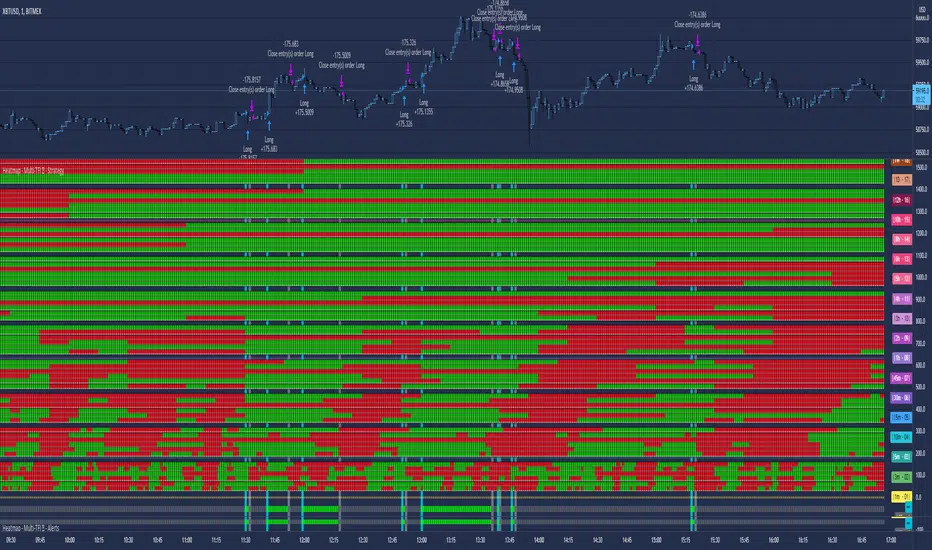
Heatmap - Multi-Timeframe Indicators - StrategyHeatmap - Multi-Timeframe Indicators - Strategy
▪ Main features :
- 19 Timeframes: 1m, 3m, 5m, 10m, 15m, 30m, 45m, 1h, 2h, 3h, 4h, 5h, 6h, 8h, 10h, 12h, 1D, 1W, 1M
- 6 indicators per timeframe
- choose specific timeframes for indicators (example - 1 hour)
- or choose specific timeframe ranges (example - 1 hour to 1 month)
The general idea is that the higher timeframe signals are stronger than the lower timeframe ones.
When a trend is starting, it is first visible on the lower timeframes.
The more time passes, the more the trend propagates through higher timeframes.
The default settings are meant to show all the available features. You may fine-tune it to your specific needs.
How to choose the timeframe for the chart : use the lowest of the choosen timeframes for indicators.
If the heatmap doesn't display correctly on your device, you may check the Heatmap Theme 🎨 setting.
It doesn't repaint.
"Repaint" version available though - good to check the past history, but very bad for real-time analysis.
▪ Indicators used for trend detection
1. MACD Cross
2. Stochastic Cross
3. Stochastic Cross and Overbought or Oversold
4. Moving Average
5. Parabolic SAR
6. Heikin Ashi
▪ Find the best Heatmap settings with the Strategy Tester version.
The signals generated by the Heatmap are considered to be valid at the bar open .
The Strategy Tester, however, uses the bar close in its calculations.
Therefore, the results may seem to be worse than they can be.
The Profitability, Profit Factor and other stats should be taken into consideration relatively to other configurations of the same Heatmap.
▪ Using a score system to consider a change in trend valid.
Example: consider the signal valid if 65% or more of all indicators (max 6) among all timeframes (max 19) hint at a change in trend.
The % percent value can be inserted in settings.
When using the default settings or when all timeframes and indicators are activated,
the ratio of 100% downtrend or 100% uptrend may be less occuring. Adjust accordingly.
The signals across timeframes and indicators are aggregated to show simple entry and exit signals.
▪ Combined Alerts, to be set to fire once per bar open :
0 - 📈 Long! - Heatmap - Multi-TFI
0 - 📈 Short! - Heatmap - Multi-TFI
0 - 📈 Long Exit! - Heatmap - Multi-TFI
0 - 📈 Short Exit! - Heatmap - Multi-TFI
1 *** BUY or SELL (single alert) ***
1 *** Entries or Exits (single alert) ***
▪ Note : The initial load may be slow. If something doesn't seem to work, you can try the following:
- wait more time for it to load
- hide & show or remove & add back to chart
- don't add the indicator to chart multiple times in a short amount of time, as you may be rate limited
▪ Related Studies :
- Heatmap - Multi-Timeframe Indicators - Alerts
- Risk Management System (Stop Loss, Take Profit, Trailing Stop Loss, Trailing Take Profit) - it can be connected to Heatmap - Multi-Timeframe Indicators - Alerts
▪ Layout example:

Heatmap - Multi-Timeframe Indicators - AlertsHeatmap - Multi-Timeframe Indicators - Alerts
▪ Main features :
- 19 Timeframes: 1m, 3m, 5m, 10m, 15m, 30m, 45m, 1h, 2h, 3h, 4h, 5h, 6h, 8h, 10h, 12h, 1D, 1W, 1M
- 6 indicators per timeframe
- choose specific timeframes for indicators (example - 1 hour)
- or choose specific timeframe ranges (example - 1 hour to 1 month)
The general idea is that the higher timeframe signals are stronger than the lower timeframe ones.
When a trend is starting, it is first visible on the lower timeframes.
The more time passes, the more the trend propagates through higher timeframes.
The default settings are meant to show all the available features. You may fine-tune it to your specific needs.
How to choose the timeframe for the chart : use the lowest of the choosen timeframes for indicators.
If the heatmap doesn't display correctly on your device, you may check the Heatmap Theme 🎨 setting.
It doesn't repaint.
"Repaint" version available though - good to check the past history, but very bad for real-time analysis.
▪ Indicators used for trend detection
1. MACD Cross
2. Stochastic Cross
3. Stochastic Cross and Overbought or Oversold
4. Moving Average
5. Parabolic SAR
6. Heikin Ashi
▪ Find the best Heatmap settings with the Strategy Tester version.
The signals generated by the Heatmap are considered to be valid at the bar open .
The Strategy Tester, however, uses the bar close in its calculations.
Therefore, the results may seem to be worse than they can be.
The Profitability, Profit Factor and other stats should be taken into consideration relatively to other configurations of the same Heatmap.
▪ Using a score system to consider a change in trend valid.
Example: consider the signal valid if 65% or more of all indicators (max 6) among all timeframes (max 19) hint at a change in trend.
The % percent value can be inserted in settings.
When using the default settings or when all timeframes and indicators are activated,
the ratio of 100% downtrend or 100% uptrend may be less occuring. Adjust accordingly.
The signals across timeframes and indicators are aggregated to show simple entry and exit signals.
▪ Combined Alerts, to be set to fire once per bar open :
0 - 📈 Long! - Heatmap - Multi-TFI
0 - 📈 Short! - Heatmap - Multi-TFI
0 - 📈 Long Exit! - Heatmap - Multi-TFI
0 - 📈 Short Exit! - Heatmap - Multi-TFI
1 *** BUY or SELL (single alert) ***
1 *** Entries or Exits (single alert) ***
▪ Note : The initial load may be slow. If something doesn't seem to work, you can try the following:
- wait more time for it to load
- hide & show or remove & add back to chart
- don't add the indicator to chart multiple times in a short amount of time, as you may be rate limited
▪ Related Studies :
- Heatmap - Multi-Timeframe Indicators - Strategy Tester
- Risk Management System (Stop Loss, Take Profit, Trailing Stop Loss, Trailing Take Profit) - it can be connected to Heatmap - Multi-Timeframe Indicators - Alerts
▪ Layout example:
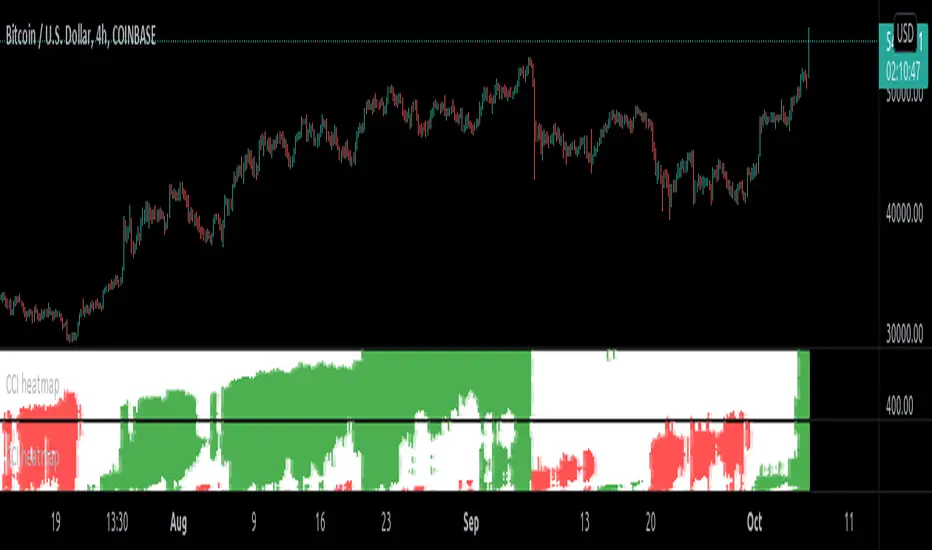
CCI heatmap(15-170)This is CCI (Commodity channel index) heatmap for the period lengths (15 to 170).
How to use :
1.) When overwhelming green appears, it means price is supposed to be trending up.
2.) When white appears, it means price is supposed to be neutral.
3.) When overwhelming red appears, it means price is supposed to be trending down.
Note: This indicator is supposed to be used with CCI heatmap(175-330) and CCI heatmap(335-490) aligned in increasing order of period lengths for higher resolution of period lengths. Otherwise use CCI heatmap(low resolution) indicator in which these 3 high resolution indicator is adjusted to a single indicator.
(Expect remaining indicator to be published to the public in mid of march 2021)
Profit Accumulator Heat MapHi Everyone
Happy to share this heat map packed full of indicators to make those trading decisions. There are a whole host of indicators including:
Inverse Fischer Transform
Moving Average Slope
EMA50 Crossover
Schaff Trend Cycle
MACD
RSI
Stochastic RSI
Moving Average Cross Over
Quantitative Qualitative Estimation
On Balance Volume
All of the indicators are customisable in the settings so you can adjust them to how you want.
I often find that the combination of MACD and QQE provide good early entry and exit signals.
Any comments or improvements then please feel free to get in touch.
Cheers
Mike
Big thanks go to @everget, @JustUncleL and @LazyBear for the use of their codes.

VolumeHeatmap | Experimental Version of Marketorders MatrixDear all,
I wish a Happy New Year!
The last time I tried to developing a Volume Heatmap, that the Marketorders made.
With the currently version I achieve my skills for that and I present it for everyone - some bugs I cannot solve today.
It also possible to see the POC - also the dynamic of volume developing:
The background for that is to find the pricelevel with the most volume - this is for valuetrading always the target.
If someone find it useful or have question - let me know!
Kind regards
NXT2017