Open Liquidity Heatmap [BigBeluga]Open Liquidity Heatmap is an indicator designed to display accumulated resting liquidity on the chart.
Unlike any other liquidity heatmap, this aims to accumulate liquidity at specific levels that build up over time, showing larger areas of liquidity.
🔶 FEATURES
The indicator includes the following settings:
Lookback : Used to determine the range calculation of the heatmap.
Leverage : Leverage of the liquidation (Counted as % in price, Example: 4.5 will return a distance from price of 4.5%, indicating any possible resting liquidity in this range).
Levels : Amount of levels to display (Each level is counted as liquidity resting on the chart; fewer levels will return a bigger area of liquidity sitting on the chart).
Mode : Apply a color gradient from the minimum liquidation to the maximum liquidity level. Set the maximum color gradient value (Counted as volume).
Offset : Automatically determine the offset range of the Volume Profiles. Manual offset of the Volume Profiles.
🔶 CALCULATION
for i = 0 to step - 1
float plotter = na
switch i
0 =>
plotter := hs
=>
plotter := hs - diff * ( i )
cls.hm.gnL(plotter)
cls.vp.put(plotter, 0)
We calculate levels like a normal volume profile with steps, from the highest point within the lookback to the lowest one. Each level will contain the corresponding amount of volume that the candle has closed in that range.
As we can see in the image above, we add liquidity each time the distance in % from price is between two levels.
Unlike many liquidity indicators that provide a single candle liquidity heatmap, this aims to add up liquidity (volume) in already present levels.
This can be extremely useful to see which levels are likely to be more liquid and tend to get a bigger reaction to the price.
Imagine it like a range of levels that each time price revisits that area, a new position area is added; we add volume in that area each time price visits that zone. Liquidity builds up in those zones, causing a bigger reaction to the price once the price visits it.
This indicator is not the same as a single candle heatmap like many others. What is a single candle heatmap?
A single candle heatmap is when a level is created on every new candle, coloring the level based on the total volume of it.
This indicator, on the contrary, aims to provide a more specific use by adding up liquidity each time price visits it.
🔶 BASIC DEMOSTRATION
This is a basic demonstration of how we can spot high liquidity points overall using confluence:
We see the POC of the liquidation in a low volume area of the normal volume profile adding up as confluence.
Resistance from the POC Volume Profile suggesting price will go lower.
Major long open liquidity down.
As we can see, price takes out all the long liquidity and right after pumping, indicating that all the major liquidity got taken out.
Some key note to take is that a POC in the liquidation heatmap in a low volume area of the normal Volume Profile add confluence of a possible big reaction in that zone.
In the forex market, we suggest to use a low distance from price (Leverage) while in a crypto market you can use the one that fit the best the current timeframe.
🔶 CONCLUSION
This indicator aims to show open resting liquidity that had built up over time, showing the most amount of liquidation in specific areas in an aggregated way unlike many liquidation heatmap indicators that show single-level liquidation.
🔶 RELATED SCRIPT
Heatmap

[LCS] Bar HeatmapThe script is an overlay aimed at making price action within a range more comprehensible, i.e. what is the “story” that the band range is telling in relation to the price. You’ll see bars become brighter as they come near the upper or lower band, and dimmer around the average/middle of the two bands. This makes it easier to spot when the price is within an oversold or overbought area or when its experiencing a strong trend movement. The color shift from one to the other can also give a sense as to whether the price action is changing character (going from bullish to bearish or vice versa).
Settings are available for customization to the user's liking.
How to use:
1. Add the indicator.
2. Add another indicator to use as the source, such as Bollinger Bands, which provides upper and lower plots for a channel range.
3. Click the gear icon to access the indicator settings.
4. Mandatory: Select the Upper Band and Lower Band settings as the upper and lower plots from your source indicator of choice to define the range.
5. Save settings. You should now see bars on your chart.
6. Access the Chart Settings (not the indicator settings) and hide the Body, Borders, and Wick for the default candle bars to avoid overlap.
You may need to perform additional configuration steps in your source indicator to appropriately size the range of the upper and lower band plots for a meaningful visualization.

RSI_CMO_ScannerHave you ever wanted to scan across many tickers and monitor an indicator across time for these selected tickers?
Have you ever wanted to monitor the Mag7 and SPY simultaneously and watch a divergence take place real time across all selected tickers?
With this indicator, you can now view 100 tickers (in batches of 10) for either Stocks, Crypto or Forex, with a HeatMap visualisation for the selected timeframe.
This particular indicator utilises the RSI or the CMO to provide this view, where colors change from deep red (low values) to dark green (high values) and provide the HeatMap sense of how this metric changes across time.
The values within the labels can be switched on and off from the Settings, depending on the user's preference.
Additionally, the tickers can be selected through the Settings from the Stocks, Crypto or Forex groups
The originality and usefulness of this indicator is that it provides a simultaneous view across batches of 10 tickers for a lookback of values in the given timeframe. Also, the view is served as a heatmap, for a visual understanding of the fluctuation over time.
The same logic can be applied to a variety of indicators, besides the RSI and the CMO.

[Excalibur][Pandora][Mosaic] Ultra Spectrum Analyzer@veryfid, you will always be remembered eternally...
ANCIENT MYTHOS AND LORE:
The retellings of "Pandora's Box" serve as a cautionary metaphor depicting an opened container (pithos - jar) that once held profound perils and evils — sufferings that are experienced around the world in various forms. The known and vague mythical box contents actually represent manifestation of evils, situational adversities, and human disparities that have been encountered throughout life for aeons. In contemporary times, a meager list of ordeals would include incidents of deceit, betrayal, corruption, oppression, greed, envy, depravity, conflict, mania, affliction, plague, and mortality. However, as the tale is told, kept and remaining inside the box was the essence of expectant hope (elpis), which may represent the optimism and resilience to overcome immense hardships.
There are other versions of the classic story where Pandora isn't actually the culprit, being her husband Epimetheus was the lid lifting perpetrator and the one who always and actually received the gift(s). Curiously, the interpreted Greek word ‘Pandora’ translated to English, can mean either "all-endowed" or "all-gifting". Much like Pandora herself, who was formed from clay of the earth, the jar also would have been most likely crafted from clay. Conceived as a made-to-order maiden for an arranged marriage, Pandora was given qualities of exquisite beauty, persuasive charm, all while being adorned with jewelry and fine clothing. Olympian premeditated preparations in the didactic fable of 'Works and Days' by Hesiod had blamable intent and would be later used for centuries as denigration of women/mothers. The rest of Hesiod's tale is even worse.
In reality, the entire contrived exploit of incarnating Pandora as a trojan temptress was solely intended as an instrument of infiltration and entrapment for delivery to Epimetheus as an arranged seductive snare. Being a man myself, I find it appalling how the antiquated writings of ancient morphological men have repeatedly ostracized women for many of the ailments of mankind. When in truth, it is far more often that despicable men are the recorded all time winning historical harbingers of global abysmal darkness by means of ideological treachery. Vast historical chronicles since antiquity have frequently recorded who the typical real-world villains truly are and are not. As the stories are told in the first place, it was dictator Zeus along with his Olympian conspirators, who intently implanted malicious spirits into a gifted receptacle to orchestrate planetary suffering and carnage on humankind.
PROLOGUE:
I believe, it is way past overdue to restore Pandora's name to a place of better standing. As I have been peaking into a theoretical pitcher of mathematic mysteria for years now, where no one else dares to look. Once upon a time, I pondered an opposite notion: What if Pandora was originally conceived to solve global problems instead of creating them? Maybe Pandora could have been wielded into existence to wage unrelenting and avenging retribution on every dominance hierarchy and each diabolical enemy intently hostile to humankind. My hypothetical version of Pandora would take the notion of "mors omnibus tyrannis" to a whole other fearsome magnitude. She would cause evil arrogant men to tremble with sheer horror... the kind of fear ALL false gods, despotic kings, tyrannical dictators, controligarchies, and criminal syndicates truly worry about at night. In my opinion, that would be a better fictional story worthy of retelling for aeons.
One unique goliath 21st century adversary is LAG and it must be subdued or minimized. This unyielding nemesis is also known as group delay, processing delay, and algorithmic latency. My eyes are locked onto this opponent with fixation that will never surrender a staring contest. The formidable creature lag is my daily arch enemy destined for defeat in battle. It's losing time after time and bar by bar during the past year of 2023. In my attempts to peer through the murky darkness of useless and deceptive information, I am confident that I have found more suitable answers to many current dilemmas of algorithmic lag.
The internet, using mathematics and the speed of light as a planetary beneficial advantage, has already performed wonders by drastically reducing the delay of dissemination of knowledge. This has garnered a mostly positive rapid acceleration of economic evolution. However, hierarchies of dark forces of chaos and subversion by the thousands lurking in the global shadows are not thrilled about well informed populations. In the present era, new spectrums of strife within planetary societies are being waged, one of the worst forms taking the hideous form of censorship. Other nefarious tactics are hindering economic progress with substantial negativity using heavily funded penetration and infiltration operations. Those sinister operational varieties are spanning psychological, cultural, educational, digital, financial, electoral, scientific, medical, biological, commercial, infrastructural, institutional, and organizational domains.
They are mistakenly meddling with the entire primordial order of planetary natural dynamics. The miscalculations from these malevolent CAUSES will be countered with EFFECTS of immense retaliatory primal veracity having equal or exceedingly more powerful opposition with overwhelming numbers in mass. It is a law embedded within the universe that supersedes ALL laws, known as 'causality'. Everyone, especially programmers, know exactly what to do with predatory infiltrating cockroaches... When tyranny becomes enforced law by agendized policies in any land, order = abs(DUTY) * pow(RIGHT) * exp(PEOPLE).
FUTURE ECONOMIC ADVERSARIAL CHALLENGES:
Just as programmers have to critically analyze our code for BUGS, a scrutinized analysis of the current world around us is at times necessary. It is an empirical statistical fact that a few percent of captains at the helm of industry, commerce, institutes, and governance are monetarily psychopathic. They are often hidden bugs operating within national systems. The subsequent economic consequences result in effects that aren't always clearly obvious to all. Here are a few global economic security issues...
Corrupted immoral code in national operation is an inevitable breakdown waiting to happen. In the harsh future to follow, old degenerate interdependent control systems will need to be dismantled and discarded, eventually succeeded by having resilient parallel arrangements with robust independent fidelity. The coming successive paradigm shifts would include future hardware and the hefty novel algorithms that will run on them afterwards. Evolution is inevitable! The internet must be upgraded and continually programmed securely to the near hardness of diamonds at multiple layers within the operational code to retain peaceful global integrity between international collaborations.
DigitalID is never going to fix an insecure vulnerable titanic network of devices full of holes taking in megatons of water from every direction. Weaponized digital mucking ID dead on arrival is certainly NOT a one size fits all solution and it still doesn't do diddly-squat to secure the internet's DNA as executable code. DigID's real purpose is to manage servitude digitally and keep citizens right where they want them, as subservient slaves.
There is a very specific reason why we have key chain rings in OUR pockets with numerous private keys evolving technologically over time to robustly safeguard individual locks we use every day, duh. AI becoming an artificial sentient hyper intelligence may sooner or later become a potential hazard, especially if it breaks AES192 into a thousand shards of glass. Perilous aspects from artilects will emerge and are coming swiftly. AI is already being weaponized and tasked to mind muzzle expressions of human consciousness.
Also, EMPs from the sun ARE an imminent planetary threat, and no amount of carbon taxation schemes inciting anthropomorphic climate hysteria originating from falsified modeling hocus-pocus is going to protect against extreme solar cycle related X-class phenomena. Our solar system candle called the sun, is not consistently energy irradiation stable if you just glance at SOHO images/video. There are very obvious cyclical frequencies within the dynamics of the sun's energetic activity that affect planets far beyond earth. The earth already has a built-in natural thermometer indicating that oceans have been rising very linearly for thousands of years since the last ice age, submerging entire ancient cities under coastal water dozens of meters.
BEAR with me and pardon my French translation, but I have the option to call major league climate BULLshite. There is no hardcore "anthropomorphic climate crisis" proof. It is a crisis in failed modeling that is insufficient to properly estimate colossal computations with dircet limited empirical data with enough accuracy to anticipate higly probable future outcomes. People deserve solid science instead of slanderous smackdowns and slighted statistics. 400ppm of atmospheric CO2 is nothing compared to previously existing 1600ppm concentrations acquired from ancient indirect historical observations at a time when early humans were hunter gatherers driving gas guzzlers.
Western climate-monger fortune tellers are scamming every nation on earth, betraying the collective human species worldwide by climate hype strangulation. Wait until the sheeple with dinner forks turn on the rabid wolves in shepherds's clothing; it has already begun. What these predatory profiteering fraudsters are not telling you is WATER (H2O) in earth's atmosphere is the all time dominating and potent greenhouse gas, always has been, not CO2. Dr. Willie Soon has explained it in the best of ways with clarity. Misleaders, banksterCorpses, and mediaPresstitutes are immensely involved in this hot model scheme and like keeping people right where they want them, force fed with mental filth with regularly scheduled socially engineered programming.
Beware of agendas and isms. The ESGovernanceAgenda is ready made economic coffin nails. I'll explain this very simply, a future green war on carbon is a silent war on carbon lifeforms and economies. Many of the smiling faces you can actually see on the world stage pulling levers are often the coldest blooded deceivers beyond anything you can ever imagine. In truth, corporate agents and policies are the greatest devastators to ecologies, while in concert, they are incessantly waging blame campaign agendas with subversive narratives by targeting consumers as the wrongdoers.
Why am I mentioning all these adversarial difficulties? Well, the intertangling myriads of tomorrow's "bundle of burdens" in a future box ALL have to be thoroughly analyzed, sifted through, and dealt with tenaciously now and in the future by generations to come in every nation state. Some days I wonder if Hesiod's fiction was taken from reality over 2000 years ago to WARN future world inhabitants. In the scope of economics, the series of incidents that have or will lead up to major world events, will need to have the frequency of related occurrences examined that lead up to crucial points in time historically. In order to prevent future disparities, our progeny will look backwards into history with ultra clarity and vigilance to see how corrupted society once was by hordes of overlords twisted by obsessive delusions of absolute power over the entire human species. There is no human race, only diverse genetic multiformity expressed from the DNA code of humankind exists.
We can't simply put the lid back on low entropy hydroCarbons and a broadband globalNet without having an implemented proven replacement or upgrade. It's far too late, leaving only wiser security chess moves forward as the only viable options. Nikola Tesla was dreaming of this daily in order to build every foundation of modern civilization that we now enjoy today and take for granted. Humanity still has to evolve by unlocking hidden secrets of mother nature. For instance, nations powered by endless geothermal electricity and deuterium fusion WILL solve a lot of the world's problems. Imagine our world dominantly powered by extreme abundant amounts of heavy water... Lady destiny awaits and begs for the future to be built securely, by eventual abandonment of antiquated wheelworks that eventually deserve to be hurled into the annihilatory dustbin of history.
SPECTRAL BURDENS:
Ephemeral 'spectral contents' are extremely difficult to decipher with the least amount of lag, especially while they reside within a noise ridden non-stationary environment. When 'lifting the lid off' of series analysis to peek with quick discernment, distinguishing between real-time relevant signals differing from intertwining undesirable randomness in a crowded information space, requires special kinds of intricate extraction. Due to the nature of fractal chaos, any novel spectral method is better than the scanty few we have now. Firstly, let's comprehend agilities of interpreting a spectrum's structure...
SPECTRAL ANALYSIS PURPOSE AND INTENTION:
Frequency Analysis - Spectral analysis serves a crucial purpose in unraveling the frequency composition of a signal. Its primary intention is to explore the intricacies of a dataset by identifying dominant frequencies and unveiling inherent cyclical patterns. This foundational understanding forms the basis for improving analyses.
Power Spectrum Visualization - The visualization of a signal's power spectrum is a key objective in spectral analysis. By portraying how power is distributed across different frequencies, the goal is to provide a visual representation of the signal's energy landscape. This insight aids with grasping the significance of various frequency components obtained from a larger whole.
Signal Characteristics - Understanding the traits of a signal is another vital goal. Spectral analysis seeks to characterize the nature of the signal, unveiling its periodicity, trends, or irregularities. This knowledge is instrumental in deciphering the behavior of the signal over time, fostering a deeper comprehension.
Algorithmic Adaptation - Spectral analyzer estimation can play a pivotal role in algorithmic development. By assisting with the creation of algorithms sensitive to specific frequency ranges, one possible advantage is to enable real-time adaptability. This adaptability approach may allow algorithms to respond dynamically to variations in different spectral components, potentially enhancing their efficacy.
Market Analysis - In the realm of trading systems and financial markets, spectral analysis methods can serve as applicable functions when studying market dynamics. By 'uncovering' trends, cycles, and anomalies within financial instruments, this analytical proficiency can aid traders and algorithm developers with making better informed decisions based on the spectral attributes of market data.
Noise/Interference Detection - Another purpose of spectral analysis is to identify and scrutinize undesirable elements within a signal, such as noise or interference. One benefit would be to facilitate the development of strategies to mitigate or eliminate these unwanted components, ultimately refining the quality of a given signal with filtration.
INTRODUCTION:
Allow me to introduce Pandora! What you see in the demonstration above, I've named it "Pandora Periodogram", which is also referred to as 'Ultra Spectrum Analyzer' (USA) for technical minds. Firstly, this is NOT technically speaking an indicator like most others. I would describe it as an avant-garde cycle period detector obtaining accurate spectral estimates on market data with Pine Script v5.0. USA is a spectral analysis cryptid that I can only describe as being an alien saber in nature. It is my rendering of spectral wrath unleashed. With time and history to come, my HOPE is this instrument will reveal Excalibur like aspects capable of slicing up a spectrum craftily, traits long thought to be a mythical enigma.
It is not modified forms of either Autocorrelation Periodogram (ACP) or MESA. Pandora's Periodogram embodies an entirely distinct design, adorned with glamourous color, by incorporating several of my most profound, highly refined technological innovations that I have poetically composed into being. What I have forged in Pine, has essentially manifested as a zero lag spectrum analyzer. Pandora easily peeks inside a single signal source more effectively to inspect for hidden spectres, revealing invisible apparitions inside data with improved clarity...
My 'Ultra Spectrum Analyzer' bears an eerie likeness to Autocorrelation Periodogram, but it possesses no autocorrelation and the other small hindrances of ACP that I formerly encountered. While ACP does have a few shortcomings, a few bars of lag, and high frequency bias, it is still phenomenal code. ACP is one answer to spectral enigmas, but not the only one. Developers can utilize this detector by creating scripts that employ a "Dominant Cycle Source" input to adaptively govern algorithms. If you are capable of building suitable algorithms for direct tethering to Autocorrelation Periodogram, then this is your next step in evolutionary application to tether to when you are ready. ACP is a good place to start building upon as an exploratory vessel, before you might ponder using USA. Once you do obtain dynamic ACP sweetness with only a few pesky bars of dominant cycle induced lag, USA may be your tool chest choice without the burden of subtle ACP lag.
USA is possibly the end of my quest for spectral bliss, for the time being. However, I still suspect there is more room for upgrades to Pandora in the future. I must mention, as an overture, this won't be the last of Pandora tech that you will witness, as my literal "out of the box thinking" will unleash many additional creations upon this Earth. The "Power of Pine" merely serves as the beginning foundational phase... Some of my futuristic dreams and daydreams of TradingView are droplets in a wavy ocean of economic providence and potential.
What I am crafting in poetic form is born out of raw curiosity. Future creations are probably best kept private for now, but I will present my future tech with beauty and elegance as it should rightfully be. There's one catch, I have absolutely no idea what this and my future marvels may do to the future of digital signal processing (DSP) and markets. I do fear any insane AI or MALEficent entity ever seeing this code. My innermost hopes and ambitions are always focused on achieving the best result obtainable. What the future can hold, may be absolutely exquisite to gaze upon, maybe even monstrous, or possibly a combination of both.
Notice: Unfortunately, I will not provide any integration support into member's projects at all. My own projects demand too much of my day to day time. I hope you understand. Meanwhile, I'll be applying this on future indication until Mr. Mortality sneaks up behind me.
FEATURES AND CHARACTERISTICS:
I have included as much ultra adjustability as I can humanly muster. Those features being the following and more...
Color Preferences - Four vivid color schemes are available in the original release. The "Ultra Violet" color scheme, in particular, contributes to the indicator's technical title, as it seems to me to reveal the greatest detail of my various spectral color schemes. Color inversion of the four color schemes is also possible, yielding eight schemes in total with predator style visuals. Heatmap transparency control is also provided.
Lag Control - Pandora achieves zero lag spectral approximations, with the added capability to control lag using an input for selectable delay. Note, however, that testing less than zero lag has not been assessed thoroughly due to potential unforeseen instability concerns. Adjustments are provided in either direction for further testing.
Spectral Bias Mitigation - Options for mitigating high OR low-frequency spectral biases are present. One interesting tweak made during development was a subtle form of spectral manipulation, involving a partial reduction of frequency amplitudes influencing either the highest or lowest periodicities. This slightly reduces the impact on the upper and lower portions of the spectrogram and the dominant cycle measurement. What initially surfaced as an unexpected discovery, may now be considered worthy of experimental utility.
Adjustable Periodogram Window Size - The periodogram is adjustable for various window sizes of periodic operation. Exploration up to a periodicity of 59 is obtainable for curiosity's sake. This flexibility challenges the notion that curiosity isn't always a negative trait, contrasting with Hesiod's ancient perspective.
Dominant Cycle Filtration - Filtration of the dominant cycle is achieved with a novel smoother having reduced lag, easily surpassing SuperSmoother's performance. However, defeating lag completely on that one plot() function was elusive.
Tooltips for Control Intention - The settings commonly include handy and informative tooltips that provide information eluding to the intention behind the various controls provided.
Initialization Advantages - Initialization of USA accomplishes what Autocorrelation Periodogram (ACP) didn't. Spectral analysis begins on the earliest visible bars, starting at period 2. Users need to ensure their algorithm's integrity from period 2 upwards to beyond 40ish, establishing a viable operational range for dynamically governing those algorithms. It's notable that stochastics and correlations have a minimum operable critical period of 2, distinct from most low-pass filters that can actually achieve a period of 1 (which is the raw signal itself). Proper initialization of complex IIR filters is particularly effective, especially with smaller initialization periods.
Remaining options and features are comparable to my Enhanced Autocorrelation Periodogram in terms of comprehension, and other upgrades may be added in the future upon discovery.
PERIODOGRAM INTERPRETATION:
The periodogram heatmap renders a power spectrum of a signal visually by color, where the y-axis represents periodicity (frequencies/wavelengths) and the x-axis is delineating time. The y-axis is divided into periods, with each elevation portraying demarcation of periodicity. In this periodogram, the y-axis ranges from 4 at the very bottom to 49 (or greater) at the top, with intermediary values in between, all conveying power of the corresponding frequency component by color. The higher the position ascends on the y-axis, the longer the cycle period or lower the frequency. The x-axis of the periodogram signifies time and is partitioned into equal chart intervals, where each vertical column corresponds to the time interval when the signal was measured. Most recent values/colors are on the right side of the periodogram.
Intensity of the colors on the periodogram signify the power level of the corresponding frequency or cycle period. For example, the "Fiery Embers" color scheme is distinctly like heat intensity from any casual flame witnessed in a small fire from a lighter, match, or campfire. The most intense power exhibited would be represented by the brightest of yellow, while the lowest power would be indicated by the darkest shade of red or just black. By analyzing the pattern of colors across different periods, one may gain insights into the dominant frequency components of the signal and visually identify recurring cycles/patterns of periodicity.

AlgoRhythmica - Liquidity MapThe AlgoRhythmica - Liquidity Map is a complex and performance heavy indicator, attempting to visualize and highlight areas of liquidity on the chart. It paints lines above and below price with different color and opacity based on the volume, and then highlight the areas with the highest cumulative volume.
What is liquidity and a liquidity map?
Liquidity refers to how quickly and easily an asset can be bought or sold in the market without affecting its price. High liquidity means that there are many buyers and sellers, and transactions can happen rapidly and smoothly.
Liquidity analysis involves examining where and how liquidity is distributed across different price levels.
Price often moves from liquidity zone to liquidity zone, and therefore, having an idea of where those zones are can give traders an understanding of potential support and resistance levels and where significant trading activities might occur.
Those looking to fill large buy orders for example would want to do that in liquid sell areas and vice versa. This indicator attempts to estimate the price levels where traders using leverage get liquidated, and therefore creates liquid areas for buying and selling.
In contrast to Bookmaps which chart the orders in the order book where traders want to transact, a liquidity map is charting where traders are 'forced' to transact due to stop-losses or margin calls. To do that, liquidity maps are mostly based on estimations. It could be based on pivot points, common stop-loss amounts, common leverage amounts or a combination of multiple factors.
As of the current version on release, this indicator is only using the leverage input by the user to estimate the liquidity.
How does it work and what makes it unique?
The indicator takes the volume in a candle and saves that volume in a line. Based on the leverage settings it then offsets that line above and below price. Say, a trader using 20x leverage without a stop-loss gets liquidated if price goes roughly 5% in the wrong direction. Therefore, by assuming common leverage amounts or common risk amounts, we can estimate where traders get liquidated or have their stop-losses based on their leverage or amount they are willing to risk.
Now keep in mind, this liquidity map is just estimating based on general assumptions, it doesn't have access to actual liquidity data.
But at the same time, we're not trading single individual traders, but we're trading the market as a whole, and interestingly enough, some risk and leverage amounts are more common than others. People like using those even numbers like 10x, 20x, 1% risk etc. That's why price do often react on the liquidity in liquidity maps such as this one.
So, when a candle is printed, and you are on a smaller timeframe and decided this is just the kind of market for 100x scalpers. You set the leverage to 100x in the settings and the indicator will paint lines above and below price offset by 1%. There are settings for three leverage amounts at the same time, so you might also set it to paint lines at 5% and 10%, just to catch those traders on higher timeframes if price really takes off.
Now let's talk about what makes this indicator really shine and stand out!
Normally, if we just left the indicator doing as above, there would be lines all over the place and very difficult to interpret which areas matter, or we could limit the indicator to only print lines at high volume candles. Now, you do have that option, but that wouldn't pick up areas where low volume trading has cumulated in the same range, such as over a weekend or during market gaps. Where other liquidity indicators out there might miss that liquidity, this indicator has several solutions for it.
The first solution is stacking semi-transparent lines on top of each other. Normally, lines of the same color and transparency wouldn't add and blend together. But this script offers a seamless transition from one color the next, blending those low volume liquidity lines together.
The second solution, and this is what I believe is really unique and powerful, is that this indicator also has the ability highlight certain liquidity. When enabled, it scans through all the lines, cumulate the volume within a specified range around the lines and then compare the cumulated volume range with the ranges around the other lines. New lines created in the range with the highest cumulated volume gets highlighted.
Without this feature you wouldn't necessarily be able to tell which of two strong areas are more liquid. When price later enters that area and crosses those lines, the liquidity there is then considered consumed and lines created in a different range will now begin to highlight.
All of this is of course enhanced, as in the picture above, when multiple copies of the indicator is used together and assigned to only calculate specific parts of the liquidity map, such as longs, shorts or specific leverage amounts.
Oh, and there's also options for assigning which part of the candle should generate the liquidity. Close, Middle Body or Open. The indicator will then assume that the majority of traders are entering their position in that part of the candle.
The offset is calculated from that part of the candle. By using multiple copies of the indicator, you can assign one for each part and that will give you the whole range of the candle. And you might assume more traders go long from the top, so to emphasize that liquidity, you could increase the size or transparency slightly of the lines generated from that part.
How do I use it?
Well, this isn't gonna give you trading signals or anything, but it will visualize the market for you in a new perspective.
Typically, high liquidity areas are often good areas for entry and TP. But always watch how the price reacts in those areas before entering a position. And remember, the liquidity estimation might not always be accurate.
Particularly watch the highlighted areas for long wicks and high volume, indicating that the liquidity was enough to meet the orders and a retrace or reversal could be imminent.
Watch what happens during consolidation, market gaps and weekends. Notice the lack of liquidity and how the market maker creates liquidity by inducing traders to take positions with quick moves that instantly reverses. You might know how that works in theory, but watching it happen real-time with visualized liquidity is very interesting.
While not necessary, and as I've mentioned earlier, dividing the different functions of the indicator on multiple copies will substantially increase it's accuracy and performance!
For example, use one copy of the indicator per leverage level, or one for shorts, one for longs. One that generates from the close, one from the middle etc. creating a much clearer picture of the liquidity like the picture comparison above.
This is what the indicator offers:
When you're estimating liquidity, you want to be able to do it with accuracy and interpretability. That's why the customization options of this indicator has been really important in the development.
Timeframe Options:
It supports a wide range of time periods, from daily to yearly, enabling traders to apply it across various trading strategies, from short-term day trading to long-term investment analysis. Assuming traders are eventually taking their profits, liquidity after the set time period disappears.
Rich Visual Settings:
The indicator comes with multiple preset color themes and a completely customizable option as well. These visual settings are designed to enhance the interpretability of liquidity data, with adjustable transparency and contrast features.
Liquidity Highlighting Function:
This unique feature emphasizes areas with high liquidity concentration. It scans and highlights significant liquidity zones, aiding traders in identifying critical market levels.
Liquidity Profile:
The LQ-Profile extends liquidity lines based on their associated volume, giving traders another way of identifying high liquidity zones.
Adjustable Liquidity Estimation:
Select and adjust leverage amounts based on your particular chart and analysis. Choose what positions and leverage amounts to display liquidity for. You also have the option to determine if wicks consume liquidity or not.
Since wicks indicate that price was rejected from that area, it doesn't necessarily mean all the liquidity in that area was consumed. You could assign an additional copy of the indicator consuming with wicks and another that doesn't. That way, half the liquidity gets consumed and the other half remains until another candle closes in that area. They choices are endless and it's all about your understanding and analysis here.
Multiple Performance Options:
Depending on your particular chart and timeframe, this indicator can be very performance heavy to load. Luckily it has plenty of performance options for limiting the calculations of the indicator.
Tooltips:
As usual, this indicator comes with extensive tooltips for every function, making sure you understand every part of it.
Happy trading!

Volume Heatmap 2024 | NXT2017 Christmas EditionHi big players around the world,
I wish you a merry christmas time.
Today I have a nice present for you: a new volume heatmap indicator for free using!
HISTORY
My first volume heatmap project got a lot of feedback and a big demand. You can find it here:
In this time pinescript version 4 was the newest one and I worked the first time with arrays.
Today we have pinescript version 5 and some new features. This is why I tried again with matrix function and the results are better than I expected.
HOW IT WORKS
The indicator calculates similar like the volume profile. It looks back and every volume where the close price is on the same row area, the volume will cumulated. How much rows the new chart view is showing, you can choose manually.
The mind behind this is to find high volume levels, where high volume catch the price in a range or get function as support/resistance line.
PICTURES
I hope it helps for your trading. You are welcome to give some comments.
Merry christmas and best regards
NXT2017

RSI Heatmap Screener [ChartPrime]The RSI Heatmap Screener is a versatile trading indicator designed to provide traders and investors with a deep understanding of their selected assets' market dynamics. It offers several key features to facilitate informed decision-making:
█ Custom Asset Selection:
The user can choose up to 30 assets that you want to analyze, allowing for a tailored experience.
█ Adjustable RSI Length:
Customize your analysis by adjusting the RSI length to align with your trading strategy.
█ RSI Heatmap:
The heatmap feature uses various colors to represent RSI values:
█ Color coding for labels:
Grey: Signifies a neutral RSI, indicating a balanced market.
Yellow: Suggests overbought conditions, advising caution.
Pale Red: Indicates mild overbought conditions in a strong area.
Bright Red: Represents strong overbought conditions, hinting at a potential downturn.
Pale Green: Signals mild oversold conditions with signs of recovery.
Dark Green: Denotes full oversold conditions, with potential for a bounce.
Purple: Highlights extremely oversold conditions, pointing to an opportunity for a relief bounce.
█ Levels:
Central Plot and Zones: The central plot displays the average RSI of the selected assets, offering an overview of market sentiment. Overbought and oversold zones in red and green provide clear reference points.
█ Hover Labels:
Hover over an asset to access details on various indicators like VWAP, Stochastic, SMA, TradingView ranking, and Volume Rating. Bullish and bearish indicators are marked with ticks and crosses, and a fire emoji denotes heavily overextended assets.
█ TradingView Ranking:
Utilize the TradingView ranking metric to assess an asset's performance and popularity.
Thank you to @tradingview for this ranking metric.
█ Volume Rating:
Gain insights into trading volumes for more informed decision-making.
█ Oscillator at the Bottom:
The RSI average for the entire market, presented in a normalized format, offers a broader market perspective. Green indicates a favorable buying area, while red suggests market overextension and potential short or sell opportunities.
█ Heatmap Visualization:
Historical RSI values for each selected asset are displayed. Red indicates overbought conditions, while green signals oversold conditions, helping you spot trends and potential turning points.
This screener is designed to make entering the market simpler and more comprehensive for all traders and investors.

Volume and Price Z-Score [Multi-Asset] - By LeviathanThis script offers in-depth Z-Score analytics on price and volume for 200 symbols. Utilizing visualizations such as scatter plots, histograms, and heatmaps, it enables traders to uncover potential trade opportunities, discern market dynamics, pinpoint outliers, delve into the relationship between price and volume, and much more.
A Z-Score is a statistical measurement indicating the number of standard deviations a data point deviates from the dataset's mean. Essentially, it provides insight into a value's relative position within a group of values (mean).
- A Z-Score of zero means the data point is exactly at the mean.
- A positive Z-Score indicates the data point is above the mean.
- A negative Z-Score indicates the data point is below the mean.
For instance, a Z-Score of 1 indicates that the data point is 1 standard deviation above the mean, while a Z-Score of -1 indicates that the data point is 1 standard deviation below the mean. In simple terms, the more extreme the Z-Score of a data point, the more “unusual” it is within a larger context.
If data is normally distributed, the following properties can be observed:
- About 68% of the data will lie within ±1 standard deviation (z-score between -1 and 1).
- About 95% will lie within ±2 standard deviations (z-score between -2 and 2).
- About 99.7% will lie within ±3 standard deviations (z-score between -3 and 3).
Datasets like price and volume (in this context) are most often not normally distributed. While the interpretation in terms of percentage of data lying within certain ranges of z-scores (like the ones mentioned above) won't hold, the z-score can still be a useful measure of how "unusual" a data point is relative to the mean.
The aim of this indicator is to offer a unique way of screening the market for trading opportunities by conveniently visualizing where current volume and price activity stands in relation to the average. It also offers features to observe the convergent/divergent relationships between asset’s price movement and volume, observe a single symbol’s activity compared to the wider market activity and much more.
Here is an overview of a few important settings.
Z-SCORE TYPE
◽️ Z-Score Type: Current Z-Score
Calculates the z-score by comparing current bar’s price and volume data to the mean (moving average with any custom length, default is 20 bars). This indicates how much the current bar’s price and volume data deviates from the average over the specified period. A positive z-score suggests that the current bar's price or volume is above the mean of the last 20 bars (or the custom length set by the user), while a negative z-score means it's below that mean.
Example: Consider an asset whose current price and volume both show deviations from their 20-bar averages. If the price's Z-Score is +1.5 and the volume's Z-Score is +2.0, it means the asset's price is 1.5 standard deviations above its average, and its trading volume is 2 standard deviations above its average. This might suggest a significant upward move with strong trading activity.
◽️ Z-Score Type: Average Z-Score
Calculates the custom-length average of symbol's z-score. Think of it as a smoothed version of the Current Z-Score. Instead of just looking at the z-score calculated on the latest bar, it considers the average behavior over the last few bars. By doing this, it helps reduce sudden jumps and gives a clearer, steadier view of the market.
Example: Instead of a single bar, imagine the average price and volume of an asset over the last 5 bars. If the price's 5-bar average Z-Score is +1.0 and the volume's is +1.5, it tells us that, over these recent bars, both the price and volume have been consistently above their longer-term averages, indicating sustained increase.
◽️ Z-Score Type: Relative Z-Score
Calculates a relative z-score by comparing symbol’s current bar z-score to the mean (average z-score of all symbols in the group). This is essentially a z-score of a z-score, and it helps in understanding how a particular symbol's activity stands out not just in its own historical context, but also in relation to the broader set of symbols being analyzed. In other words, while the primary z-score tells you how unusual a bar's activity is for that specific symbol, the relative z-score informs you how that "unusualness" ranks when compared to the entire group's deviations. This can be particularly useful in identifying symbols that are outliers even among outliers, indicating exceptionally unique behaviors or opportunities.
Example: If one asset's price Z-Score is +2.5 and volume Z-Score is +3.0, but the group's average Z-Scores are +0.5 for price and +1.0 for volume, this asset’s Relative Z-Score would be high and therefore stand out. This means that asset's price and volume activities are notably high, not just by its own standards, but also when compared to other symbols in the group.
DISPLAY TYPE
◽️ Display Type: Scatter Plot
The Scatter Plot is a visual tool designed to represent values for two variables, in this case the Z-Scores of price and volume for multiple symbols. Each symbol has it's own dot with x and y coordinates:
X-Axis: Represents the Z-Score of price. A symbol further to the right indicates a higher positive deviation in its price from its average, while a symbol to the left indicates a negative deviation.
Y-Axis: Represents the Z-Score of volume. A symbol positioned higher up on the plot suggests a higher positive deviation in its trading volume from its average, while one lower down indicates a negative deviation.
Here are some guideline insights of plot positioning:
- Top-Right Quadrant (High Volume-High Price): Symbols in this quadrant indicate a scenario where both the trading volume and price are higher than their respective mean.
- Top-Left Quadrant (High Volume-Low Price): Symbols here reflect high trading volumes but prices lower than the mean.
- Bottom-Left Quadrant (Low Volume-Low Price): Assets in this quadrant have both low trading volume and price compared to their mean.
- Bottom-Right Quadrant (Low Volume-High Price): Symbols positioned here have prices that are higher than their mean, but the trading volume is low compared to the mean.
The plot also integrates a set of concentric squares which serve as visual guides:
- 1st Square (1SD): Encapsulates symbols that have Z-Scores within ±1 standard deviation for both price and volume. Symbols within this square are typically considered to be displaying normal behavior or within expected range.
- 2nd Square (2SD): Encapsulates those with Z-Scores within ±2 standard deviations. Symbols within this boundary, but outside the 1 SD square, indicate a moderate deviation from the norm.
- 3rd Square (3SD): Represents symbols with Z-Scores within ±3 standard deviations. Any symbol outside this square is deemed to be a significant outlier, exhibiting extreme behavior in terms of either its price, its volume, or both.
By assessing the position of symbols relative to these squares, traders can swiftly identify which assets are behaving typically and which are showing unusual activity. This visualization simplifies the process of spotting potential outliers or unique trading opportunities within the market. The farther a symbol is from the center, the more it deviates from its typical behavior.
◽️ Display Type: Columns
In this visualization, z-scores are represented using columns, where each symbol is presented horizontally. Each symbol has two distinct nodes:
- Left Node: Represents the z-score of volume.
- Right Node: Represents the z-score of price.
The height of these nodes can vary along the y-axis between -4 and 4, based on the z-score value:
- Large Positive Columns: Signify a high or positive z-score, indicating that the price or volume is significantly above its average.
- Large Negative Columns: Represent a low or negative z-score, suggesting that the price or volume is considerably below its average.
- Short Columns Near 0: Indicate that the price or volume is close to its mean, showcasing minimal deviation.
This columnar representation provides a clear, intuitive view of how each symbol's price and volume deviate from their respective averages.
◽️ Display Type: Circles
In this visualization style, z-scores are depicted using circles. Each symbol is horizontally aligned and represented by:
- Solid Circle: Represents the z-score of price.
- Transparent Circle: Represents the z-score of volume.
The vertical position of these circles on the y-axis ranges between -4 and 4, reflecting the z-score value:
- Circles Near the Top: Indicate a high or positive z-score, suggesting the price or volume is well above its average.
- Circles Near the Bottom: Represent a low or negative z-score, pointing to the price or volume being notably below its average.
- Circles Around the Midline (0): Highlight that the price or volume is close to its mean, with minimal deviation.
◽️ Display Type: Delta Columns
There's also an option to utilize Z-Score Delta Columns. For each symbol, a single column is presented, depicting the difference between the z-score of price and the z-score of volume.
The z-score delta essentially captures the disparity between how much the price and volume deviate from their respective mean:
- Positive Delta: Indicates that the z-score of price is greater than the z-score of volume. This suggests that the price has deviated more from its average than the volume has from its own average. Such a scenario could point to price movements being more significant or pronounced compared to the changes in volume.
- Negative Delta: Represents that the z-score of volume is higher than the z-score of price. This might mean that there are substantial volume changes, yet the price hasn't moved as dramatically. This can be indicative of potential build-up in trading interest without an equivalent impact on price.
- Delta Close to 0: Means that the z-scores for price and volume are almost equal, indicating their deviations from the average are in sync.
◽️ Display Type: Z-Volume/Z-Price Heatmap
This visualization offers a heatmap either for volume z-scores or price z-scores across all symbols. Here's how it's presented:
Each symbol is allocated its own horizontal row. Within this row, bar-by-bar data is displayed using a color gradient to represent the z-score values. The heatmap employs a user-defined gradient scale, where a chosen "cold" color represents low z-scores and a chosen "hot" color signifies high z-scores. As the z-score increases or decreases, the colors transition smoothly along this gradient, providing an intuitive visual indication of the z-score's magnitude.
- Cold Colors: Indicate values significantly below the mean (negative z-score)
- Mild Colors: Represent values close to the mean, suggesting minimal deviation.
- Hot Colors: Indicate values significantly above the mean (positive z-score)
This heatmap format provides a rapid, visually impactful means to discern how each symbol's price or volume is behaving relative to its average. The color-coded rows allow you to quickly spot outliers.
VOLUME TYPE
The "Volume Type" input allows you to choose the nature of volume data that will be factored into the volume z-score calculation. The interpretation of indicator’s data changes based on this input. You can opt between:
- Volume (Regular Volume): This is the classic measure of trading volume, which represents the volume traded in a given time period - bar.
- OBV (On-Balance Volume): OBV is a momentum indicator that accumulates volume on up bars and subtracts it on down bars, making it a cumulative indicator that sort of measures buying and selling pressure.
Interpretation Implications:
- For Volume Type: Regular Volume:
Positive Z-Score: Indicates that the trading volume is above its average, meaning there's unusually high trading activity .
Negative Z-Score: Suggests that the trading volume is below its average, signifying unusually low trading activity.
- For Volume Type: OBV:
Positive Z-Score: Signifies that “buying pressure” is above its average.
Negative Z-Score: Signifies that “selling pressure” is above its average.
When comparing Z-Score of OBV to Z-Score of price, we can observe several scenarios. If Z-Price and Z-Volume are convergent (have similar z-scores), we can say that the directional price movement is supported by volume. If Z-Price and Z-Volume are divergent (have very different z-scores or one of them being zero), it suggests a potential misalignment between price movement and volume support, which might hint at possible reversals or weakness.

Treasury Yields Heatmap [By MUQWISHI]▋ INTRODUCTION :
The “Treasury Yields Heatmap” generates a dynamic heat map table, showing treasury yield bond values corresponding with dates. In the last column, it presents the status of the yield curve, discerning whether it’s in a normal, flat, or inverted configuration, which determined by using Pearson's linear regression coefficient. This tool is built to offer traders essential insights for effectively tracking bond values and monitoring yield curve status, featuring the flexibility to input a starting period, timeframe, and select from a range of major countries' bond data.
_______________________
▋ OVERVIEW:
______________________
▋ YIELD CURVE:
It is determined through Pearson's linear regression coefficient and considered…
R ≥ 0.7 → Normal
0.7 > R ≥ 0.35 → Slight Normal
0.35 > R > -0.35 → Flat
-0.35 ≥ R > -0.7 → Slight Inverted
-0.7 ≥ R → Inverted
_______________________
▋ INDICATOR SETTINGS:
#Section One: Table Setting
#Section Two: Technical Setting
(1) Country: Select country’s treasury yields data
(2) Timeframe: Time interval.
(3) Fetch By:
(3A) Date: Retrieve data by beginning of date.
(3B) Period: Retrieve data by specifying the number of time series back.
Enjoy. Please let me know if you have any questions.
Thank you.

Machine Learning: MFI Heat Map [YinYangAlgorithms]Overview:
MFI Heat Maps are a visually appealing way to display the values of 29 different MFIs at the same time while being able to make sense of it. Each plot within the Indicator represents a different MFI value. The higher you get up, the longer the length that was used for this MFI. This Indicator also features the use of Machine Learning to help balance the MFI levels. It doesn’t solely rely upon Machine Learning but instead incorporates a growing length MFI averaged with the Machine Learning MFI at any given index.
For instance, say we are calculating the 10th plot from the bottom, the MFI would be an average of:
MFI(source, 11)
Machine Learning MFI at Index of 10
We do it this way as they both help smooth each other out without relying solely on just one calculation method.
Due to plot limitations, you are capped at 28 Plot Amounts within this indicator, but that is still quite a bit of information you can glean from a Heat Map.
The Machine Learning used in this indicator is of the K-Nearest Neighbor (KNN). It uses a Fast and Slow MFI calculation then sorts through them over Machine Learning Length and calculates the differences between them. It then slices off KNN length to create our Max/Min Distances allotted. It adds the average between Fast and Slow MFIs to a Viable Distances array if their distances are within the KNN Min/Max distance. It then averages all distances in the Viable Distances array and returns the result.
The result of the KNN Function is saved to another ML Data array whose length is that of Plot Amount (Heat Map Size). This way each Index of the ML Data array can be indexed according to the Heat Map Size.
The Average of the ML Data array is the MFI line (white) that you’ll see plotted on the Indicator. There is also the SMA of the MFI Average (orange) which is likewise plotted. These plots allow you to visualize where the ML MFI is sitting and can potentially be useful for seeing when the MFI Average and SMA cross over and under each other.
We’ve heard many people talk highly of RSI, but sadly not too many even refer to MFI. MFI oftentimes may be overlooked, especially with new traders who may not even know what it is. Essentially MFI is an RSI but it also incorporates Volume into its calculations, which in our opinion leads to a more accurate reading; afterall, what is price movement without Volume.
Tutorial:
You may be thinking, this Indicator looks appealing to the eye, but how do I benefit from it trading wise?
Before we get into our visual examples, let's talk briefly about what makes Heat Maps in general a useful tool for trading. Heat Maps give us the ability to visualize and understand lots of data while removing the clutter. We can understand the data of 29 different MFIs without having to look at and decipher 29 different MFI plots. When you overlay too many MFI lines on top of each other, they can be very difficult to read and oftentimes end up actually hindering your Technical Analysis. For this reason, we have a simple solution to this problem; Heat Maps. This MFI Heat Map allows you to easily know (in a relative %) what the MFI level is for varying lengths. For Instance, the First (bottom) plot indexes an MFI of (K(0) (loop of Plot Amount) + Smoothing Length (default 1)) = 1. Since this is indexing (usually) a very low length, it will change much quicker. Whereas the Last (top) plot indexes an MFI of (K(27) (loop of Plot Amount) + Smoothing Length (default 1)) = 28. This is indexing a much higher length of MFI which results in the MFI the higher you go up in the Heat Map to move much slower.
Heat Maps give us the ability to see changes happening over multiple MFIs at the same time, which can be very useful for seeing shifts in MFI / Momentum. Remember, MFI incorporates Volume, so even if the price goes up a lot, if there was low volume, the MFI won’t move as much as an RSI would. However, likewise, if there is high volume but low price movement, the MFI will move slightly more than the RSI.
Heat Maps change color based on their MFI level. If the MFI is >= 90 it is HOT (red), if the MFI <= 9 it is COLD (teal, think of ICE). Green represents an MFI of 50-59 and Dark Blue represents an MFI of 40-49. Green and Dark blue are the most common colors as all the others are more ‘Extreme’ MFI levels.
Okay, time to get to the Examples :
Since there is so much going on in Heat Maps, we’ve decided to focus this tutorial to this specific area and talk about individual locations before talking about it as a whole.
If you refer to the example above where there are 2 white circles; these white circles are highlighting a key location you’ll be wanting to identify within your Heat Maps, many things are happening here:
The MFI crossed over the SMA (bullish).
The Heat Map started changing from mid/dark Blue (30-50 MFI) to Green (50-59 MFI) around the midline (the 50% dashed like).
The Lower levels of the Heat Map are turning Yellow/Orange/Red (60-100 MFI).
The Upper Levels of the Heat Map are still Light Blue - Green (10-50 MFI).
The 4 Key points above, all point towards potential Bullish Momentum changes. You’re likely wondering, but why? Let's discuss about each one in more specific detail:
1. The MFI crossed over the SMA (bullish): What this tells us is that the current MFI Average is now greater than its average over the last (default) 16 bars. This means there's been a large amount of Money Flow (Price and Volume) recently (subjectively based on the last (default) 16 average). This is one of the leading Bullish / Bearish signals you will see within this Indicator. You can enable Signals within the Settings and/or even add Alerts for when these crossings occur.
2. The Heat Map started changing from mid/dark Blue (30-50 MFI) to Green (50-59 MFI) around the midline (the 50% dashed like): This shows us that the index’s in the mid (if using all 28 heat map plots it would be at 14) has already received some of this momentum change. If you look at the second white circle (right), you’ll also notice the higher MFI plot indexes are also green. This is because since their length is long they still have some momentum and strength from the first white circle (left). Just because the first white circle failed in its bullish push, doesn’t mean it didn’t achieve momentum that would later on help to push the price up.
3. The Lower levels of the Heat Map are turning Yellow/Orange/Red (60-100 MFI): It occurred somewhat in the left white circle, but mainly in the right white circle. This shows us the MFI is very high on the lower lengths, this may lead to the current, middle and higher length MFIs following suit soon. Remember it has to work its way up, the higher levels can’t go red unless the lower levels go red first and the higher levels can also lag quite a bit behind and take awhile to catch up, this is normal, expected and meant to happen. Vice versa is also true with getting higher levels to go cold (light teal (think of ICE)).
4. The Upper Levels of the Heat Map are still Light Blue - Green (10-50 MFI): You might think at first that this is a bad thing, but it's not! Remember you want to be Fearful when others are Greedy and Greedy when others are Fearful! You don’t want to buy when the higher levels have a high MFI, you want to buy when you see the momentum pushing up in the lower MFI levels (getting yellow/orange/red in the low levels) while it is still Cold in the higher levels (BLUE OR GREEN, nothing higher than green as it is already slightly too high). There will be many times that it is Yellow or possibly Orange in the high levels and the bullish push still happens, but this is much more risky! The key to trading is to minimize risks while maximizing potential.
Hopefully now you’re getting an idea of how to spot potential bullish momentum changes, but what about bearish momentum changes? Technically they are the exact opposite, so we don’t need to go into as much detail, but lets still take a look at a few examples:
In the example above we marked the 3 times where it was displaying overly bullish characteristics. We marked the bullish momentum occurring with arrows. If you look closely at the start of the arrow to where it finishes, you’ll notice how the heat (HOT)(RED) works its way up from the lower levels to the higher levels. We then see the MFI to SMA cross under. In all 3 of these examples the heat made it all the way to the top of the chart. These are all very bearish signals that represent a bearish momentum movement that may occur soon.
Also, please note, the level the MFI is at DOES matter! That line isn’t there simply for you to see when there are crosses over and under. The MFI is considered to be Overbought when it is greater than 70 (the upper white dashed line, it is just formatted to be on a different scale cause there are 28 plots, but it represents 70). The MFI is considered to be Oversold when it is less than 30 (the lower white dashed line).
If we look to the left a little here where a big drop in price occurred shortly after our MFI and SMA crossed, would we have been able to identify it using the Heat Maps? Likely, No. There was some color change in the lower levels a few bars prior that went yellow/orange/red but before this cross happened they all went back to Dark Blue. In the middle section when the cross happened it was only Green and Yellow and in the upper section we are Blue. This would be a very risky trade to go on as the only real Bearish Indication was the MFI to SMA cross under. Remember, you want to reduce risk, you don’t want to simply trade on everytime the MFI and SMA cross each other or you’ll be getting yourself into many risky trades based on false signals.
Based on what you’ve learned above, can you see the signs that are indicating where this white circle may have potential for a bullish momentum change?
Now that we are more zoomed in, you may also be noticing there are colors to the price bars. This can be disabled in the settings, but just so you know what they mean, let’s zoom in a little more and talk about it.
We’ve condensed the Indicator a bit so you can see the bars better here. The colors that are displayed on these bars are the Heat Map value for your MFI (the white line in the Indicator). This way you can better see when the Price is Hot and Cold. As you may see while looking, the colors generally go from cold to hot when bullish momentum is happening and hot to cold when bearish momentum is happening. We don’t recommend solely looking at the bars as indicators to MFI momentum change, as seeing the Heat Map will give you much more data; however it can be nice to see the Heat Map projected on the bars rather than trying to eyeball it yourself or hover over each bar specifically to see their levels.
We will conclude our Tutorial here. Hopefully this has given you some insight to how useful Heat Maps can be and why it works well with a Machine Learning (KNN) Model applied to the MFI.
PLEASE NOTE: You can adjust the line width for the Heat Map within the settings. If you condense the Indicator a lot or have a small screen, likely use a length of 1-2. If you have it stretched out or a large screen, a length of 2-3 will work nice. You just don’t want to have the lines overlapping or it defeats the purpose of a Heat Map. Also, the bigger the linewidth, generally you’ll want to increase the Transparency within the Settings also as it can get quite bright and hurt your eyes over time.
Settings:
MFI:
Show MFI and SMA Crossing Signals: MFI and SMA Crossing is one of the leading Bullish and Bearish Signals in this Indicator. You can also add alerts for these signals.
Plot Amount: How many plots are used in this Heat Map. (2 - 28).
Source: The Source to use in all MFI calculations.
Smooth Initial MFI Length: How much to smooth the Fast and Slow MFI calculation by. 1 = No smoothing.
MFI SMA Length: What length we smooth the MFI Average over to get our MFI SMA.
Machine Learning:
Average MFI data by adding a lookback to the Source: While populating our Heat Map with the MFI's, should use use the Source each MFI Length increase or should we also lookback a Source each MFI Length Increase.
KNN Distance Requirement: To be a valid KNN, it needs to abide by a Distance calculation. Generally only Max is used, but you can change it if it suits your trading style better.
Machine Learning Length: How much ML data should we store? The longer the length generally the smoother the result; which may not be as accurate for something like a Heat Map, so keeping this relatively low may lead to more accurate results.
KNN Length: How many KNN are used in the slice to calculate max/min distance allowed.
Fast Length: Fast MFI length used in KNN to calculate distances by comparing its distance with the Slow MFI Length.
Slow Length: Slow MFI length used in KNN to calculate distances by comparing its distance with the Fast MFI Length.
Smoothing Length: When populating our Heat Map, at what length do we start our MFI calculations with (A Higher value with result in a slower and more smoothed MFI / Heat Map).
Colors:
Change Bar Color: Change bar colors to MFI Avg Color.
Heat Map Transparency: If there isn't any transparency it can be a little hard on the eyes. The Greater the Line Width, generally the more transparency you'll want for your eyes.
Line Width: Set how wide the Heat Map lines are
MFI 90-100 Color: Color when the MFI is between these levels.
MFI 80-89 Color: Color when the MFI is between these levels.
MFI 70-79 Color: Color when the MFI is between these levels.
MFI 60-69 Color: Color when the MFI is between these levels.
MFI 50-59 Color: Color when the MFI is between these levels.
MFI 40-49 Color: Color when the MFI is between these levels.
MFI 30-39 Color: Color when the MFI is between these levels.
MFI 20-29 Color: Color when the MFI is between these levels.
MFI 10-19 Color: Color when the MFI is between these levels.
MFI 0-100 Color: Color when the MFI is between these levels.
If you have any questions, comments, ideas or concerns please don't hesitate to contact us.
HAPPY TRADING!

[Excalibur] Ehlers AutoCorrelation Periodogram ModifiedKeep your coins folks, I don't need them, don't want them. If you wish be generous, I do hope that charitable peoples worldwide with surplus food stocks may consider stocking local food banks before stuffing monetary bank vaults, for the crusade of remedying the needs of less than fortunate children, parents, elderly, homeless veterans, and everyone else who deserves nutritional sustenance for the soul.
DEDICATION:
This script is dedicated to the memory of Nikolai Dmitriyevich Kondratiev (Никола́й Дми́триевич Кондра́тьев) as tribute for being a pioneering economist and statistician, paving the way for modern econometrics by advocation of rigorous and empirical methodologies. One of his most substantial contributions to the study of business cycle theory include a revolutionary hypothesis recognizing the existence of dynamic cycle-like phenomenon inherent to economies that are characterized by distinct phases of expansion, stagnation, recession and recovery, what we now know as "Kondratiev Waves" (K-waves). Kondratiev was one of the first economists to recognize the vital significance of applying quantitative analysis on empirical data to evaluate economic dynamics by means of statistical methods. His understanding was that conceptual models alone were insufficient to adequately interpret real-world economic conditions, and that sophisticated analysis was necessary to better comprehend the nature of trending/cycling economic behaviors. Additionally, he recognized prosperous economic cycles were predominantly driven by a combination of technological innovations and infrastructure investments that resulted in profound implications for economic growth and development.
I will mention this... nation's economies MUST be supported and defended to continuously evolve incrementally in order to flourish in perpetuity OR suffer through eras with lasting ramifications of societal stagnation and implosion.
Analogous to the realm of economics, aperiodic cycles/frequencies, both enduring and ephemeral, do exist in all facets of life, every second of every day. To name a few that any blind man can naturally see are: heartbeat (cardiac cycles), respiration rates, circadian rhythms of sleep, powerful magnetic solar cycles, seasonal cycles, lunar cycles, weather patterns, vegetative growth cycles, and ocean waves. Do not pretend for one second that these basic aforementioned examples do not affect business cycle fluctuations in minuscule and monumental ways hour to hour, day to day, season to season, year to year, and decade to decade in every nation on the planet. Kondratiev's original seminal theories in macroeconomics from nearly a century ago have proven remarkably prescient with many of his antiquated elementary observations/notions/hypotheses in macroeconomics being scholastically studied and topically researched further. Therefore, I am compelled to honor and recognize his statistical insight and foresight.
If only.. Kondratiev could hold a pocket sized computer in the cup of both hands bearing the TradingView logo and platform services, I truly believe he would be amazed in marvelous delight with a GARGANTUAN smile on his face.
INTRODUCTION:
Firstly, this is NOT technically speaking an indicator like most others. I would describe it as an advanced cycle period detector to obtain market data spectral estimates with low latency and moderate frequency resolution. Developers can take advantage of this detector by creating scripts that utilize a "Dominant Cycle Source" input to adaptively govern algorithms. Be forewarned, I would only recommend this for advanced developers, not novice code dabbling. Although, there is some Pine wizardry introduced here for novice Pine enthusiasts to witness and learn from. AI did describe the code into one super-crunched sentence as, "a rare feat of exceptionally formatted code masterfully balancing visual clarity, precision, and complexity to provide immense educational value for both programming newcomers and expert Pine coders alike."
Understand all of the above aforementioned? Buckle up and proceed for a lengthy read of verbose complexity...
This is my enhanced and heavily modified version of autocorrelation periodogram (ACP) for Pine Script v5.0. It was originally devised by the mathemagician John Ehlers for detecting dominant cycles (frequencies) in an asset's price action. I have been sitting on code similar to this for a long time, but I decided to unleash the advanced code with my fashion. Originally Ehlers released this with multiple versions, one in a 2016 TASC article and the other in his last published 2013 book "Cycle Analytics for Traders", chapter 8. He wasn't joking about "concepts of advanced technical trading" and ACP is nowhere near to his most intimidating and ingenious calculations in code. I will say the book goes into many finer details about the original periodogram, so if you wish to delve into even more elaborate info regarding Ehlers' original ACP form AND how you may adapt algorithms, you'll have to obtain one. Note to reader, comparing Ehlers' original code to my chimeric code embracing the "Power of Pine", you will notice they have little resemblance.
What you see is a new species of autocorrelation periodogram combining Ehlers' innovation with my fascinations of what ACP could be in a Pine package. One other intention of this script's code is to pay homage to Ehlers' lifelong works. Like Kondratiev, Ehlers is also a hardcore cycle enthusiast. I intend to carry on the fire Ehlers envisioned and I believe that is literally displayed here as a pleasant "fiery" example endowed with Pine. With that said, I tried to make the code as computationally efficient as possible, without going into dozens of more crazy lines of code to speed things up even more. There's also a few creative modifications I made by making alterations to the originating formulas that I felt were improvements, one of them being lag reduction. By recently questioning every single thing I thought I knew about ACP, combined with the accumulation of my current knowledge base, this is the innovative revision I came up with. I could have improved it more but decided not to mind thrash too many TV members, maybe later...
I am now confident Pine should have adequate overhead left over to attach various indicators to the dominant cycle via input.source(). TV, I apologize in advance if in the future a server cluster combusts into a raging inferno... Coders, be fully prepared to build entire algorithms from pure raw code, because not all of the built-in Pine functions fully support dynamic periods (e.g. length=ANYTHING). Many of them do, as this was requested and granted a while ago, but some functions are just inherently finicky due to implementation combinations and MUST be emulated via raw code. I would imagine some comprehensive library or numerous authored scripts have portions of raw code for Pine built-ins some where on TV if you look diligently enough.
Notice: Unfortunately, I will not provide any integration support into member's projects at all. I have my own projects that require way too much of my day already. While I was refactoring my life (forgoing many other "important" endeavors) in the early half of 2023, I primarily focused on this code over and over in my surplus time. During that same time I was working on other innovations that are far above and beyond what this code is. I hope you understand.
The best way programmatically may be to incorporate this code into your private Pine project directly, after brutal testing of course, but that may be too challenging for many in early development. Being able to see the periodogram is also beneficial, so input sourcing may be the "better" avenue to tether portions of the dominant cycle to algorithms. Unique indication being able to utilize the dominantCycle may be advantageous when tethering this script to those algorithms. The easiest way is to manually set your indicators to what ACP recognizes as the dominant cycle, but that's actually not considered dynamic real time adaption of an indicator. Different indicators may need a proportion of the dominantCycle, say half it's value, while others may need the full value of it. That's up to you to figure that out in practice. Sourcing one or more custom indicators dynamically to one detector's dominantCycle may require code like this: `int sourceDC = int(math.max(6, math.min(49, input.source(close, "Dominant Cycle Source"))))`. Keep in mind, some algos can use a float, while algos with a for loop require an integer.
I have witnessed a few attempts by talented TV members for a Pine based autocorrelation periodogram, but not in this caliber. Trust me, coding ACP is no ordinary task to accomplish in Pine and modifying it blessed with applicable improvements is even more challenging. For over 4 years, I have been slowly improving this code here and there randomly. It is beautiful just like a real flame, but... this one can still burn you! My mind was fried to charcoal black a few times wrestling with it in the distant past. My very first attempt at translating ACP was a month long endeavor because PSv3 simply didn't have arrays back then. Anyways, this is ACP with a newer engine, I hope you enjoy it. Any TV subscriber can utilize this code as they please. If you are capable of sufficiently using it properly, please use it wisely with intended good will. That is all I beg of you.
Lastly, you now see how I have rasterized my Pine with Ehlers' swami-like tech. Yep, this whole time I have been using hline() since PSv3, not plot(). Evidently, plot() still has a deficiency limited to only 32 plots when it comes to creating intense eye candy indicators, the last I checked. The use of hline() is the optimal choice for rasterizing Ehlers styled heatmaps. This does only contain two color schemes of the many I have formerly created, but that's all that is essentially needed for this gizmo. Anything else is generally for a spectacle or seeing how brutal Pine can be color treated. The real hurdle is being able to manipulate colors dynamically with Merlin like capabilities from multiple algo results. That's the true challenging part of these heatmap contraptions to obtain multi-colored "predator vision" level indication. You now have basic hline() food for thought empowerment to wield as you can imaginatively dream in Pine projects.
PERIODOGRAM UTILITY IN REAL WORLD SCENARIOS:
This code is a testament to the abilities that have yet to be fully realized with indication advancements. Periodograms, spectrograms, and heatmaps are a powerful tool with real-world applications in various fields such as financial markets, electrical engineering, astronomy, seismology, and neuro/medical applications. For instance, among these diverse fields, it may help traders and investors identify market cycles/periodicities in financial markets, support engineers in optimizing electrical or acoustic systems, aid astronomers in understanding celestial object attributes, assist seismologists with predicting earthquake risks, help medical researchers with neurological disorder identification, and detection of asymptomatic cardiovascular clotting in the vaxxed via full body thermography. In either field of study, technologies in likeness to periodograms may very well provide us with a better sliver of analysis beyond what was ever formerly invented. Periodograms can identify dominant cycles and frequency components in data, which may provide valuable insights and possibly provide better-informed decisions. By utilizing periodograms within aspects of market analytics, individuals and organizations can potentially refrain from making blinded decisions and leverage data-driven insights instead.
PERIODOGRAM INTERPRETATION:
The periodogram renders the power spectrum of a signal, with the y-axis representing the periodicity (frequencies/wavelengths) and the x-axis representing time. The y-axis is divided into periods, with each elevation representing a period. In this periodogram, the y-axis ranges from 6 at the very bottom to 49 at the top, with intermediate values in between, all indicating the power of the corresponding frequency component by color. The higher the position occurs on the y-axis, the longer the period or lower the frequency. The x-axis of the periodogram represents time and is divided into equal intervals, with each vertical column on the axis corresponding to the time interval when the signal was measured. The most recent values/colors are on the right side.
The intensity of the colors on the periodogram indicate the power level of the corresponding frequency or period. The fire color scheme is distinctly like the heat intensity from any casual flame witnessed in a small fire from a lighter, match, or camp fire. The most intense power would be indicated by the brightest of yellow, while the lowest power would be indicated by the darkest shade of red or just black. By analyzing the pattern of colors across different periods, one may gain insights into the dominant frequency components of the signal and visually identify recurring cycles/patterns of periodicity.
SETTINGS CONFIGURATIONS BRIEFLY EXPLAINED:
Source Options: These settings allow you to choose the data source for the analysis. Using the `Source` selection, you may tether to additional data streams (e.g. close, hlcc4, hl2), which also may include samples from any other indicator. For example, this could be my "Chirped Sine Wave Generator" script found in my member profile. By using the `SineWave` selection, you may analyze a theoretical sinusoidal wave with a user-defined period, something already incorporated into the code. The `SineWave` will be displayed over top of the periodogram.
Roofing Filter Options: These inputs control the range of the passband for ACP to analyze. Ehlers had two versions of his highpass filters for his releases, so I included an option for you to see the obvious difference when performing a comparison of both. You may choose between 1st and 2nd order high-pass filters.
Spectral Controls: These settings control the core functionality of the spectral analysis results. You can adjust the autocorrelation lag, adjust the level of smoothing for Fourier coefficients, and control the contrast/behavior of the heatmap displaying the power spectra. I provided two color schemes by checking or unchecking a checkbox.
Dominant Cycle Options: These settings allow you to customize the various types of dominant cycle values. You can choose between floating-point and integer values, and select the rounding method used to derive the final dominantCycle values. Also, you may control the level of smoothing applied to the dominant cycle values.
DOMINANT CYCLE VALUE SELECTIONS:
External to the acs() function, the code takes a dominant cycle value returned from acs() and changes its numeric form based on a specified type and form chosen within the indicator settings. The dominant cycle value can be represented as an integer or a decimal number, depending on the attached algorithm's requirements. For example, FIR filters will require an integer while many IIR filters can use a float. The float forms can be either rounded, smoothed, or floored. If the resulting value is desired to be an integer, it can be rounded up/down or just be in an integer form, depending on how your algorithm may utilize it.
AUTOCORRELATION SPECTRUM FUNCTION BASICALLY EXPLAINED:
In the beginning of the acs() code, the population of caches for precalculated angular frequency factors and smoothing coefficients occur. By precalculating these factors/coefs only once and then storing them in an array, the indicator can save time and computational resources when performing subsequent calculations that require them later.
In the following code block, the "Calculate AutoCorrelations" is calculated for each period within the passband width. The calculation involves numerous summations of values extracted from the roofing filter. Finally, a correlation values array is populated with the resulting values, which are normalized correlation coefficients.
Moving on to the next block of code, labeled "Decompose Fourier Components", Fourier decomposition is performed on the autocorrelation coefficients. It iterates this time through the applicable period range of 6 to 49, calculating the real and imaginary parts of the Fourier components. Frequencies 6 to 49 are the primary focus of interest for this periodogram. Using the precalculated angular frequency factors, the resulting real and imaginary parts are then utilized to calculate the spectral Fourier components, which are stored in an array for later use.
The next section of code smooths the noise ridden Fourier components between the periods of 6 and 49 with a selected filter. This species also employs numerous SuperSmoothers to condition noisy Fourier components. One of the big differences is Ehlers' versions used basic EMAs in this section of code. I decided to add SuperSmoothers.
The final sections of the acs() code determines the peak power component for normalization and then computes the dominant cycle period from the smoothed Fourier components. It first identifies a single spectral component with the highest power value and then assigns it as the peak power. Next, it normalizes the spectral components using the peak power value as a denominator. It then calculates the average dominant cycle period from the normalized spectral components using Ehlers' "Center of Gravity" calculation. Finally, the function returns the dominant cycle period along with the normalized spectral components for later external use to plot the periodogram.
POST SCRIPT:
Concluding, I have to acknowledge a newly found analyst for assistance that I couldn't receive from anywhere else. For one, Claude doesn't know much about Pine, is unfortunately color blind, and can't even see the Pine reference, but it was able to intuitively shred my code with laser precise realizations. Not only that, formulating and reformulating my description needed crucial finesse applied to it, and I couldn't have provided what you have read here without that artificial insight. Finding the right order of words to convey the complexity of ACP and the elaborate accompanying content was a daunting task. No code in my life has ever absorbed so much time and hard fricking work, than what you witness here, an ACP gem cut pristinely. I'm unveiling my version of ACP for an empowering cause, in the hopes a future global army of code wielders will tether it to highly functional computational contraptions they might possess. Here is ACP fully blessed poetically with the "Power of Pine" in sublime code. ENJOY!

Volume HeatMap With Profile [ChartPrime]The Volume Heatmap with Profile indicator is a tool designed to provide traders with a comprehensive view of market activity through customizable visualizations. This indicator goes beyond traditional volume analysis by offering a range of adjustable parameters and features that enhance analysis of volume and give a cleaner experience when analyzing it.
To get started click the start and end time for the profile.
Key Features:
Extended Calculation: This indicator extends its calculation to the last bar, ensuring that the user has insights into current market dynamics.
Point of Control (POC): Easily identify the price level at which the highest trading activity has occurred, helping the user pinpoint potential reversal points and significant support/resistance zones.
VWAP Point of Control: Display the Volume Weighted Average Price (VWAP) Point of Control, giving the user a clear reference for determining the average price traders are paying and potential price reversals.
Adjustable Colors for Heatmap: Change the heatmap colors to the users preference, allowing the user to match the indicator's appearance to their chart style and personal visual preferences.
Forecasted Zone: This feature allows traders to forecast areas of high activity by providing the option to adjust colors within this zone. This feature assists in identifying potential breakouts or areas where increased trading volume is anticipated.
Volume Profile: Customize the colors of the volume profile to make it distinct and easily distinguishable on the chart.
Adjustable Volume Levels: Specify the number volume levels that are most relevant to your trading strategy.
Adjustable Placement for Volume Profile: Position the volume profile on the chart. Whether the user prefers it on the left, right, or at the center of the chart, this indicator offers placement flexibility.
The ratio of bull vs bear volume is plotted on the outside of the range indicating how bullish or bearish price action is in a given range.

Bollinger Bands Heatmap (BBH)The Bollinger Bands Heatmap (BBH) Indicator provides a unique visualization of Bollinger Bands by displaying the full distribution of prices as a heatmap overlaying your price chart. Unlike traditional Bollinger Bands, which plot the mean and standard deviation as lines, BBH illustrates the entire statistical distribution of prices based on a normal distribution model.
This heatmap indicator offers traders a visually appealing way to understand the probabilities associated with different price levels. The lower the weight of a certain level, the more transparent it appears on the heatmap, making it easier to identify key areas of interest at a glance.
Key Features
Dynamic Heatmap: Changes in real-time as new price data comes in.
Fully Customizable: Adjust the scale, offset, alpha, and other parameters to suit your trading style.
Visually Engaging: Uses gradients of colors to distinguish between high and low probabilities.
Settings
Scale
Tooltip: Scale the size of the heatmap.
Purpose: The 'Scale' setting allows you to adjust the dimensions of each heatmap box. A higher value will result in larger boxes and a more generalized view, while a lower value will make the boxes smaller, offering a more detailed look at price distributions.
Values: You can set this from a minimum of 0.125, stepping up by increments of 0.125.
Scale ATR Length
Tooltip: The ATR used to scale the heatmap boxes.
Purpose: This setting is designed to adapt the heatmap to the instrument's volatility. It determines the length of the Average True Range (ATR) used to size the heatmap boxes.
Values: Minimum allowable value is 5. You can increase this to capture more bars in the ATR calculation for greater smoothing.
Offset
Tooltip: Offset mean by ATR.
Purpose: The 'Offset' setting allows you to shift the mean value by a specified ATR. This could be useful for strategies that aim to capitalize on extreme price movements.
Values: The value can be any floating-point number. Positive values shift the mean upward, while negative values shift it downward.
Multiplier
Tooltip: Bollinger Bands Multiplier.
Purpose: The 'Multiplier' setting determines how wide the Bollinger Bands are around the mean. A higher value will result in a wider heatmap, capturing more extreme price movements. A lower value will tighten the heatmap around the mean price.
Values: The minimum is 0, and you can increase this in steps of 0.2.
Length
Tooltip: Length of Simple Moving Average (SMA).
Purpose: This setting specifies the period for the Simple Moving Average that serves as the basis for the Bollinger Bands. A higher value will produce a smoother average, while a lower value will make it more responsive to price changes.
Values: Can be set to any integer value.
Heat Map Alpha
Tooltip: Opacity level of the heatmap.
Purpose: This controls the transparency of the heatmap. A lower value will make the heatmap more transparent, allowing you to see the price action more clearly. A higher value will make the heatmap more opaque, emphasizing the bands.
Values: Ranges from 0 (completely transparent) to 100 (completely opaque).
Color Settings
High Color & Low Color: These settings allow you to customize the gradient colors of the heatmap.
Purpose: Use contrasting colors for better visibility or colors that you prefer. The 'High Color' is used for areas with high density (high probability), while the 'Low Color' is for low-density areas (low probability).
Usage Scenarios for Settings
For Volatile Markets: Increase 'Scale ATR Length' for better smoothing and set a higher 'Multiplier' to capture wider price movements.
For Trend Following: You might want to set a larger 'Length' for the SMA and adjust 'Scale' and 'Offset' to focus on more probable price zones.
These are just recommendations; feel free to experiment with these settings to suit your specific trading requirements.
How To Interpret
The heatmap gives a visual representation of the range within which prices are likely to move. Areas with high density (brighter color) indicate a higher probability of the price being in that range, whereas areas with low density (more transparent) indicate a lower probability.
Bright Areas: Considered high-probability zones where the price is more likely to be.
Transparent Areas: Considered low-probability zones where the price is less likely to be.
Tips For Use
Trend Confirmation: Use the heatmap along with other trend indicators to confirm the strength and direction of a trend.
Volatility: Use the density and spread of the heatmap as an indication of market volatility.
Entry and Exit: High-density areas could be potential support and resistance levels, aiding in entry and exit decisions.
Caution
The Bollinger Bands Heatmap assumes a normal distribution of prices. While this is a standard assumption in statistics, it is crucial to understand that real-world price movements may not always adhere to a normal distribution.
Conclusion
The Bollinger Bands Heatmap Indicator offers traders a fresh perspective on Bollinger Bands by transforming them into a visual, real-time heatmap. With its customizable settings and visually engaging display, BBH can be a useful tool for traders looking to understand price probabilities in a dynamic way.
Feel free to explore its features and adjust the settings to suit your trading strategy. Happy trading!

Bollinger Bands Liquidity Cloud [ChartPrime]This indicator overlays a heatmap on the price chart, providing a detailed representation of Bollinger bands' profile. It offers insights into the price's behavior relative to these bands. There are two visualization styles to choose from: the Volume Profile and the Z-Score method.
Features
Volume Profile: This method illustrates how the price interacts with the Bollinger bands based on the traded volume.
Z-Score: In this mode, the indicator samples the real distribution of Z-Scores within a specified window and rescales this distribution to the desired sample size. It then maps the distribution as a heatmap by calculating the corresponding price for each Z-Score sample and representing its weight via color and transparency.
Parameters
Length: The period for the simple moving average that forms the base for the Bollinger bands.
Multiplier: The number of standard deviations from the moving average to plot the upper and lower Bollinger bands.
Main:
Style: Choose between "Volume" and "Z-Score" visual styles.
Sample Size: The size of the bin. Affects the granularity of the heatmap.
Window Size: The lookback window for calculating the heatmap. When set to Z-Score, a value of `0` implies using all available data. It's advisable to either use `0` or the highest practical value when using the Z-Score method.
Lookback: The amount of historical data you want the heatmap to represent on the chart.
Smoothing: Implements sinc smoothing to the distribution. It smoothens out the heatmap to provide a clearer visual representation.
Heat Map Alpha: Controls the transparency of the heatmap. A higher value makes it more opaque, while a lower value makes it more transparent.
Weight Score Overlay: A toggle that, when enabled, displays a letter score (`S`, `A`, `B`, `C`, `D`) inside the heatmap boxes, based on the weight of each data point. The scoring system categorizes each weight into one of these letters using the provided percentile ranks and the median.
Color
Color: Color for high values.
Standard Deviation Color: Color to represent the standard deviation on the Bollinger bands.
Text Color: Determines the color of the letter score inside the heatmap boxes. Adjusting this parameter ensures that the score is visible against the heatmap color.
Usage
Once this indicator is applied to your chart, the heatmap will be overlaid on the price chart, providing a visual representation of the price's behavior in relation to the Bollinger bands. The intensity of the heatmap is directly tied to the price action's intensity, defined by your chosen parameters.
When employing the Volume Profile style, a brighter and more intense area on the heatmap indicates a higher trading volume within that specific price range. On the other hand, if you opt for the Z-Score method, the intensity of the heatmap reflects the Z-Score distribution. Here, a stronger intensity is synonymous with a more frequent occurrence of a specific Z-Score.
For those seeking an added layer of granularity, there's the "Weight Score Overlay" feature. When activated, each box in your heatmap will sport a letter score, ranging from `S` to `D`. This score categorizes the weight of each data point, offering a concise breakdown:
- `S`: Data points with a weight of 1.
- `A`: Weights below 1 but greater than or equal to the 75th percentile rank.
- `B`: Weights under the 75th percentile but at or above the median.
- `C`: Weights beneath the median but surpassing the 25th percentile rank.
- `D`: All that fall below the 25th percentile rank.
This scoring feature augments the heatmap's visual data, facilitating a quicker interpretation of the weight distribution across the dataset.
Further Explanations
Volume Profile
A volume profile is a tool used by traders to visualize the amount of trading volume occurring at specific price levels. This kind of profile provides a deep insight into the market's structure and helps traders identify key areas of support and resistance, based on where the most trading activity took place. The concept behind the volume profile is that the amount of volume at each price level can indicate the potential importance of that price.
In this indicator:
- The volume profile mode creates a visual representation by sampling trading volumes across price levels.
- The representation displays the balance between bullish and bearish volumes at each level, which is further differentiated using a color gradient from `low_color` to `high_color`.
- The volume profile becomes more refined with sinc smoothing, helping to produce a smoother distribution of volumes.
Z-Score and Distribution Resampling
Z-Score, in the context of trading, represents the number of standard deviations a data point (e.g., closing price) is from the mean (average). It’s a measure of how unusual or typical a particular data point is in relation to all the data. In simpler terms, a high Z-Score indicates that the data point is far away from the mean, while a low Z-Score suggests it's close to the mean.
The unique feature of this indicator is that it samples the real distribution of z-scores within a window and then resamples this distribution to fit the desired sample size. This process is termed as "resampling in the context of distribution sampling" . Resampling provides a way to reconstruct and potentially simplify the original distribution of z-scores, making it easier for traders to interpret.
In this indicator:
- Each Z-Score corresponds to a price value on the chart.
- The resampled distribution is then used to display the heatmap, with each Z-Score related price level getting a heatmap box. The weight (or importance) of each box is represented as a combination of color and transparency.
How to Interpret the Z-Score Distribution Visualization:
When interpreting the Z-Score distribution through color and alpha in the visualization, it's vital to understand that you're seeing a representation of how unusual or typical certain data points are without directly viewing the numerical Z-Score values. Here's how you can interpret it:
Intensity of Color: This often corresponds to the distance a particular data point is from the mean.
Lighter shades (closer to `low_color`) typically indicate data points that are more extreme, suggesting overbought or oversold conditions. These could signify potential reversals or significant deviations from the norm.
Darker shades (closer to `high_color`) represent data points closer to the mean, suggesting that the price is relatively typical compared to the historical data within the given window.
Alpha (Transparency): The degree of transparency can indicate the significance or confidence of the observed deviation. More opaque boxes might suggest a stronger or more reliable deviation from the mean, implying that the observed behavior is less likely to be a random occurrence.
More transparent boxes could denote less certainty or a weaker deviation, meaning that the observed price behavior might not be as noteworthy.
- Combining Color and Alpha: By observing both the intensity of color and the level of transparency, you get a richer understanding. For example:
- A light, opaque box could suggest a strong, significant deviation from the mean, potentially signaling an overbought or oversold scenario.
- A dark, transparent box might indicate a weak, insignificant deviation, suggesting the price is behaving typically and is close to its average.

Dynamic Liquidity Map [Kioseff Trading]Hello!
Just a quick/fun project here: "Dynamic Heatmap".
This script draws a volume delta or open interest delta heatmap for the asset on your chart.
The adjective "Dynamic" is used for two reasons (:
1: Self-Adjusting Lower Timeframe Data
The script requests ~10 lower timeframe volume and open interest data sets.
When using the fixed range feature the script will, beginning at the start time, check the ~10 requested lower timeframes to see which of the lower timeframes has available data.
The script will always use the lowest timeframe available during the calculation period. As time continues, the script will continue to check if new lower timeframe data (lower than the currently used lowest timeframe) is available. This process repeats until bar time is close enough to the current time that 1-minute data can be retrieved.
The image above exemplifies the process.
Incrementally lower timeframe data will be used as it becomes available.
1: Fixed range capabilities
The script features a "fixed range" tool, where you can manually set a start time (or drag & drop a bar on the chart) to determine the interval the heatmap covers.
From the start date, the script will calculate the calculate the sub-intervals necessary to draw a rows x columns heatmap. Consequently, setting the start time further back will draw a heat map with larger rows x columns, whereas, a start time closer to the current bar time will draw a more "precise" heatmap with smaller rows x columns.
Additionally, the heatmap can be calculated using open interest data.
The image above shows the heatmap displaying open interest delta.
The image above shows alternative settings for the heatmap.
Delta values have been hidden alongside grid border colors. These settings can be replicated to achieve a more "traditional" feel for the heatmap.
Thanks for checking this out!
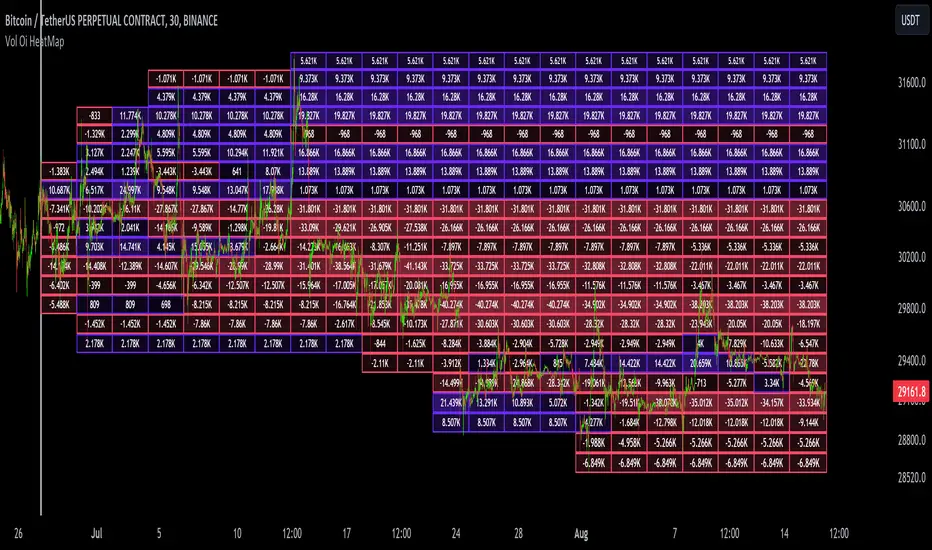
Options & Leveraged Shares Heatmap This is the leveraged share/option heatmap / screener.
Tradingview offers a few different tickers that have PTCR data on the daily timeframe. So I was able to pull those few tickers that display the PTCR data and format it into a heatmap.
I also had some room to add leveraged share data as well.
It is pretty self explanatory but I will go over it really briefly:
The timeframe is 1 D. This cannot be changed because this is the only timeframe available for the PTCR data.
It will pull the current day PTCR as well as the previous day PTCR and display the PTCR and change value.
The screening will be done according to the 1 day change.
You have the ability to select the option to sort by Max and Min or sort by heatmap:
Displaying max and min will show you the max positive and negative change among all the available tickers.
Max positive = bearish, as this indicates an uptick in Puts.
Max negative = bullish, as this indicates a decline in Puts.
If we flip over to the leveraged shares, it is the same:
To keep it consistent, the leveraged share ratio is displayed similar to PTCR. It is Sell to Buy ratio. The higher the ratio, the more selling and vice versa.
Thus, the same rules apply. Max positive = bearish and max negative = bullish.
If you want to display the heatmap, this is what it will look like:
The darker the blue, the higher the change in either a negative or positive direction. The same for the leveraged shares:
And that is the indicator.
Hopefully you find it helpful. I like to reference it at the end of each day to see how things are looking in terms of positioning for the following day.
Leave your comments/questions and suggestions below.
Safe trades!
Price Delta HeatmapThe Price Delta Heatmap is an indicator designed to visualize the price changes of an asset over time. It helps traders identify and analyze significant price movements and potential volatility. The indicator calculates the price delta, which is the difference between the current close price and the previous close price. It then categorizes the price deltas into different color ranges to create a heatmap-like display on the chart.
The indicator uses user-defined thresholds to determine the color ranges. These thresholds represent the minimum price change required for a specific color to be assigned. The thresholds are adjustable to accommodate different asset classes and trading strategies. Positive price deltas are associated with bullish movements, while negative price deltas represent bearish movements.
The indicator plots bars color-coded according to the price delta range it falls into. The color ranges can be customized to match personal preferences or specific trading strategies. Additionally, the indicator includes signal shapes below the bars to highlight significant positive or negative price deltas. Traders can adjust the threshold values based on their preferred sensitivity to price changes. Higher threshold values may filter out minor price movements and focus on more significant shifts, while lower threshold values will capture even minor fluctuations.
****The default settings have the thresholds set to levels of 100, 50, 20, 10, 0, -10, -20, -50, and -100. These numbers are well-suited for assets such as Ethereum or Bitcoin which are larger in price than an asset that has a price of $1.50, for example. To compensate, adjust the thresholds in the settings to reflect the price delta on the desired asset. All coloration and horizontal line plots will adjust to reflect these changes.****
Traders can interpret the Price Delta Heatmap as follows:
-- Bright green bars indicate the highest positive price deltas, suggesting strong bullish price movements.
-- Green bars represent positive price deltas above the third threshold, indicating significant bullish price changes.
-- Olive bars indicate positive price deltas above the second threshold, suggesting moderate bullish price movements.
-- Yellow bars represent positive price deltas above the lowest threshold, indicating minor bullish price changes. This color is reflected on the negative side as well. Yellow bars below zero indicate negative price deltas below the lowest threshold, suggesting minor bearish price changes.
-- White bars represent zero price deltas, indicating no significant price movement.
-- Orange bars represent negative price deltas below the second threshold, indicating moderate bearish price movements.
-- Red bars indicate negative price deltas below the third threshold, suggesting significant bearish price changes.
-- Maroon bars represent the lowest negative price deltas, indicating strong bearish price movements.
The coloration of the Price Delta line itself is determined by the line's relation to the second positive and second negative thresholds (default +/- 20) - if the line is above the second positive threshold, the line is colored lime (and is reflected in a lime arrow at the bottom of the indicator); if the line is below the second negative threshold, the line is colored fuchsia (also reflected as an arrow); if the line is between thresholds, it is colored aqua.
The Price Delta Heatmap can be used in various trading strategies and applications. Some potential use cases include:
-- Trend identification : The indicator helps traders identify periods of high volatility and potential trend reversals.
-- Volatility analysis : By observing the color changes in the heatmap, traders can gauge the volatility of an asset and adjust their risk management strategies accordingly.
-- Confirmation tool : The indicator can be used as a confirmation tool alongside other technical indicators, such as trend-following indicators or oscillators.
-- Breakout trading : Traders can look for price delta bars of a specific color range to identify potential breakout opportunities.
However, it's important to note that the Price Delta Heatmap has certain limitations. These include:
-- Lagging nature : The indicator relies on historical price data, which means it may not provide real-time insights into price movements.
-- Sensitivity to thresholds : The choice of threshold values affects the indicator's sensitivity and may vary depending on the asset being traded. It requires experimentation and adjustment to find optimal values.
-- Market conditions : The indicator's effectiveness may vary depending on market conditions, such as low liquidity or sudden news events.
Traders should consider using the Price Delta Heatmap in conjunction with other technical analysis tools and incorporate risk management strategies to enhance their trading decisions.
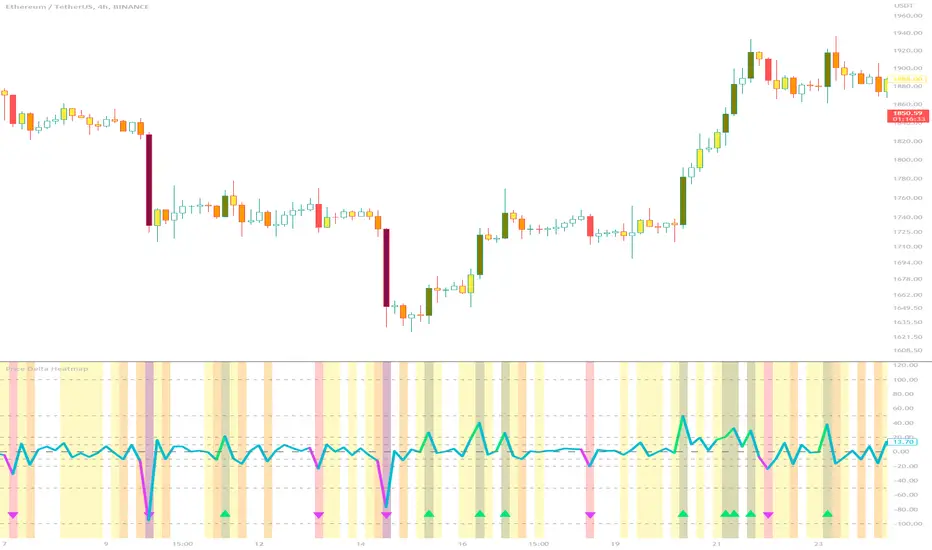
MOM HEATThe "MOM HEAT" indicator combines MACD, Stochastic, MFI, and RSI to create a heat map of market momentum.
It calculates wave values based on these indicators for four different timeframes.
The wave values are then normalized and combined to determine overall momentum.
The indicator plots squares on the chart to represent the wave values for each timeframe.
It also draws a line to indicate potential momentum shifts.
Additionally, a table displays the timeframes and their corresponding colors (lib kaigouthro/hsvColor/15).
Overall, the indicator provides a visual representation of market momentum and potential shifts.

CANDLE STICK HEATMAPCANDLE STICK HEATMAP shows the statistics of a candle at a particular time. its very useful to find repeating pattern's at a particular time in a day.
based on the settings you can see regular repeating patterns of a day in an hourly chart. During a particular time in day there is always a down or up signal or candles.
The table boxes are candles in RED and GREEN based on open and close of the chart. The Heat map is very useful in analyzing the daily Hourly candlesticks in a week. The Time of each candlestick is plotted on the table along with default Indicators like RSI, MACD, EMA, VOLUME, ADX.
Additionally this can be used as a screener of candles on all timeframes. Analysis is easy when you want to see what happened exactly at a particular time in the previous hour, day, month etc.,
Hopefully additional updates will be introduced shortly.
Indicators:
1. MACD (close,12,26,9)
2.RSI (close,14)
3.EMA 200
3.Volume MA
Option is provided to show indicator statistics and time.
Color can be changed using settings.
Supports all Time Zones

Broadview Underpriced & OverpricedIntroducing the groundbreaking Broadview Underpriced & Overpriced indicator—a convergence of science, technology, and mathematical finance. This cutting-edge development takes the highly acclaimed Overbought & Oversold Heatmap and elevates it to an entirely new level by infusing it with price trends through the application of special moving averages. The result is a revolutionary approach to asset classification, allowing traders, investors, and institutions to categorize assets into four distinct categories: Underpriced, Overpriced, Discounted, and Inflated.
The Broadview Underpriced & Overpriced indicator combines the power of the Overbought & Oversold Heatmap with a sophisticated methodology that leverages special moving averages. These unique moving averages enhance the precision and accuracy of the asset classification process, providing traders with unparalleled insights into market conditions.
Under the Broadview Underpriced & Overpriced framework, assets that are deemed oversold and positioned below the special moving average are identified as Underpriced. This designation implies that the asset's current price is undervalued relative to its intrinsic worth, presenting an opportune moment to consider initiating a buying position. Underpriced assets are represented by a vibrant purple color on the indicator, symbolizing the potential for significant buying opportunities.
Conversely, assets that are considered overbought and situated above the special moving average are labeled as Overpriced. This classification indicates that the asset's current price has exceeded its intrinsic value, suggesting a favorable moment to contemplate selling or reducing exposure to the asset. Overpriced assets are visually depicted by a striking teal color, signifying the potential for optimal selling opportunities.
Moreover, the Broadview Underpriced & Overpriced indicator recognizes a third category known as Discounted assets. These assets are characterized by being positioned above the special moving average while simultaneously experiencing oversold conditions. This classification suggests that although the asset's price may be above its average value, it is currently available at a discounted price relative to its long-term potential. Discounted assets are represented by a deep purple hue, indicating an opportunity for buyers to consider making purchases with a lower aggression dollar-cost averaging (DCA) strategy.
Lastly, the indicator identifies Inflated assets as those positioned below the special moving average while concurrently exhibiting overbought conditions. This classification implies that the asset's price may be temporarily inflated compared to its intrinsic worth. Inflated assets are depicted by a rich teal color, representing an indication for trend traders or those looking to capitalize on consolidations.
The Broadview Underpriced & Overpriced indicator brings forth a groundbreaking evolution in asset classification, meticulously combining the Overbought & Oversold Heatmap with the influence of special moving averages. Through this unique fusion, traders and investors gain access to an unprecedented level of insight, enabling them to make informed decisions based on a comprehensive evaluation of market trends.
The Broadview Underpriced & Overpriced indicator represents a paradigm shift in asset classification, uniting science, technology, and mathematical finance to deliver an innovative and comprehensive trading tool. By leveraging special moving averages in conjunction with the Overbought & Oversold Heatmap, this indicator enables traders, investors, and institutions to categorize assets as Underpriced, Overpriced, Discounted, or Inflated. Its visually captivating color scheme and strategic insights empower market participants to navigate market trends with precision, enhancing their ability to capitalize on optimal buying and selling opportunities while employing various trading strategies.

Boxes_PlotIn the world of data visualization, heatmaps are an invaluable tool for understanding complex datasets. They use color gradients to represent the values of individual data points, allowing users to quickly identify patterns, trends, and outliers in their data. In this post, we will delve into the history of heatmaps, and then discuss how its implemented.
The "Boxes_Plot" library is a powerful and versatile tool for visualizing multiple indicators on a trading chart using colored boxes, commonly known as heatmaps. These heatmaps provide a user-friendly and efficient method for analyzing the performance and trends of various indicators simultaneously. The library can be customized to display multiple charts, adjust the number of rows, and set the appropriate offset for proper spacing. This allows traders to gain insights into the market and make informed decisions.
Heatmaps with cells are interesting and useful for several reasons. Firstly, they allow for the visualization of large datasets in a compact and organized manner. This is especially beneficial when working with multiple indicators, as it enables traders to easily compare and contrast their performance. Secondly, heatmaps provide a clear and intuitive representation of the data, making it easier for traders to identify trends and patterns. Finally, heatmaps offer a visually appealing way to present complex information, which can help to engage and maintain the interest of traders.
History of Heatmaps
The concept of heatmaps can be traced back to the 19th century when French cartographer and sociologist Charles Joseph Minard used color gradients to visualize statistical data. He is well-known for his 1869 map, which depicted Napoleon's disastrous Russian campaign of 1812 using a color gradient to represent the dwindling size of Napoleon's army.
In the 20th century, heatmaps gained popularity in the fields of biology and genetics, where they were used to visualize gene expression data. In the early 2000s, heatmaps found their way into the world of finance, where they are now used to display stock market data, such as price, volume, and performance.
The boxes_plot function in the library expects a normalized value from 0 to 100 as input. Normalizing the data ensures that all values are on a consistent scale, making it easier to compare different indicators. The function also allows for easy customization, enabling users to adjust the number of rows displayed, the size of the boxes, and the offset for proper spacing.
One of the key features of the library is its ability to automatically scale the chart to the screen. This ensures that the heatmap remains clear and visible, regardless of the size or resolution of the user's monitor. This functionality is essential for traders who may be using various devices and screen sizes, as it enables them to easily access and interpret the heatmap without needing to make manual adjustments.
In order to create a heatmap using the boxes_plot function, users need to supply several parameters:
1. Source: An array of floating-point values representing the indicator values to display.
2. Name: An array of strings representing the names of the indicators.
3. Boxes_per_row: The number of boxes to display per row.
4. Offset (optional): An integer to offset the boxes horizontally (default: 0).
5. Scale (optional): A floating-point value to scale the size of the boxes (default: 1).
The library also includes a gradient function (grad) that is used to generate the colors for the heatmap. This function is responsible for determining the appropriate color based on the value of the indicator, with higher values typically represented by warmer colors such as red and lower values by cooler colors such as blue.
Implementing Heatmaps as a Pine Script Library
In this section, we'll explore how to create a Pine Script library that can be used to generate heatmaps for various indicators on the TradingView platform. The library utilizes colored boxes to represent the values of multiple indicators, making it simple to visualize complex data.
We'll now go over the key components of the code:
grad(src) function: This function takes an integer input 'src' and returns a color based on a predefined color gradient. The gradient ranges from dark blue (#1500FF) for low values to dark red (#FF0000) for high values.
boxes_plot() function: This is the main function of the library, and it takes the following parameters:
source: an array of floating-point values representing the indicator values to display
name: an array of strings representing the names of the indicators
boxes_per_row: the number of boxes to display per row
offset (optional): an integer to offset the boxes horizontally (default: 0)
scale (optional): a floating-point value to scale the size of the boxes (default: 1)
The function first calculates the screen size and unit size based on the visible chart area. Then, it creates an array of box objects representing each data point. Each box is assigned a color based on the value of the data point using the grad() function. The boxes are then plotted on the chart using the box.new() function.
Example Usage:
In the example provided in the source code, we use the Relative Strength Index (RSI) and the Stochastic Oscillator as the input data for the heatmap. We create two arrays, 'data_1' containing the RSI and Stochastic Oscillator values, and 'data_names_1' containing the names of the indicators. We then call the 'boxes_plot()' function with these arrays, specifying the desired number of boxes per row, offset, and scale.
Conclusion
Heatmaps are a versatile and powerful data visualization tool with a rich history, spanning multiple fields of study. By implementing a heatmap library in Pine Script, we can enhance the capabilities of the TradingView platform, making it easier for users to visualize and understand complex financial data. The provided library can be easily customized and extended to suit various use cases and can be a valuable addition to any trader's toolbox.
Library "Boxes_Plot"
boxes_plot(source, name, boxes_per_row, offset, scale)
Parameters:
source (float ) : - an array of floating-point values representing the indicator values to display
name (string ) : - an array of strings representing the names of the indicators
boxes_per_row (int) : - the number of boxes to display per row
offset (int) : - an optional integer to offset the boxes horizontally (default: 0)
scale (float) : - an optional floating-point value to scale the size of the boxes (default: 1)
ATR OSC and Volume Screener (ATROSCVS)In today's world of trading, having the right tools and indicators can make all the difference. With the vast number of cryptocurrencies available, I've found it challenging to keep track of the market's overall direction and make informed decisions. That's where the ATR OSC and Volume Screener comes in, a powerful Pine Script that I use to identify potential trading opportunities across multiple cryptocurrencies, all in one convenient place.
This script combines two essential components: the ATR Oscillator (ATR OSC) and a Volume Screener. It is designed to work with the TradingView platform. Let me explain how this script works and how it benefits my trading.
Firstly, the ATR Oscillator is an RSI-like oscillator that performs better under longer lookback periods. Unlike traditional RSI, the ATR OSC doesn't lose its min and max ranges with a long lookback period, as the scale remains intact. It calculates the true range by considering the high, low, open, and close prices of a financial instrument, and uses this true range instead of the standard deviation in a modified z-score calculation. This unique approach helps provide a more precise assessment of the market's volatility.
The Volume Screener, on the other hand, helps me identify unusual trading volumes across various cryptocurrencies. It employs a normalized volume calculation method, effectively filtering out outliers and highlighting potentially significant trading opportunities.
One feature I find particularly impressive about the ATR OSC and Volume Screener is its versatility and the way it displays information using color gradients. With support for over 30 different cryptocurrencies, including popular options like Bitcoin (BTC), Ethereum (ETH), Ripple (XRP), and Dogecoin (DOGE), I can monitor a wide range of markets simultaneously. The color gradient on the grid is visually appealing and makes it easy to identify the strength of the indicators for each cryptocurrency, allowing me to make quick comparisons and spot potential trading opportunities.
The customizable input options allow me to fine-tune the script to suit my individual trading preferences and strategies. In summary, the ATR OSC and Volume Screener has been an invaluable tool for me as I navigate the ever-evolving world of cryptocurrencies. By combining the power of the ATR Oscillator with a robust Volume Screener, this Pine Script makes it easier than ever to identify promising trading opportunities and stay ahead of the game.
The color gradient in the ATR OSC and Volume Screener is essential for visually representing the data on the heatmap. It uses a range of colors to indicate the strength of the indicators for each cryptocurrency, making it easier to understand the market dynamics at a glance.
In the heatmap, the color gradient typically starts from a cooler color, such as blue or green, at the lower extremes (low ATR OSC values) and progresses towards warmer colors, like yellow, orange, or red, as the ATR OSC values approach the upper extremes (high ATR OSC values). This color-coding system enables me to quickly identify and interpret the data without having to examine individual numerical values.
For example, cooler colors (blue or green) might represent lower values of the ATR Oscillator, suggesting oversold conditions in the respective cryptocurrencies. On the other hand, warmer colors (yellow, orange, or red) indicate higher ATR OSC values, signaling overbought market conditions. This visual representation allows me to make rapid comparisons between different cryptocurrencies and spot potential trading opportunities more efficiently.
By utilizing the color gradient in the heatmap, the ATR OSC and Volume Screener simplifies the analysis of multiple cryptocurrencies, helping me to quickly identify market trends and make better-informed trading decisions.
I highly recommend testing the ATR OSC and Volume Screener and seeing the difference it can make in your trading decisions. Happy trading!

Net Positions (Net Longs & Net Shorts) - By LeviathanThis script is an experimental indicator that visualizes the entering and exiting of long and short positions in the market. It also includes other useful tools, such as NL/NS Profile, NL/NS Delta, NL/NS Ratio, Volume Heatmap, Divergence finder, Relative Strength Index of Net Longs and Net Shorts, EMAs and VWMAs and more.
To avoid misinterpretation, it's important to understand some basics. The “real” ratio between net long and net short positions in a given market is always 1:1. A futures contract is an agreement between two parties to buy or sell an underlying asset at an agreed-upon price. Each contract has a long side and a short side, with one party agreeing to buy (long) and the other party agreeing to sell (short) the asset at the agreed-upon price. The long position holder anticipates that the asset's price will rise, while the short position holder expects it to fall. Because every futures contract involves both a buyer and a seller, it is impossible to have more net longs than net shorts or vice versa (in terms of the net value). For every long position opened, there must be a corresponding short position taken by another market participant (and vice versa), thus maintaining the 1:1 ratio between longs and shorts. While there can be an imbalance in the number of traders/accounts holding long and short contracts, the net value of positions held on each side remains 1 to 1.
Open Interest (OI) is a metric that tracks the number of open (unsettled) contracts in a given market. For example, Open Interest of 100 BTC means that there are currently 100 BTC worth of longs and 100 BTC worth of shorts open in the market. There may be more traders on one side holding smaller positions, and fewer traders on the other side holding larger positions, but the net value of positions on one side is equal to the net value of positions on the other side → 100 BTC in longs and 100 BTC in shorts (1:1). Consider a scenario in which a trader decides to open a long position for 1 BTC at a price of HKEX:30 ,000. For this long order to be executed, a counterparty must take the opposite side of the contract by placing an order to short 1 BTC at the same price of HKEX:30 ,000. When both the long and short orders are matched and executed, the open interest increases by 1 BTC, reflecting the addition of this new contract to the market.
Changes in Open Interest essentially tell us 3 things:
- OI Increase - new positions entered the market (both longs and shorts!)
- OI Decrease - positions exited the market (both longs and shorts!)
- OI Flat - no change in open positions due to low activity or simply lots of transfers of contracts
However, different concepts can be used to analyze sentiment, aggressiveness, and activity in the market by analyzing data such as Open Interest, price, volume, etc. This indicator combines Open Interest data and price action to simplify the visualization of positions entering and exiting the market. It is based on the following concept:
Increase in Open Interest + Increase in price = Longs Opening
Decrease in Open Interest + Decrease in price = Longs Closing
Increase in Open Interest + Decrease in price = Shorts Opening
Decrease in Open Interest + Increase in price = Shorts Closing
When "Longs Opening" occurs, the OI Delta value is added to the running total of Net Longs, and when "Longs Closing" occurs, the OI Delta value is subtracted from the running total of Net Longs.
When "Shorts Opening" occurs, the OI Delta value is added to the running total of Net Shorts, and when "Shorts Closing" occurs, the OI Delta value is subtracted from the running total of Net Shorts.
To summarize:
Net Longs: Cumulative value of Longs Opening and Longs Closing (LO - LC)
Net Shorts: Cumulative value of Shorts Opening and Shorts Closing (SO - SC)
Net Delta: Net Longs - Net Shorts
Net Ratio: Net Longs / Net Shorts
This is the fundamental logic of how this script functions, but it also includes several other tools and options. Here is an overview of the settings:
Type:
- Net Positions (display values of Net Longs, Net Shorts, Net Delta, Net Ratio as described above)
- Relative Strength (display Net Longs, Net Shorts, Net Delta, Net Ratio in the form of a momentum oscillator that measures the speed and change of movements. Same logic as RSI for price)
Display as:
- Candles (display the data in the form of candlesticks)
- Lines (display the data in the form of candlesticks)
- Columns (display the data in the form of columns)
Cumulation:
- Visible Range (data is cumulated from the first visible bar on your chart)
- Full Data (data is cumulated from the beginning)
Quoted in:
- Base Currency (all data is presented in the pair’s base currency eg. BTC)
- Quote Currency (all data is presented in the pair’s quote currency eg USDT)
OI Sources
- Pick the sources from where the data is collected (if available).
Net Positions:
- NET LONGS (show/hide Net Longs plot, choose candle colors, choose line color)
- NET SHORTS (show/hide Net Shorts plot, choose candle colors, choose line color)
- NET DELTA (show/hide Net Delta plot, choose candle colors, choose line color)
- NET RATIO (show/hide Net Ratio plot, choose candle colors, choose line color)
Moving Averages:
- Type (choose between EMA and Volume Weighted Moving Average)
- NET LONGS (show/hide NL moving average plot, choose length, choose color)
- NET SHORTS (show/hide NS moving average plot, choose length, choose color)
- NET DELTA (show/hide ND moving average plot, choose length, choose color)
- NET RATIO (show/hide NR moving average plot, choose length, choose color)
Profile:
- Profile Data (choose the source data of the profile)
- Value Area % (set the percentage width of profile’s value area)
- Positions (set the position of the profile to left or right of the visible range)
- Node Size (set the relative size of nodes to make them appear smaller or larger)
- Rows (select the amount of rows displayed by the profile to control granularity)
- POC (show/hide POC- Point Of Control and select its color)
- VA (show/hide VA- Value Area and select its color)
Divergence finder
- Source (choose the source data used by the script to compare it with price pivot points)
- Maximum distance (the maximum distance between two divergent pivot points)
- Lookback Bars Left (the number of bars to the left of the current bar that the function will consider when looking for a pivot point)
- Lookback Bars Right (the number of bars to the right of the current bar that the function will consider when looking for a pivot point)
Stats:
- Show/Hide the Stats table
- Bars Back (choose the length of data analyzed for stats in number of bars)
- Position (choose the position of the Stats table)
- Select Data you want to display in the Stats table
Additional Settings:
- Volume Heatmap (show/hide volume heatmap and select its color)
- Label Offset (select how much the plot label is shifted to the right
- Position Relative Strength Length (select the length used in the calculation)
- Value Label (show/hide OI Delta values when candles are displayed)
- Plot Labels (show/hide the labels next to the plot)
- Wicks (show/hide wick when candles are displayed)
Code used for generating profiles is taken from @KioseffTrading's "Profile Any Indicator" script (used with author's permission)
