Hull50Signals are based on Hull 50 length
You can change the length if you want it to buy more or less
have fun
船體移動平均線(HMA)


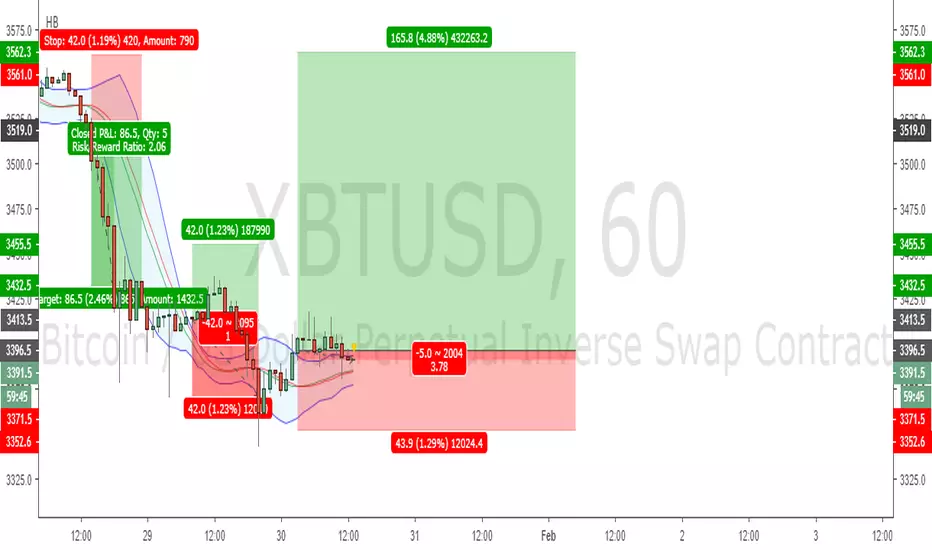
Hull & Candle CrossoverA Hull moving average and candle crossover.
(2 hullMA's and present to past candle value calculation and smoothing function)
Enters order on Hull1 vs Hull2 crossover, Exits order on Price vs Candle crossover
Strategy looks at the previous(1) candle value to calculate current price so it lags 1 candle (to avoid repainting)
Any timeframe and pair ok, just change settings to suit
commission is included in the default result

inwCoin HMA AlertinwCoin HMA alert for inwCoin HMA Strategy.
If you want to use this alert signal, please donate me 0.005 BTC for my electric bill/coffee/food to this address ( the man got to eat )
BTC : 3BRLGDEtNYpSPVD7YtKNZzVREsi1smcvvi
And send inform me about your donation, and I'll add you to access my alert script :)
If you need me to customize the script/alert/strategy to match your exchange, please let me know, and I'll do it for 0.01 BTC :)
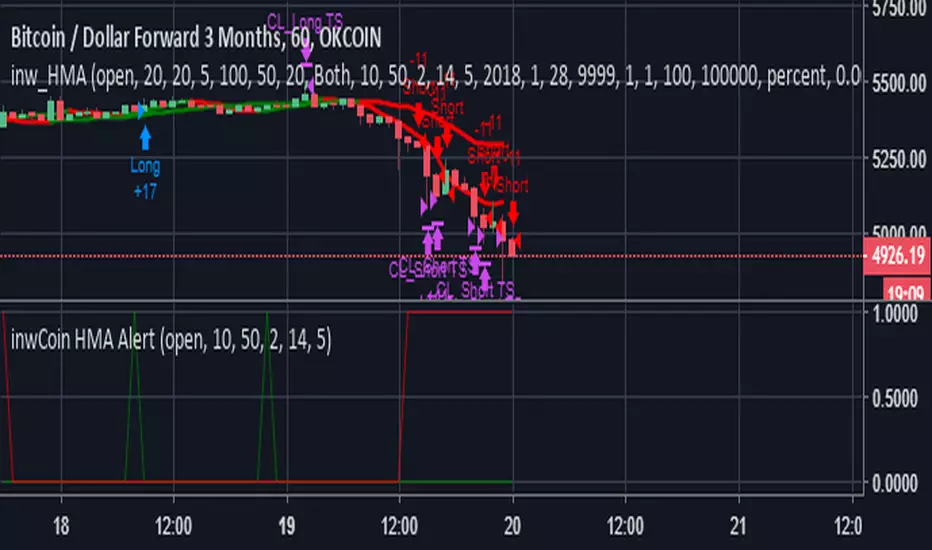
inwCoin HMA AlertSimple alert to go along with the inwCoin HMA Strategy
Please not that the alerts are persistent 2.70% , if you already enter the position,
just ignore the rest of the same alert until the opposite alert show up
( long then short / or short then long , if change, just close and enter opposite position )
You can set the alert and let it tell you to iOS app via TradingView app ( yey! )
Please note that, if you don't have bot to track your trailing start/stop. you have to enter the TP/SL manually ( also tracking the position )
So... be careful to follow this alert. just try it with small amount of money first.
and make sure to set stop loss every time because OKEX is a portfolio killer if you don't have any stop loss.
** if you cannot trailing stop bot, just uncheck the "Aggressive Strategy" in both strategy and alert to reduce alert to minimum level.

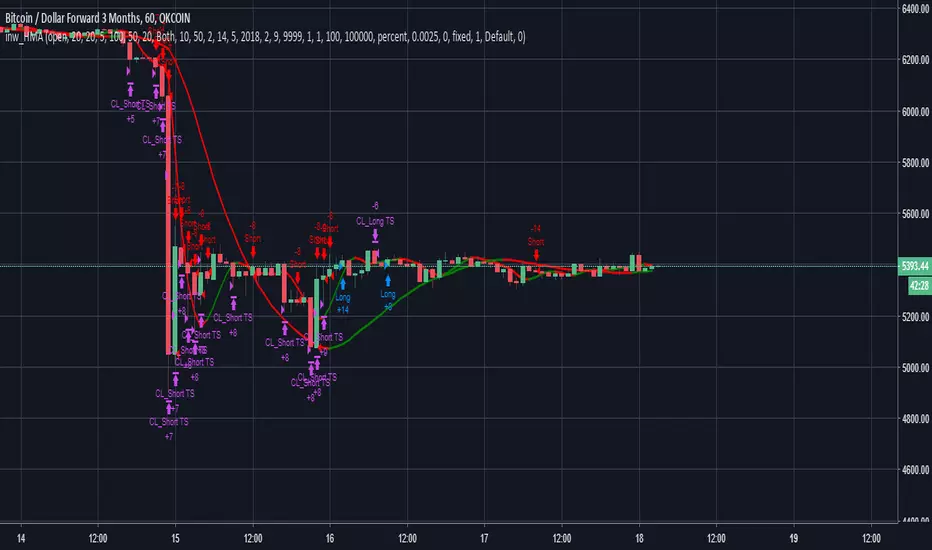
inwCoin HMA StrategySuper duper strategy using HMA ( Hull Moving Average ) 10 and 50 for decided entry ( short / long )
There are 2 type of strategies, you can choose with checkbox.
(1) Aggressive Strategy Ticked
* If ticked, strategy will enter position again if the condition met. ( both line red ) after Taking Profit ( or Stop Loss )
* It will use trailing start/stop so the profit is kinda crazy ( and yes, impossible in real world lol )
* The problem is, it will enter position like crazy and you might get a lot of loss from fee
(2) Aggressive Strategy not Ticked
* It will enter once only ( HMA10 just changed color to the same as HMA50 )
* If TP or SL already, it will wait for next signal
* Less trade, less profit, but safer. ( wait for right signal )
** For Aggressive Strategy, you can't select the date from 1/1/2018 because the trade record is way too much .... lol
** You can experiment yourself with other exchange/coin as your like.
=============================================
Test Data Detail
=============================================
Exchange : OKEX
Coin : BTCUSD3M
Timeframe : 1H
Date range : 2018/2/9 - 2019/1
For : Trailing with bot ( If you have one :P )
Config
Trade % = 20 ( You can increase trade size of your total port but it will get you into more risky trade. ( but yes, more profit ) ... u can increase trade size if you have enough profit
Trailing Start = 20 ( If you can write bot, it will start trailing when the profit % reach this value )
Trailing Stop = 5 (If you can write bot, it will take profit if the profit drop below this value from trailing start.)
Take Profit = It will set fixed TP for whipsaw case ( rarely reach this target )
Stop % = 50 ( so this trade is RR = 2 nice! )
Leverage = 20 ( so we can withstand the price fluctuation and not get liquidated, if you trade spot, please choose 1 also, please adjust TP and stop accordingly eg. leverage 1 / TP = 20 / SL = 10 )
Trade Direction = Both ( for margin market, if you want to trade spot like Binance you can choose long only )
Hull 1 Length = 10 ( Fast HMA length)
Hull 2 Length = 50 ( Slow HMA length)
Hull trend test length = 2 ( hull test range for rising or down trend )
Aggressive Strategy = YES ( enter next position if condition met immediately )
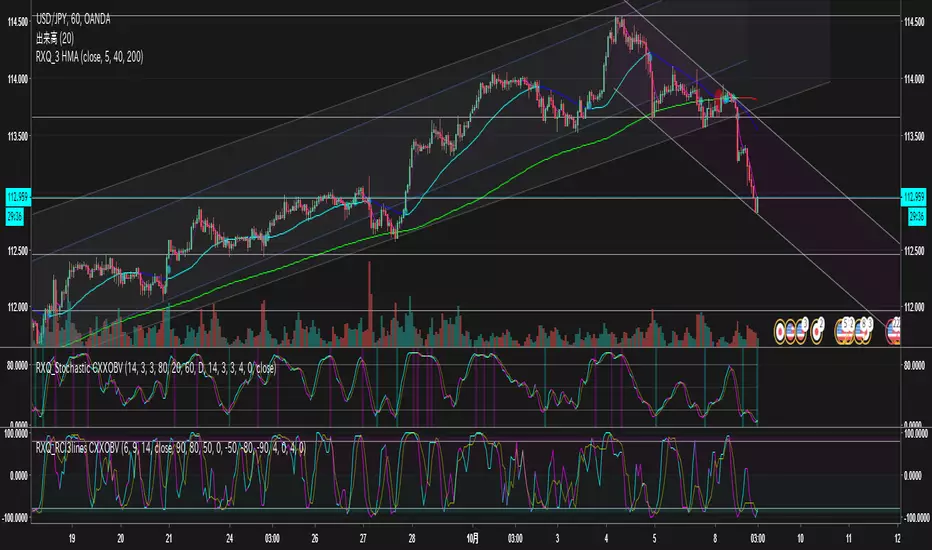
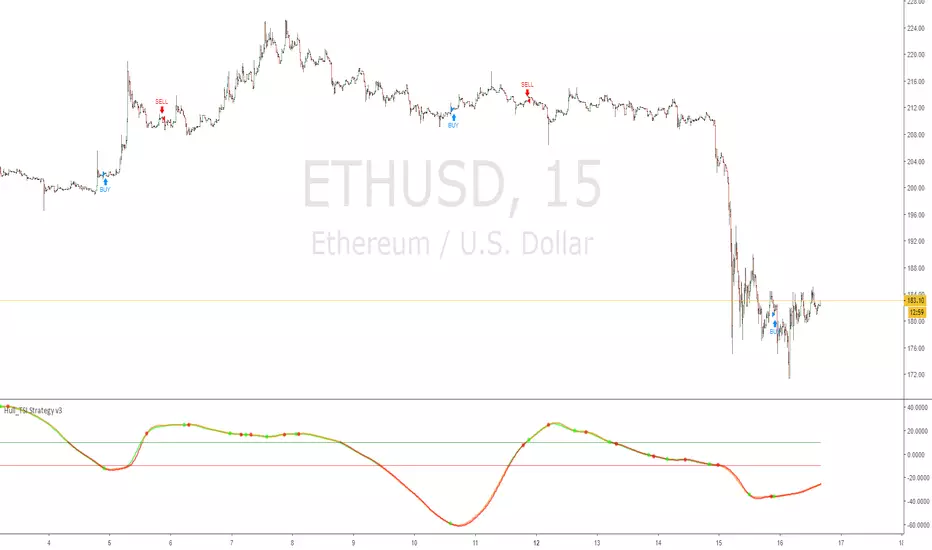
Hull_TSI Strategy v3True Strength Index, but Exponential Moving Average taken out and replaced with Hull Moving Average
this version uses 3 Hull MA's as well as the TSI value crossovers above or below the upper/lower lines
This version is the closest to the API bot featured at gekkoplus.com
Hull_TSI bot is competing in the competition
" Gekko Plus is hosting a strategy contest. Submit the best performing Gekko strategy and win 0.1 BTC! "
15 Nov 2018: Strategy contest start
10 Dec 2018: Strategy contest end
12 Dec 2018: Contest evaluation, announcement of winners!
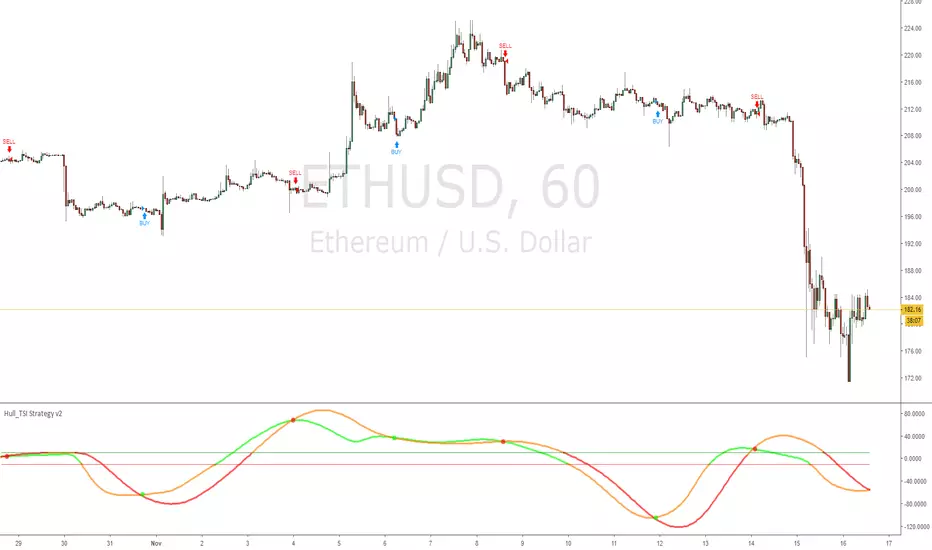
Hull_TSI Strategy v2True Strength Index, but Exponential Moving Average taken out and replaced with Hull Moving Average
this version uses only the crossover of the TSI values
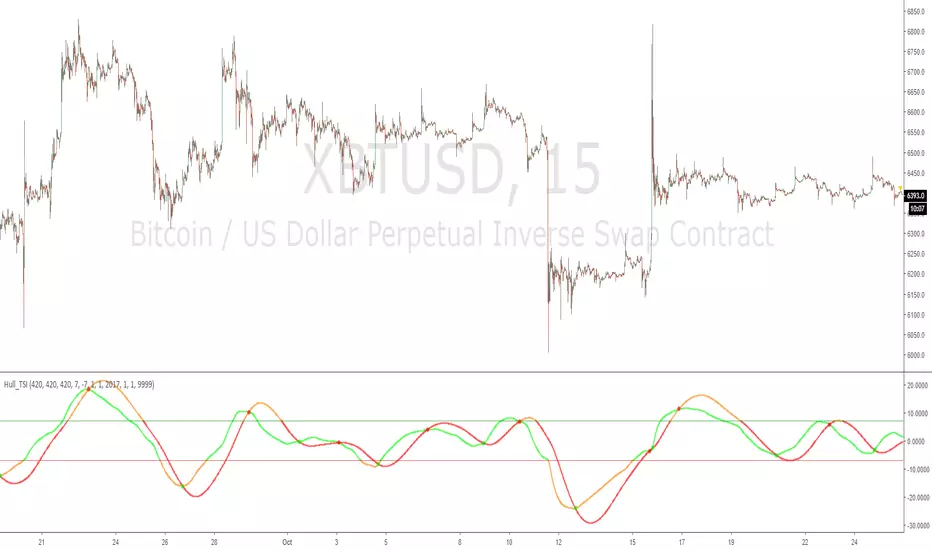
Hull_TSITrue Strength Index, but Exponential Moving Average taken out and replaced with Hull Moving Average
increase the values for increased timeframes i found good on 1hour chart 700,700,700 (instead of 420)
this is the indicator version, hopefully Alert friendly with each plot named
HULL_FIB Strategy2 Hull Ma's
Long Hull MA FIB Lines
It will Sell when reaches upper 0.618 Fib and Hull(short_period)has crossed over to selling
it will close sell by TP or SL or when reaches lower 0.618 Fib
Buy is opposite that
here is how it makes the FIBS:
================================================
mult = input(3.0, minval=0.001, maxval=50)
basis = func_hma(price, HMAlengthLong)
dev = mult * stdev(price, HMAlengthLong)
upper_1= basis + (0.236*dev)
upper_2= basis + (0.382*dev)
upper_3= basis + (0.5*dev)
upper_4= basis + (0.618*dev)
upper_5= basis + (0.764*dev)
upper_6= basis + (1*dev)
lower_1= basis - (0.236*dev)
lower_2= basis - (0.382*dev)
lower_3= basis - (0.5*dev)
lower_4= basis - (0.618*dev)
lower_5= basis - (0.764*dev)
lower_6= basis - (1*dev)
plot(basis, color=orange, linewidth=2)
p1 = plot(upper_1, color=gray, linewidth=1, title="0.236")
p2 = plot(upper_2, color=gray, linewidth=1, title="0.382")
p3 = plot(upper_3, color=gray, linewidth=1, title="0.5")
p4 = plot(upper_4, color=black, linewidth=2, title="0.618")
p5 = plot(upper_5, color=gray, linewidth=1, title="0.764")
p6 = plot(upper_6, color=red, linewidth=2, title="1")
p13 = plot(lower_1, color=gray, linewidth=1, title="0.236")
p14 = plot(lower_2, color=gray, linewidth=1, title="0.382")
p15 = plot(lower_3, color=gray, linewidth=1, title="0.5")
p16 = plot(lower_4, color=black, linewidth=2, title="0.618")
p17 = plot(lower_5, color=gray, linewidth=1, title="0.764")
p18 = plot(lower_6, color=green, linewidth=2, title="1")
=================================================

HMA + ATR CLOUD SYSTEMPlaying around with some ideas. Hull MA's have good entries and exits on their own, but together with ATR I find them to be even more solid. Only tested with crypto. Best results on daily timeframe and long only.
Stop loss, trailing and pyramiding code is functional. There is also a long only / short only option in the bottom of the settings.
Let me know what you think

Hull_TSI StrategyTrue Strength Index, but Exponential Moving Average taken out and replaced with Hull Moving Average
increase the values for increased timeframes i found good on 1hour chart 700,700,700 (instead of 420)

Hull Moving Average Cloud v2Hull Moving Average Cloud, is not the normal Hull crossover, instead opens orders at cross of price and alternative Hull MA configuration (stretches/shrinks with momentum)
Has history settings, Commission already included in result. Only looks into past, should be no repaint (im sure the trolls will correct me if im wrong, thankyou trolls i can always count on you)
Source code open, if you find improvement please share thankyou


Hull Moving Average x3 StrategyThree Hull Moving Average Crossovers , user can choose different history data periods, and timeframe ( indicator can look at timeframes other than just the current chart timeframe )
commission is already included in this result

Hull_Cloud3 Hull Ma's, cloud is made by the Mid and Long Hulls, entry and exit rules calculated with Short Hull (normal crossover) and edges of cloud
This has commission already accounted for, and has the backtesting time selection settings
so user can test any particular history data period

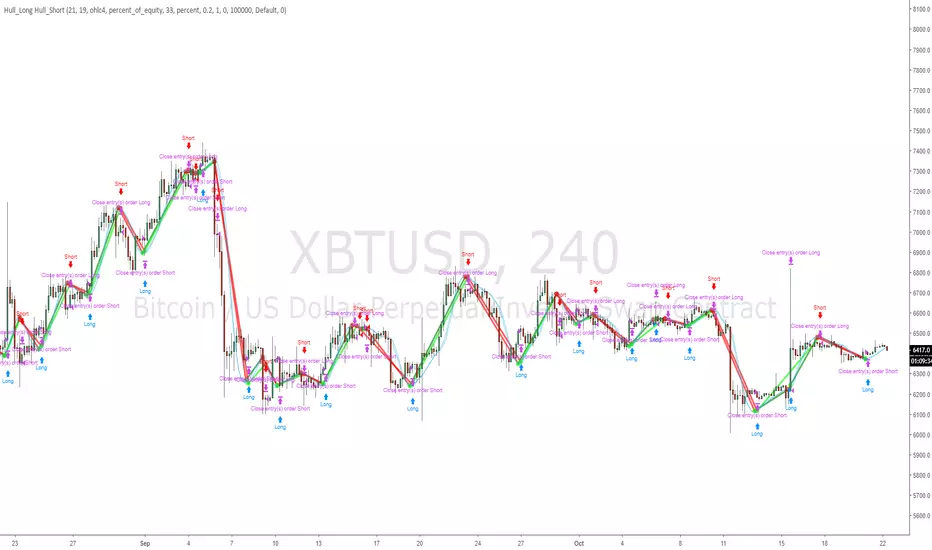
Hull_Long Hull_ShortHull Moving Average only, x2
Hull_Long = open orders
&
Hull_Short = close orders
profitable with commission of: 0.2% ( common taker/market order fee )
📊 Advanced Charts Suite v2.1 by 🇨🇷🇾🇵🇹🇴🇷🇹🇭🇾🇭🇲🇸📊With the advanced charts suite you get multiple indicators you can overlay on your charts, while only using one indicator slot.
🎁We made this after requests from our members, to assist those who use a free TV account. Its not advised to use them all at once, use them in combinations and see what works for you!
🕥 It can take a minute or more to load... be patient! I wanted to include more indicators, but hit some of the limits imposed by pine script. All options are off by default.
📊 Indicators Included are:
✅Ichimoku Cloud
✅Support Resistance Fractal
✅Trailing Long/Short Stoploss
✅Bull Bear Squares
✅Triple Hull Moving Average
✅Standard Hull Moving Average
✅Fibonacci Daily
✅Advance Decline Lines
👍If you enjoy the Charts Suite, please like the indicator, and follow me on TradingView!
💬Come chat with us in telegram (link in signature) if you have any questions or would like a trial of a premium indicators (linked below).

Hullinger Bands StrategyLike Bollinger Bands, but with Hull MA
seems to work on all pairs and timeframes


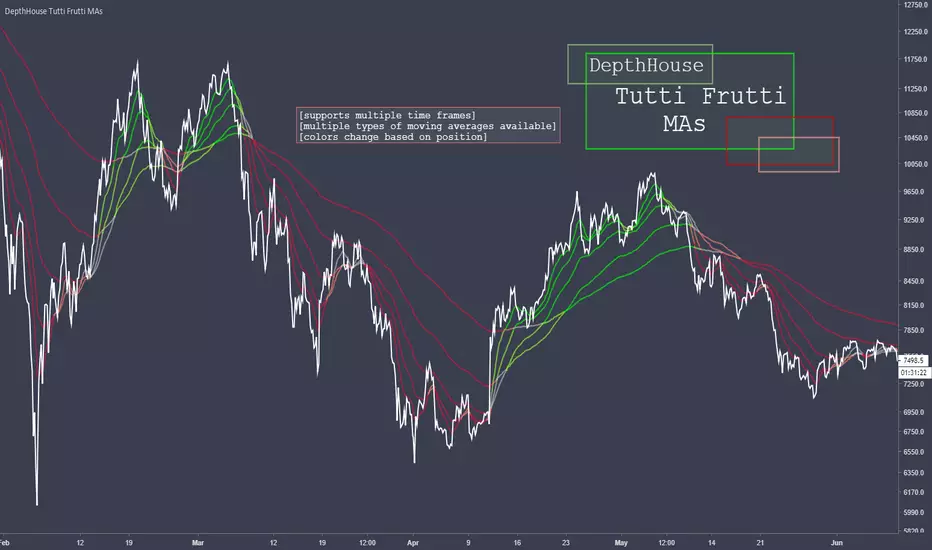
DepthHouse Tutti Frutti Moving AveragesDepthHouse Tutti Frutti Moving Averages combines the use of up to 5 Moving Averages that change colors based upon their position.
This indicator has full MTF support (multiple-time-frame). Meaning you can lock the moving averages to a specific time frame.
Currently Supported MA types:
SMA
EMA
SMMA
Hull MA
WMA
Multiple Time Frame Option
My favorite feature is the ability to lock the displayed moving averages to a specific time frame.
Say you wish to view the 30 min chart while keeping the 60 minute moving averages. Just turn this feature on!
This is a free indicator so please enjoy!
Leave questions and requests in the comments below!