Indicators OverlayHello All,
This script shows the indicators in separate windows on the main chart. Included indicators are RSI, CCI, OBV, Stochastic, Money Flow Index, Average True Range and Chande Momentum Oscillator. indicator windows are located at the top or bottom of the chart according to last moves of the Closing price. Different colors are used for each indicator. Horizontal levels are shown as dashed line and label as well.
Using the options;
You can enable/disable the indicators you want to see or not
You can change source and length for each indicator
You can set window length. using this length indicator windows are located on the chart
After you added this indicator to your chart I recommend: right click on any of the indicator windows => "Visual Order" => "Bring to front" as seen screenshot below:
in this example only 3 indicators enabled and period is set as 80:
indicator windows moves to the top or bottom of the chart according to the close price:
P.S. if you want to see any other indicator in the options then leave a comment under the indicator ;)
Enjoy!
Indicators

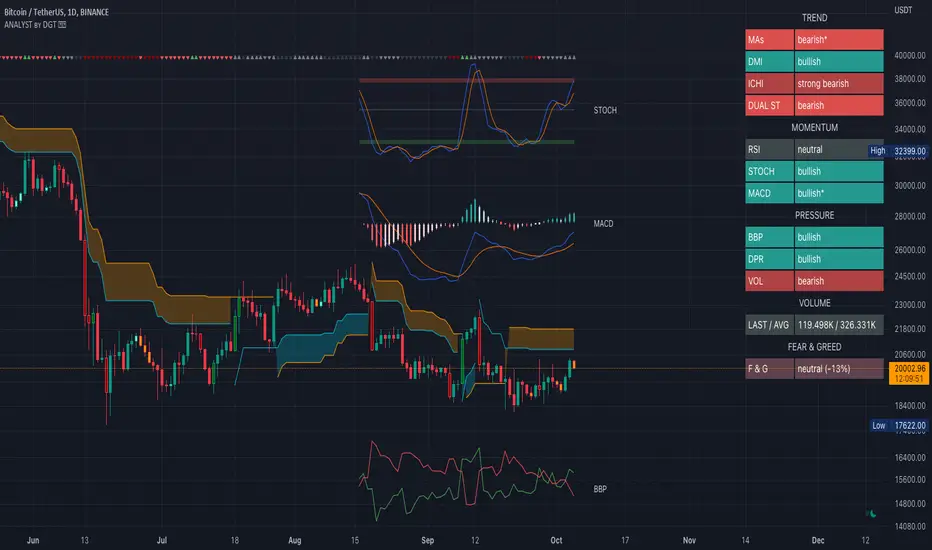
Technical Analyst by DGTWho needs a Technical Analyst?
yes I can hear someone is asking for, and here is one that can help you with technical analysis
The analyst will present a technical anlaysis report at a glance calculated by the most popular technical indicators , and the good part, the anlayst will do it voluntarily
technical skills of the analyst:
- experienced an all markets
- ability to interpret moving averages
- ability to interpret volume changes
- ability to interpret trend folowing indicators such as:
* directional movement index (dmi), identify trend strength and trend direction
* complex ichimoku cloud , identify trend stregth, and tk crosses
- ability to interpret oscillators such as:
* relative strength index, identify oversold overbought levels, identify the rsi flow
* commodity channel index, identify oversold overbought levels
* awesome identify if grawing or falling
* macd if bullish or bearish, and macd histogram if grawing or falling
- ability to calculate probability and its trend
- non-stop hardworker,
- available 7/24,
- highly dedicated always on duty,
- open for new ideas and willing to learn
- upon request the analyst will create reports with custom settings of your choise
the analyst is not a decition maker, trading success is all about following your trading strategy and the analyst aims to help with the presented reports calculated by the most popular technical indicators
the analyst supports 9 of the popular technical indicators and is willing to learn more , please share your comments and feedbacks and help the analyst improve skills
cheers!
Disclaimer : The script is for informational and educational purposes only. Use of the script does not constitutes professional and/or financial advice. You alone the sole responsibility of evaluating the script output and risks associated with the use of the script. In exchange for using the script, you agree not to hold dgtrd TradingView user liable for any possible claim for damages arising from any decision you make based on use of the script
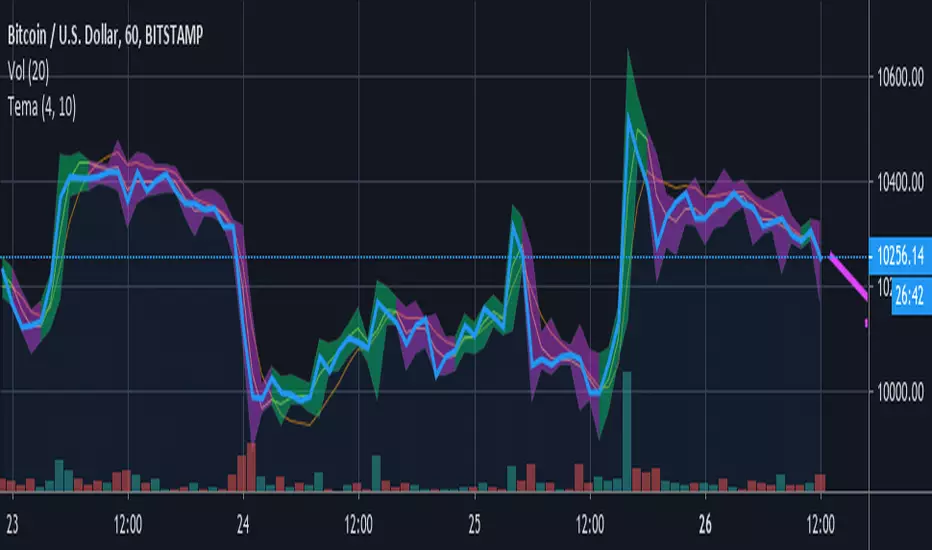
Team TemaTema highlights bars based on the triple ema ( tema ) with two different length qualifiers.
The tema is believed to react quicker to price fluctuations than the simple moving average ( sma ), the exponential moving average ( ema ), and the double ema ( dema ). The shorter length tema crossing over the longer one is believed to indicate a bullish trend ahead, highlighted in green. The shorter length crossing below the longer one may indicate a bearish trend is on the way.
Benefits.
It has been found that most traders lose money because they panic early, and don't let profits run. Tema helps me to filter out trading noise , reduce stress and stay in profitable trades longer . Highlighting the candle wicks reveals trends in highs and lows that may be difficult to see otherwise. I like being able to adjust the settings and look back to see how much noise would have been good to filter out.
Things to watch out for.
Like other moving averages, the tema is a lagging indicator , vulnerable to false signals, especially during a large move up or down . Use with other indicators that are better designed for detecting tops and bottoms. Adjust the lengths to filter out what you think may be wrong signals. The settings are subjective , and it depends on the security and the time period. Manually create a note or reminder with your favorite settings for each. You may choose how much price fluctuation to filter out by going into settings, marked with the gear icon.
Unconfirmed sentiment arrow.
Tema draws an arrow of current sentiment , based on the unconfirmed price action of the faster tema. It shows where it thinks prices are presently going, barring other factors. Its main purpose is to extend a line from the end of the tema, so it is not difficult to see. Remember, it is probably wrong until the last bar closes. And even then, buyers or sellers could come along at any moment and change the outlook.
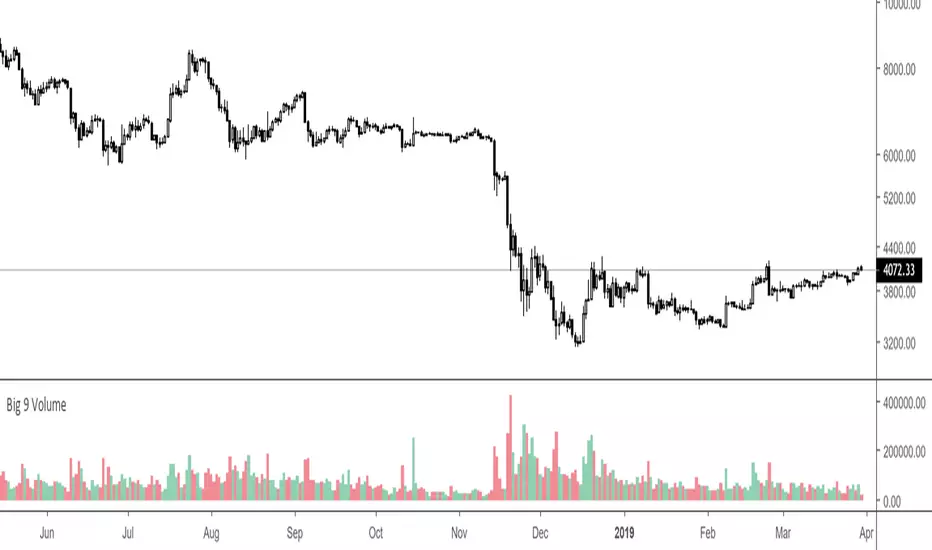
Big 9 Volume - Volume indicator from exchanges with real volumeHere is a very basic indicator combining the volumes of the 9 biggest exchanges trading BTC/USD or BTC/USDT. These 9 exchanges were chosen based on the report by Bitwise Invest stating that 95% of the volume on CoinMarketCap is fake. On these 9 exchanges, however, volume data appears to be reliable. Please note BitFlyer was not included because it does not trade in USD. Please note also that data on all 9 exchanges is only available from June 2018.
Anyone is welcome to modify this and make it more elegant, this was just a quick implementation.
Linear Momentum and Performance Indicators (IFTA Jan 2019)This a porting to Trading View of the 12 new indicators introduced in IFTA Journal (January Edition) by Akram El Sherbini, MFTA, CFTe, CETA.
Indicators are available in "Linear Momentum and Performance Indicators" at page four.
IFTA Journal is available below:
ifta.org
Indicators implemented herein:
Linear Force Index: The linear force index LFI measures the force of buyers and sellers during rallies and declines, respectively. It combines two important pieces of market information—the price acceleration
and volumes.
Pressure Index: The pressure index PRI measures the buying and selling pressure over a certain range within a time interval by moving around its zero line. The index indicates a rise in buying pressure when it crosses above the zero line and a rise in selling pressure
when it crosses below the zero line level. The buying and selling force moves the last price during the session to form a range with low and high boundaries.
Strength Index Index : The strength index SI is a leading indicator to the pressure index. It measures the ability of buyers to resist sellers and vice versa. SI of today is the ratio of the latest pressure index value to the strain of today.
Power Index : It measures the buying and selling power within a time interval by moving around its zero line.
Intensity Index : The intensity index II measures the buying and selling intensity within a time interval by moving around its zero line.
Dynamic Strength Index : The sole purpose of the dynamic strength index DSI and the integral dynamic strength index IDSI is to lead their intensity indicator peers.
Integral Force Index
Integral Pressure Index
Integral Strength Index
Integral Power Index
Integral Intensity Index
Integral Dynamic Strength Index
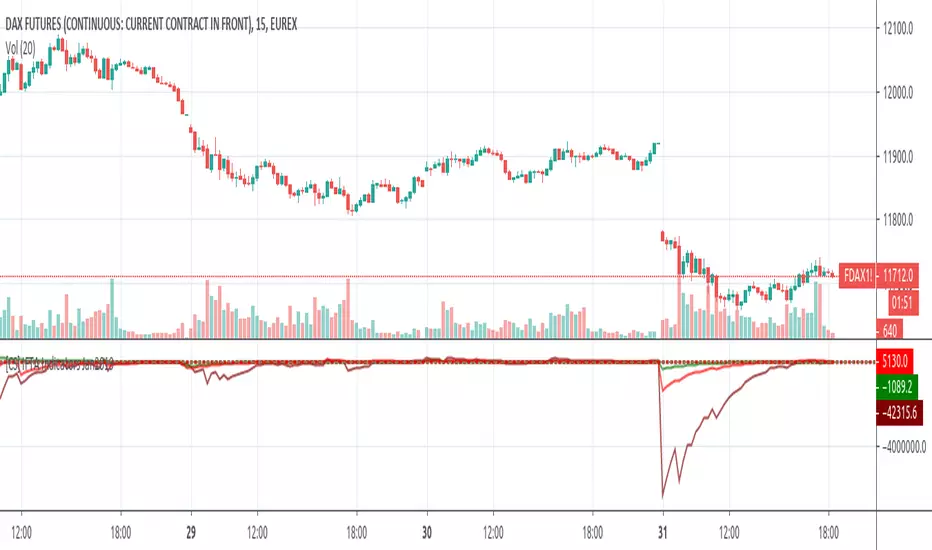
The following example shows a trade following the signal while several indicators are crossing the zero line:
Integral performance indicators have a fewer number of trades than the performance indicators. This result is normal, as the integral indicators are less sensitive than their peers. Moreover, the power, intensity, and dynamic strength are less sensitive than the force, pressure, and strength indicators. The same applies for their integrals. Therefore, the integrals of power, intensity, and dynamic strength indicators are more inclined to be medium-term indicators.
As the paper is suggesting "the linear momentum and the new performance indicators should make a significant change in categorizing several indicators in technical analysis."
Technical indicators are using biased mathematical implementations. For example Momentum Index is in reality a velocity indicator, Force index a Momentum indicator and so on. From a Physical perspective correct momentum, force, velocity etc. needs to be corrected and re-categorized.
The author also gives important insights in how these indicators can be used "simultaneously to identify price turning points and filter irrelevant divergences."
"This paper will attempt to adjust the price momentum and force concepts introduced by Welles Wilder and Alexander Elder, respectively. By introducing the concept of linear momentum, new indicators will emerge to dissect the market performance into six main elements: market’s force, pressure, strength, power, intensity, and dynamic strength. This will lead to a deeper insight about market action. The leading performance indicators can be used simultaneously to identify price turning points and filter irrelevant divergences. The linear momentum and the new performance indicators should make a significant change in categorizing several indicators in technical analysis."
Suggestions and feedback are welcome
Hope you enjoy this,
CryptoStatistical
multiple SMA EMA BB full mod + timeframeyou can add as much SMA EMA BB as you want by editting the source code
just remove the // from the indicator code

JMA Clone 3The clone of Jurik moving average function with a power argument
The power argument allows to closely approximate price movements. The higher the power, the closer the fit. Also helps to find a balance between smoothing and fitting.


4 EMA's in oneAnother useful script I've been experimenting with. 4 EMA's in one!
Red = 200
Orange = 100
Yellow = 50
Blue = 25
Color coded in order of their respective frequencies.
Right now it's as plain and simple as you can get. Only inputs you can change are the average values.
Will update upon request and popularity.
Happy new year and God bless!

Volume Conversion IndicatorVolume Conversion Indicator
The volume conversion indicator is much like the in-built volume indicator. This particular volume indicator allows you to find out how much of something has been traded in a given timeframe.
This is done by multiplying volume by the average price at that point.
What does this mean?
Well, say, for example, you were watching DGB/BTC (DigiByte/Bitcoin). Instead of the volume being displayed in the amount of DGB traded, the amount of BTC traded is displayed instead.
Feel free to comment... Hope this helps :D

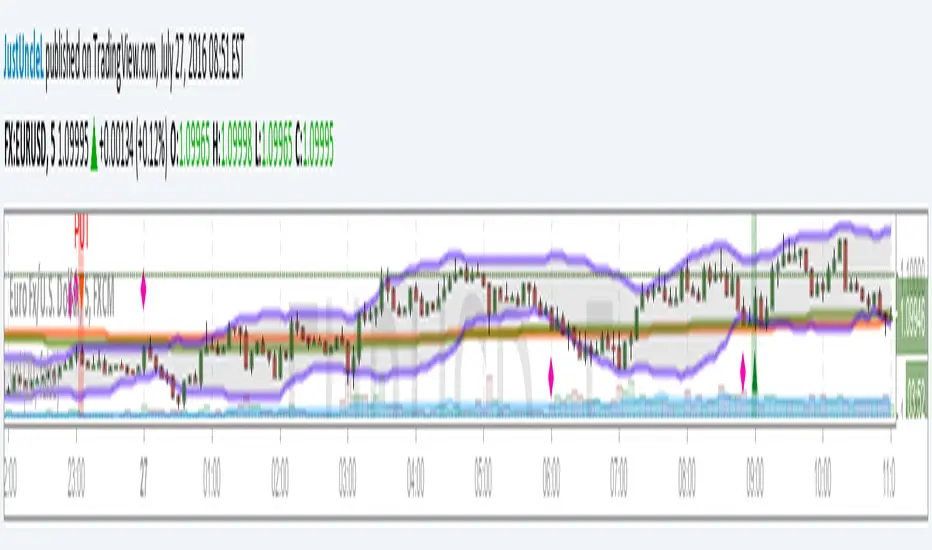
Pullback Trading Tool R5-65 by JustUncleLBy request this is an updated version of the "PullBack Trading Tool": removes experimental "OCC" channel, added option to display ribbons or just single moving average lines, added alert arrows for "PB" exits, added alertcondition for TV alarm subsystem, added some extract options for Pivot points and general cleanup of code.
Description:
This project incorporates the majority of the indicators needed to analyse and trade Trends for Pullbacks, swings and reversals.
Incorporated within this tool are the following indicators:
1. Major industry (Banks) recognised important EMAs in an EMA Ribbon:
Lime = EMA5 (Optional Display)
DodgerBlue = EMA12 (Optional Display)
Red = EMA36 (Optional display)
Green = EMA89
Blue = EMA200
Black = EMA633
2. The 5 EMA (default) High/Low/Close Price Action Channel (PAC), the PAC channel display is disabled by default.
3. Optionally display Fractals and optional Fractal levels
4. Optional HH, LH, LL, HL finder.
5. Optional Buy/Sell "PB" exit Alerts with Optional 200EMA filter.
6. Coloured coded Bar high lighting based on the PAC:
blue = bar closed above PAC
red = bar closed below PAC
gray = bar closed inside PAC
7. Alert condition sent to TradingView's Alarm subsystem for PB exits.
8. Pivot points with optional labels.
9. EMA5-12 Ribbon is displayed by default.
10.EMA12-36 Ribbon is displayed by default
Set up and hints:
I am unable to provide a full description here, as Pullback Trading incorporates a full trading Methodology, there are a number of articles and books written on the subject.
Set the chart to Heikin Ashi Candles (optional).
I also add a "Sweetspot Gold R3" indicator to the chart as well to help with support and resistance finding and shows where the important "00" lines are.
First on a weekly basis say Sunday night or Monday morning, analyse the Daily and Weekly charts to establish overall trends, and support/resistant levels. Draw significant mini trend lines (2/3 TL), vertical trend lines (VTL) and S/R levels. Can use the Pivots points to guide VTL drawing and Fractals to help guide 2/3 TL drawing.
Once the trend direction and any potential major reversals highlighted, drop down to lower timeframe chart and draw appropriate mini Trend line (2/3 TL) matching the established momentum direction. Take note of potential pull backs from and of the EMAs, in particular the EMA5-12 ribbon, EMA12-36 Ribbon and the 200EMA. Can use the Pivots and/or Fractals points to guide your 2/3 TL drawing.
Set a TradingView alarm on the "PBTOOL alert", with the default settings this normally occurs before or during the Break of the manually drawn TL lines.
Once alerted check to see if the TL is broken and is returning to trend away from the EMA lines, this is indicated by bar colour change to trend directional colour.
You can trade that alert or drop down to even lower time frames and perform the same TL analysis there to find trades at the lower TF. Trading at lower TF you will allow tighter Stop loss settings.
Other than the "SweetSpot Gold R3" indicator, you should not need any other indicator to successfully trade trends for Pullbacks and reversals. If you really want another indicator I suggest a momentum one for example: AO ( Awesome Oscillator ), MACD or Squeeze Momentum.

Currency Relative Strengths V.2 [GM]Version 2 Updates
Speed has been increased by ~7X
Highest and lowest pairs now highlighted using brighter colors
Re-ordered pairs from highest to lowest 'flight to risk' rating
I created this tool for the purpose of determining strongest and weakest currencies over different periods of time. Each major currency is compared to the field of other majors and its average change is measured over a predetermined period of time. The result is displayed as a percentage. I use it for trend following but it can also be used to fade exhaustion.
Instructions
Add indicator to chart
Select a time frame under settings
Place cursor over period of interest
Click "Data Window" on right hand side bar
View % change avg values for each currency

Currency Relative Strengths [GM] - Data IndicatorI created this tool for the purpose of determining strongest and weakest currencies over different periods of time. Each major currency is compared to the field of other majors and its average change is measured over a predetermined period of time. The result is displayed as a percentage. I use it for trend following but it can also be used to fade exhaustion.
Instructions
Add indicator to chart
Select a time frame under settings
Place cursor over period of interest
Click "Data Window" on right hand side bar
View % change avg values for each currency

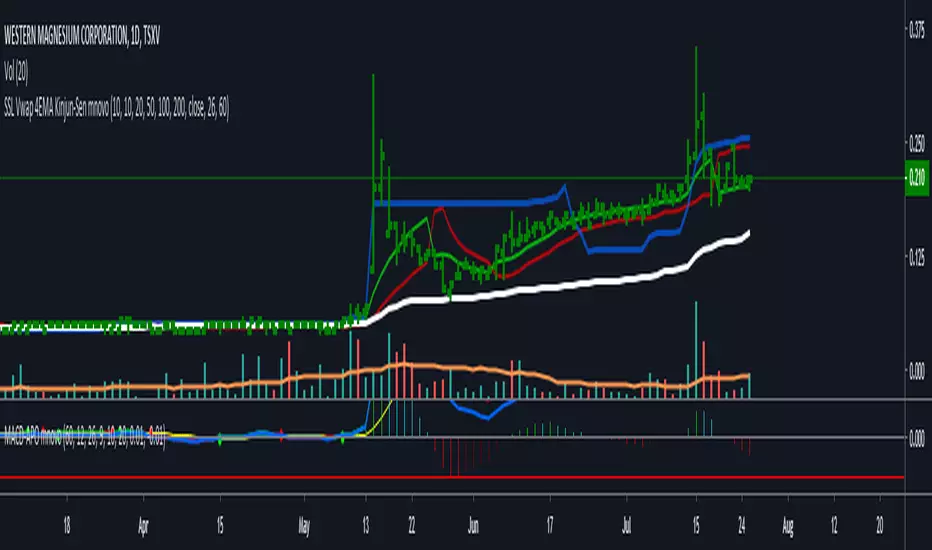
Scalping PullBack Tool R1 by JustUncleLDescription
This study project is a Scalping Pullback trading Tool that incorporates the majority of the indicators needed to analyse and scalp Trends for Pull Backs and reversals on 1min, 5min or 15min charts. The set up utilies Heikin Ashi candle charts. Incorporated within this tool are the following indicators:
1. Major industry (Banks) recognised important EMAs in an EMA Ribbon:
Green = EMA89
Blue = EMA200
Black = EMA633
2. The 36EMA (default) High/Low+Close Price Action Channel (PAC).
3. Fractals
4. HH, LH, LL, HL finder to help with drawing Trend lines and mini Trend Lines.
5. Coloured coded Bar high lighting based on the PAC:
blue = bar closed above PAC
red = bar closed below PAC
gray = bar closed inside PAC
red line = EMA36 of bar close
Setup and hints:
Set the chart to Heikin Ashi Candles.
Add "Sweetspot Gold10" indicator to the chart as well to help with support and resistance finding and shows where the important "00" and "0" lines are.
When price is above the PAC(blue bars) we are only looking to buy as price comes back to the PAC
When price is below the PAC(red bars), we are only looking to sell when price comes back to the PAC
What we’re looking for when price comes back into the PAC we draw mini Trendlines utilising the Fractals and HH/LL points to guide your TL drawing.
Now look for the trend to pull back and break the drawn TL. That's is when we place the scalp trade.
So we are looking for continuation signals in terms of a strong, momentum driven pullbacks (normally short term 10-20 pips) of the EMA36.
The other EMAs are there to check for other Pullbacks when EMA36 is broken.
Other than the SweetSpot Gold10 indicator, you should not need any other indicator to scalp the pullbacks.
References:
Fractals V8 by RicardoSantos
Price Action Trading System v0.3 by JustUncleL
SweetSpot Gold10 R1 by JustUncleL
www.swing-trade-stocks.com
www.forexstrategiesresources.com

Twiggs-ss
The modified indicator money flow Chaikin -LasyBear. Drastically accumulation and a sharp distribution of the painted color
Bollinger Band and Moving Average v0.1 by JustUncleLThis is another Bollinger Band strategy+indicator in my series of Bollinger based setups. This one is seems to work best with 5min charts and 20 to 30min expiry. The strategy follows variation of a Bollinger band + Moving Averages
reversal strategy, it uses the 2 moving averages mainly to determine market direction.
2% candlePart of my strategy involves entering a trade based on a candle on a 5-min chart being < 2% (ignoring major volatility).
I got tired of calculating the range of a single candle either in my head or on a calculator, so I wrote this up. Feel free to share it.
Shows the %move of any single candle, default horizontal lines are 1% & 2%, can be changed by clicking the gear icon next to the indicator after you have added the indicator to your chart. Works on any timeframe, 5m, 1h, 1d, etc , obviously
the higher the timeframe, the larger the move.

Ichimoku PanOptic TM-V1Modified Ichimoku indicator with signals from PanOptic Method by User Ichimoku_Trader.


Should I FOMO??Should I FOMO?? (number of revisited candles in a timeframe)
=============================================================
idea: hecate
I fomo way too much so i have created this little indicator to show me how many times (PERCENT) a candle is revisited in a period P
with the idea that i should not panic and maybe just wait patiently for a better price.
Just set the period P to your desired timeframe, days hours, whatever and WAIT patiently because many times it does come back :D and many times !!

MaxWarren's Pine Acceleration - 2nd DerivativeThis is the acceleration of a chart written in pine. It's the second derivative otherwise the derivative of the momentum.
It shows how fast a stock's momentum is changing and in what direction.
As standard I left the controls in the settings for source and length of the estimate.
I will be incorporating this in other more complicated scripts here shortly
