FFT Strategy Bi-Directional Stop/Profit/Trailing + VMA + AroonThis strategy uses the Fast Fourier Transform inspired from the source code of @tbiktag for the Fast Fourier Transform & @lazybear for the VMA filter.
If you are not familiar with the Fast Fourier transform it is a variation of the Discrete Fourier Transform. Veritasium on youtube has a great video on it with a follow up recommendation from 3brown1blue. In short it will extract all the frequencies from a set of data. @tbiktag laid the groundwork for creating the indicator which will allow you to isolate only those signals which are the most relevant and remove the noise. I recommend having @tbiktag's FFT Transform indicator side by side with this to understand what my variation is doing by setting similar settings .
Using this idea, you can then optimize a strategy to the frequencies that are best. The main entry signal is when the FFT Signal crosses above or below the 0 line .
Included with this strategy is the ability to optionally bi-directionally set:
Stop Loss
Trailing Stop Loss
Take Profit
Trailing Take Profit
Entries are optionally further filtered by use of the VMA using the algorithm from LazyBear which allows you to adjust a variable moving average with 3 market trend detections. Green represents upwards momentum; Blue sideways trading and Red downwards momentum. The idea being to filter out buy or sell entries unless the market is moving in that direction, and this makes a big difference as you can see for yourself when you turn it off or on. Turning it off will change the color of the FFT signal to orange instead of the green, blue, red colors .
I have added 2 custom stop loss types as well for experimentation:
1. VMA Filter stop loss to exit the trade if the VMA detects a market trend direction change matching the rules you have set. I have set this to off by default, but it is there so you can see what affect it may have on other tickers. It can increase the profit factor but usually at a cost of net profit.
2. The Aroon Filter stop loss with different lengths for the short or long direction. For the Aroon strategy (which is a trend change detector) it is considered bullish if the upper line (green in my code) is above 70 and the lower line (red in my code) is below 30 and the opposite for the bearish case. With this in mind, I have set it to filter by default only the extreme ends (99 and 1) to increase profit factor and net profit but I encourage you to try different settings and see how it affects things. Turning this off yields much higher net profit but at the cost of the profit factor and drawdown . To disable this just uncheck the 'Use Aroon Filter Long' (or short) and it will also hide the aroon graphics and crosses on the plot.
I will be adding more features in an attempt to lower the drawdown on this strategy but I hope you enjoy what I have so far!
M-oscillator

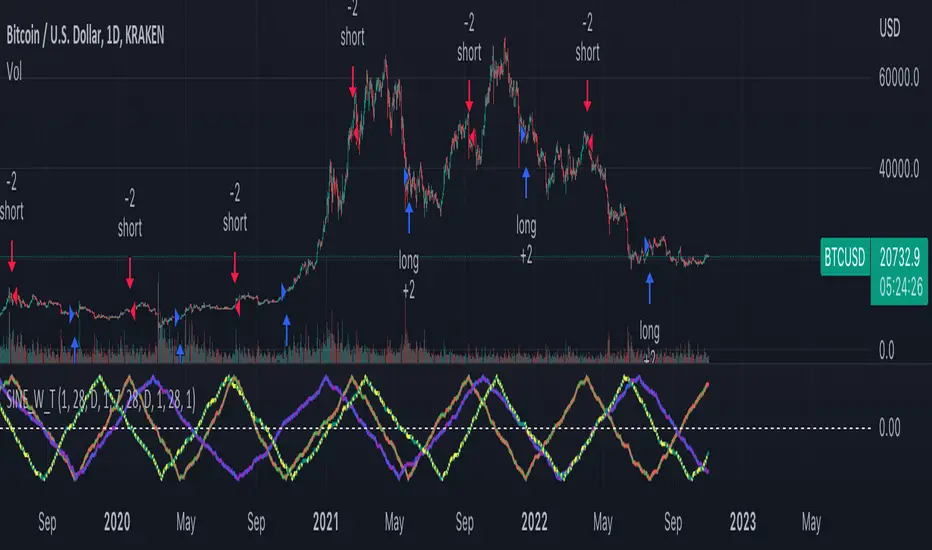
Sine Wave TheoryThere are some ideas out there that the market is like a collection of quantum events and that it could all be broken down into sine waves. I created this script to put that to the test.
The idea is simple, I tested 3 different factors that could be put into sine wave form.
1.) Bar Change
2.) Volume Average Change
3.) Coin Flip
For the bar change, I simply allow the sine wave to move upwards or downwards if the bars have changed color in their sequence. For example, if there were 3 red bars and 1 green bar, it would not move the sine wave up or down until the green bar appeared.
For the average volume change, it was the same idea, except that the sine wave could only move up or down if the volume had moved up or below the average value of the length given for calculating the average volume.
Finally, the coin flip simply simulates flipping a coin, and allows the sine wave to move one direction or the other once it has a side that is different from the previous chosen side. For example, heads, heads, heads, tails (once it flipped to tails, this would allow it to move a direction).
The sine wave trading theory that I watched claimed that if you know the correct sine wave # (which is how large the peak is, and/or the sine wave count which is how many peaks and valleys occur) that you can successfully predict future trades. Their claims that the reason it does not look like a perfect sine wave for these events is because there is different amounts of trading going on, thus the timing will be slightly off.
I am posting this to disagree with their ideas. For example, if you select to turn on trading for coin flip and turn off bar change, you will see the coin flip did better on the default settings!
It just so happens that any setting will eventually be good, making all the sine wave variations just completely random if you win or not.
I posted this to demonstrate how silly trading sine waves is. The real trick is using cosine and tangent waves... lol j/k
I hope this helps someone avoid this scam concept.
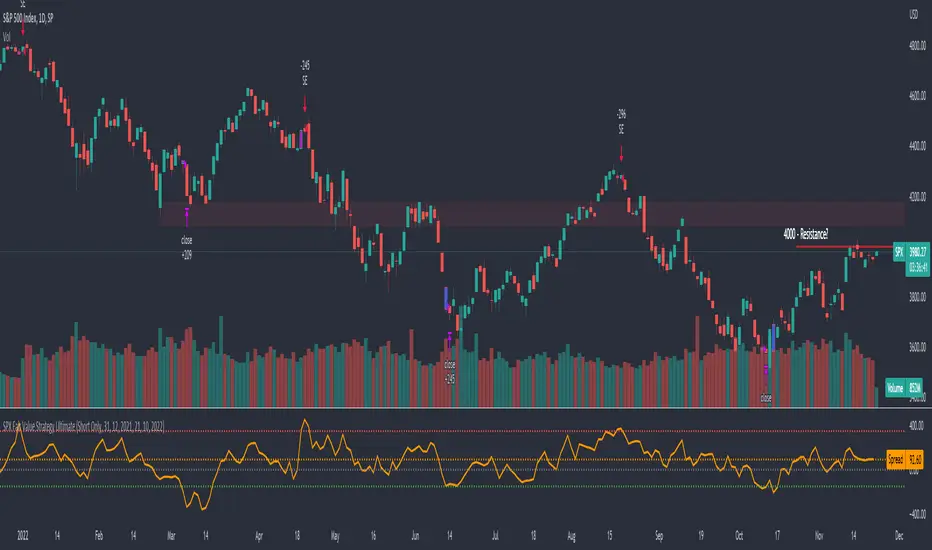
SPX Fair Value Strategy UltimateThis is a strategy using the SPX Fair Value derived from Net Liquidity.
Net Liquidity function is simply: Fed Balance Sheet - Treasury General Account - Reverse Repo Balance
Formula for calculating the fair value of SPX using Net Liquidity looks like this: net_liquidity/1000000000/1.1 -1625
The SPX Fair Value is then subtracted from the SPX value which creates an oscillating diff value.
When diff is greater than 350, SPX is considered overbought and we go short/sell.
When diff is less than -150, SPX is considered oversold and we cover/buy.
The net liquidity values I calculate outside of TradingView. If you'd like the strategy to work for future dates, you'll need to update them.
Paremeters:
Strategy: Short Only, Long Only, Long/Short
Inverse (bool): check if using an inverse ETF to go long instead of short.
Start After Date: When the strategy should start trading
Close Date: Day to close open trades. I just like it to get complete results rather than the strategy ending with open trades.
Trailing Stop SnippetThis is an example snippet that should allow for adding a trailing stop and trailing stop activation to almost any script.
You can use it by setting a trailing stop alone. This will provide you standard trailing stop functionality allowing you to lock in profits and increase your stop-loss as the price moves in your direction.
You can also set the trailing stop activation to trigger the original trailing stop at a certain level. "Once price rises 5%, set a trailing stop at break even". This would be set as 5 and 5 in the settings.

Average Directional Index v2This script uses another method of obtaining the price with each tick. The combination of gap settings and price data provide a good ADXx plot that does not repaint by default.

Balance of Power Heikin Ashi Investing Strategy Balance of Power Heikin Ashi Investing Strategy
This is a swing strategy designed for investment help.
Its made around the Balace of Power indicator, but has been adapted on using the Monthly Heikin Ashi candle from the SPY asset in order to be used with correlation for US Stock/ETF/Index Markets.
The BOP acts as an oscilallator showing the power of a bull trend when its positive and a bearish trend when its in negative. At the same time we can spot reversals, based on the percentiles ( 99/1)
The rules for entry :
For long : The 99 percentile is ascending, and we are either in a positive value (>0), or we crossed the bottom place ( -0.35)
For short : the 99 and 1 percentile are descending, and we are either in a negative value(<0), or we crossed down the top place ( 0.6)
If you have any questions please let me know !

BTC Profitable Wallets StrategyBTC Profitable Wallets Strategy - plots the percentage of profitable BTC wallets and places long orders when the profitable wallet share crosses above 50%, historically a very accurate point to catch the next Bull Run early.
The only setting is a smoothing option using the Moving Average method and length of your choice.
On Chain Data is queried from IntoTheBlock.
This is a 'HODL' strategy, with no exit given. If you'd like to see the historical performance check the Open Profit or place a sell order at the current date.

BT-SAR Ema, Squeeze, Volatility
Esse script foi criado para estudo de Backtest.
Ele usa o SAR PARABÓLICO como indicador de sinal de entrada, você também pode combinar 3 indicadores para filtrar as entradas: Média Móvel, Squeeze Momentum e Volatility Oscilator .
Existe duas entradas, quando o SAR Parabólico vira ou pelo Breakout (usando o último preço) do SAR Parabólico antes dele virar.
As Os filtros podem ser usados de forma combinada ou individual.
O Script também pode ser usado com algum serviço de bot como 3commas.io, basta colocar as mensagens de entrada e saída para o bot.
This script was created for Backtest study.
It uses PARABOLIC SAR as input signal indicator, you can also combine 3 indicators to filter inputs: Moving Average, Squeeze Momentum and Volatility Oscillator .
There are two entries, when the Parabolic SAR turns or by Breakout (using the last price) of the Parabolic SAR before it turns.
The Filters can be used in combination or individually.
The Script can also be used with some bot service like 3commas.io, just put the input and output messages to the bot.

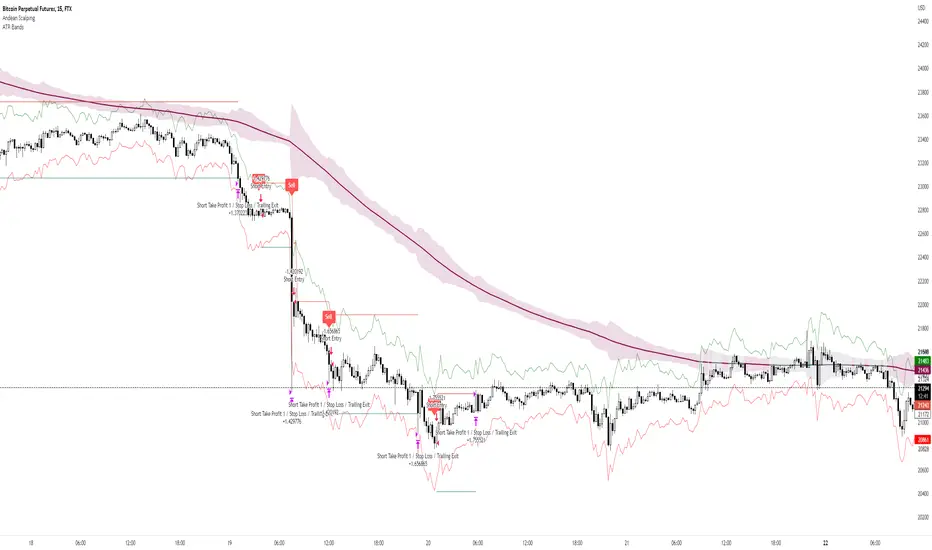
Andean ScalpingAndean Scalping Implementation - BETA
- Uses Andean Oscillator: alpaca.markets
- Implements a threshold moving average (SMA 1000) on the Andean Signal line at 1.1 factor to filter out small moves
- TP/SL using ATR bands at 3x multiplier
Smoothed Heikin Ashi Trend on Chart - TraderHalai BACKTESTSmoothed Heikin Ashi Trend on chart - Backtest
This is a backtest of the Smoothed Heikin Ashi Trend indicator, which computes the reverse candle close price required to flip a Heikin Ashi trend from red to green and vice versa. The original indicator can be found in the scripts section of my profile.
This particular back test uses this indicator with a Trend following paradigm with a percentage-based stop loss.
Note, that backtesting performance is not always indicative of future performance, but it does provide some basis for further development and walk-forward / live testing.
Testing was performed on Bitcoin , as this is a primary target market for me to use this kind of strategy.
Sample Backtesting results as of 10th June 2022:
Backtesting parameters:
Position size: 10% of equity
Long stop: 1% below entry
Short stop: 1% above entry
Repainting: Off
Smoothing: SMA
Period: 10
8 Hour:
Number of Trades: 1046
Gross Return: 249.27 %
CAGR Return: 14.04 %
Max Drawdown: 7.9 %
Win percentage: 28.01 %
Profit Factor (Expectancy): 2.019
Average Loss: 0.33 %
Average Win: 1.69 %
Average Time for Loss: 1 day
Average Time for Win: 5.33 days
1 Day:
Number of Trades: 429
Gross Return: 458.4 %
CAGR Return: 15.76 %
Max Drawdown: 6.37 %
Profit Factor (Expectancy): 2.804
Average Loss: 0.8 %
Average Win: 7.2 %
Average Time for Loss: 3 days
Average Time for Win: 16 days
5 Day:
Number of Trades: 69
Gross Return: 1614.9 %
CAGR Return: 26.7 %
Max Drawdown: 5.7 %
Profit Factor (Expectancy): 10.451
Average Loss: 3.64 %
Average Win: 81.17 %
Average Time for Loss: 15 days
Average Time for Win: 85 days
Analysis:
The strategy is typical amongst trend following strategies with a less regular win rate, but where profits are more significant than losses. Most of the losses are in sideways, low volatility markets. This strategy performs better on higher timeframes, where it shows a positive expectancy of the strategy.
The average win was positively impacted by Bitcoin’s earlier smaller market cap, as the percentage wins earlier were higher.
Overall the strategy shows potential for further development and may be suitable for walk-forward testing and out of sample analysis to be considered for a demo trading account.
Note in an actual trading setup, you may wish to use this with volatility filters, combined with support resistance zones for a better setup.
As always, this post/indicator/strategy is not financial advice, and please do your due diligence before trading this live.
Original indicator links:
On chart version -
Oscillator version -
Update - 27/06/2022
Unfortunately, It appears that the original script had been taken down due to auto-moderation because of concerns with no slippage / commission. I have since adjusted the backtest, and re-uploaded to include the following to address these concerns, and show that I am genuinely trying to give back to the community and not mislead anyone:
1) Include commission of 0.1% - to match Binance's maker fees prior to moving to a fee-less model.
2) Include slippage of 10 ticks (This is a realistic slippage figure from searching online for most crypto exchanges)
3) Adjust account balance to 10,000 - since most of us are not millionaires.
The rest of the backtesting parameters are comparable to previous results:
Backtesting parameters:
Initial capital: 10000 dollars
Position size: 10% of equity
Long stop: 2% below entry
Short stop: 2% above entry
Repainting: Off
Smoothing: SMA
Period: 10
Slippage: 10 ticks
Commission: 0.1%
This script still remains to shows viability / profitablity on higher term timeframes (with slightly higher drawdown), and I have included the backtest report below to document my findings:
8 Hour:
Number of Trades: 1082
Gross Return: 233.02%
CAGR Return: 14.04 %
Max Drawdown: 7.9 %
Win percentage: 25.6%
Profit Factor (Expectancy): 1.627
Average Loss: 0.46 %
Average Win: 2.18 %
Average Time for Loss: 1.33 day
Average Time for Win: 7.33 days
Once again, please do your own research and due dillegence before trading this live. This post is for education and information purposes only, and should not be taken as financial advice.

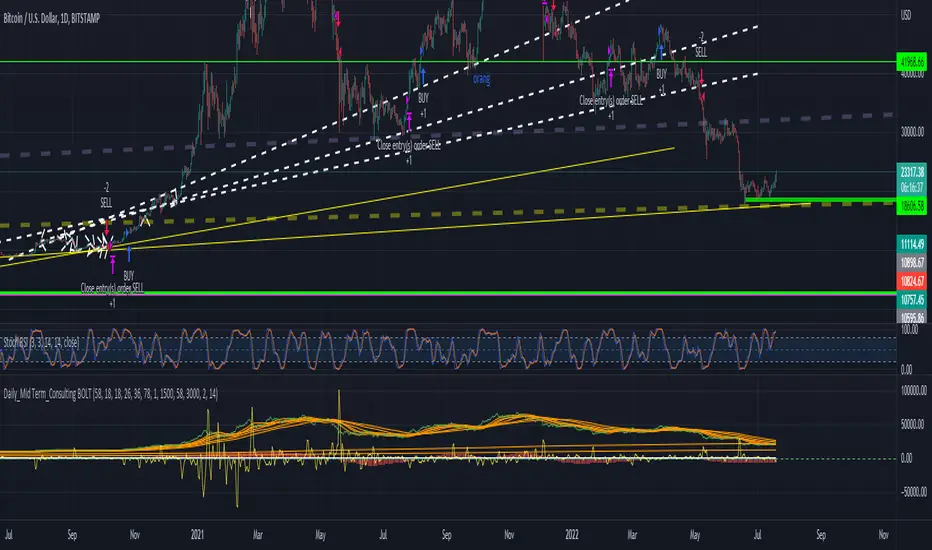
Daily_Mid Term_Consulting BOLTDaily Mid Term Consulting BOLT es una estrategia a mediano y largo plazo creada para detectar los cambios tendenciales en zonas de tiempo diarias. se basa en el análisis de los cambios porcentuales que sufre el precio contra las distintas medias móviles simples definidas en la estrategia. el uso de osciladores como el MACD , RSI y EFI apoyan la decisión de entrada a la estrategia.
actualmente esta en construcción la colocación de stop losses para aumentar la eectividad de la misma.
TASC 2022.08 Trading The Fear Index█ OVERVIEW
TASC's August 2022 edition of Traders' Tips includes an article by Markos Katsanos titled "Trading The Fear Index". This script implements a trading strategy called the “daily long/short trading system for volatility ETFs” presented in this article.
█ CONCEPTS
This long-term strategy aims to capitalize on stock market volatility by using exchange-traded funds (ETFs or ETNs) linked to the VIX index.
The strategy rules (see below) are based on a combination of the movement of the Cboe VIX index, the readings of the stochastic oscillator applied to the SPY ETF relative to the VIX, and a custom indicator presented in the article and called the correlation trend . Thus, they are not based on the price movement of the traded ETF itself, but rather on the movement of the VIX and of the S&P 500 index. This allows the strategy to capture most of the spikes in volatility while profiting from the long-term time decay of the traded ETFs.
█ STRATEGY RULES
Long rules
Rising volatility: The VIX should rise by more than 50% in the last 6 days.
Trend: The correlation trend of the VIX should be 0.8 or higher and also higher than yesterday's value.
VIX-SPY relative position: The 25-day and 10-day VIX stochastics should be above the 25-day and 10-day SPY stochastics respectively. In addition, the 10-day stochastic of the VIX should be above its yesterday's value.
Long positions are closed if the 10-day stochastic of the SPY rises above the 10-day stochastic of the VIX or falls below the yesterday's value.
Short rules
Declining volatility: The VIX should drop over 20% in the last 6 days and should be down during the last 3 days.
VIX threshold: The VIX should spend less than 35% of time below 15.
VIX-SPY relative position: The 10-day VIX stochastic should be below the 10-day SPY stochastic. In addition, the 10-day SPY stochastic should be higher than the yesterday's value.
Long positions are closed if the first two Long rules are triggered (Rising volatility and Trend).
The script allows you to display the readings of the indicators used in the strategy rules in the form of oscillator time series (as in the preview chart) and/or in the form of a table.

Combo 2/20 EMA & Bull PowerThis is combo strategies for get a cumulative signal.
First strategy
This indicator plots 2/20 exponential moving average. For the Mov
Avg X 2/20 Indicator, the EMA bar will be painted when the Alert criteria is met.
Second strategy
Bull Power Indicator
To get more information please see "Bull And Bear Balance Indicator"
by Vadim Gimelfarb.
WARNING:
- For purpose educate only
- This script to change bars colors.

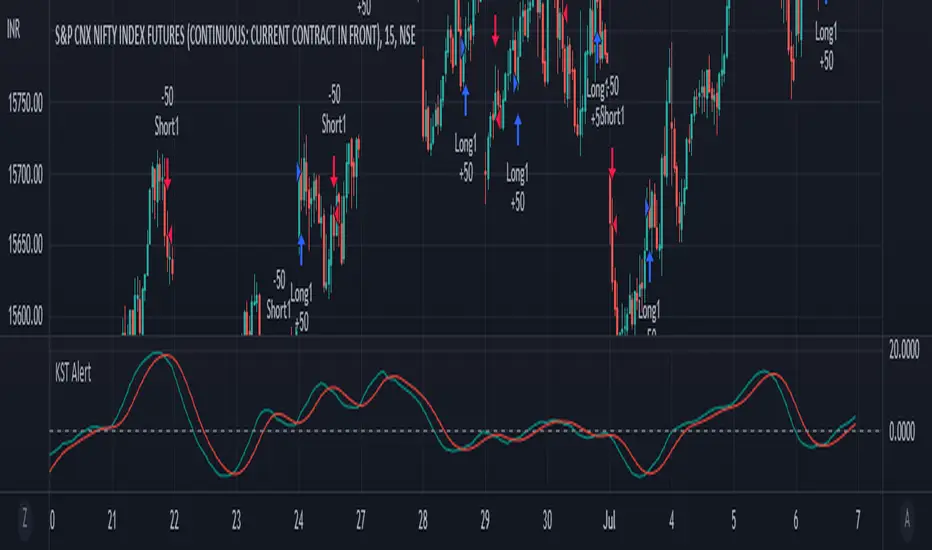
KST AlertJust added Alert condition to the default indicator
Default timeframe is set to 15m
Buy signal initiates when kst line crosses over signal line
Sell Signal initiates when kst line crosses under signal line
Rainbow Oscillator [Strategy]Strategy based on Rainbow Oscillator
.:: Features ::.
Takes and Stops in percent
Configurable indicator iside
.:: Long condition ::.
Indicator line is green (mean uptrend) and crossing averages generated from oscillograph signal fast is go up and crossing slow
.:: Short condition ::.
Indicator line is red (mean downtrend) and crossing averages generated from oscillograph signal fast is go down and crossing slow

Gap Reversion StrategyToday I am releasing to the community an original short-term, high-probability gap trading strategy, backed by a 20 year backtest. This strategy capitalizes on the mean reverting behavior of equity ETFs, which is largely driven by fear in the market. The strategy buys into that fear at a level that has historically mean reverted within ~5 days. Larry Connors has published useful research and variations of strategies based on this behavior that I would recommend any quantitative trader read.
What it does:
This strategy, for 1 day charts on equity ETFs, looks for an overnight gap down when the RSI is also in/near an oversold position. Then, it places a limit order further below the opening of the gapped-down day. It then exits the position based on a higher RSI level. The limit buy order is cancelled if the price doesn't reach your limit price that day. So, the larger you make the gap and limit %, the less signals you will have.
Features:
Inputs to allow the adjustment of the limit order %, the gap %, and the RSI entry/exit levels.
An option to have the limit order be based on a % of ATR instead of a % of asset price.
An optional filter that can turn-off trades when the VIX is unusually high.
A built in stop.
Built in alerts.
Disclaimer: This is not financial advice. Open-source scripts I publish in the community are largely meant to spark ideas that can be used as building blocks for part of a more robust trade management strategy. If you would like to implement a version of any script, I would recommend making significant additions/modifications to the strategy & risk management functions. If you don’t know how to program in Pine, then hire a Pine-coder. We can help!

Boom Hunter + Hull Suite + Volatility Oscillator StrategyTRADE CONDITIONS
Long entry:
Boom Hunter (leading indicator): Trigger line crosses over Quotient 2 line (white cross over red)
Hull Suite (trend confirmation): Price closed above hull suite line and hull suite is green (represented by horizontal line at -10 in strategy pane)
Volatility Oscillator (volatility confirmation): Volatility spike trigger line is above upper band (represented by horizontal line at -30 in strategy pane)
Short entry:
Boom Hunter (leading indicator): Trigger line crosses under Quotient 2 line (white cross under red)
Hull Suite (trend confirmation): Price closed below hull suite line and hull suite is red (represented by horizontal line at -10 in strategy pane)
Volatility Oscillator (volatility confirmation): Volatility spike trigger line is below lower band (represented by horizontal line at -30 in strategy pane)
Risk management:
Each trade risks 3% of account (configurable in settings)
SL size determined by swing low/high of previous X candles (configurable in settings) or 1 ATR if swing is less than 1 ATR
TP is calculated by Risk:Reward ratio (configurable in settings)
TIPS
Timeframe: I have found good results running on BTC/USDT 5M chart
Note: To help visual identification of trade entries and exits you may wish to add the Hull Suite and Volatility Oscillator to the chart separately. It was not possible to display them in a clear way within a single panel for the strategy. Make sure you set the settings of the auxiliary indicators to match what is in the settings of this indicator if you do decide to add them.
CREDITS
Boom Hunter Pro by veryfid
Hull Suite by InSilico
Volatility Oscillator by veryfid

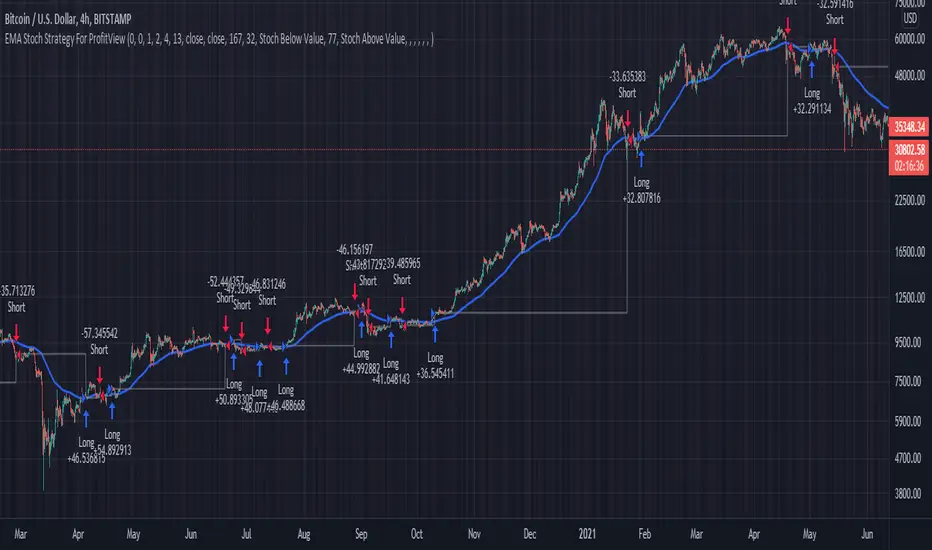
EMA Stoch Strategy For ProfitViewThis strategy will enter positions when the set stochastic conditions are met, and uses the moving average to filter the direction of the trades (long/short). The background is used to illustrate the strength of the stochastic values.
The following is a step by step guide in order to automate the trading of the strategy with ProfitView:
In the indicator settings, set the desired stochastic and ema values, and the stochastic condition you want to use to enter a trade.
In the indicator, set which exchange, symbol, and account to execute trades on.
In the indicator, set the PV Alert names you intend to use. If you want to use the same names as provided in the pastebin below, you may set the three names to Market Long, Market Short, TP SL Hit.
In PV, create two new PV Alerts in the PV Alert tab in accordance to these specifics pastebin.com .
On the Tradingview chart you want the indicator run on, create a new TV alert with this script as its condition, and specify the alert to "alert() function calls only".
QQE MOD + SSL Hybrid + Waddah Attar ExplosionTRADE CONDITIONS
Long entry:
QQE Mod changes to Blue (leading indicator)
SSL Hybrid is Blue and price is above MA Channel line
Waddah Attar Explosion is Green and above Explosion line
Short entry:
QQE Mod changes to Red (leading indicator)
SSL Hybrid is Red and price is below MA Channel line
Waddah Attar Explosion is Red and above Explosion line
Risk management:
Each trade risks 2% of account (configurable in settings)
SL size determined by swing low/high of previous X candles (configurable in settings)
TP is triggered on SSL Hybrid EXIT arrow signals
TIPS
Timeframe: Personally I've found best results running this on 1H timeframe.
Note: To help visual identification of trade entries and exits you may wish to add the SSL Hybrid and Waddah Attar Explosion to the chart separately. They are being used to determine trade entry/exit within the code of this strategy but it was not possible to display them in a clear way within a single panel. Make sure you set the settings of the auxiliary indicators to match what is in the settings of this indicator if you do decide to add them.
CREDITS
QQE MOD byMihkel00
SSL Hybrid by Mihkel00
Waddah Attar Explosion by shayankm

Best TradingView Strategy - For NASDAQ and DOW30 and other IndexThe script is totally based on momentum , volume and price. We have used :
1: Bollinger Band Squeezes to know when a breakout might happen.
2: Used Moving Averages(SMA and EMA) to know the direction.
3: The success Rate of this strategy is above 75% and if little price action is added it can easily surpass 90% success mark.
4: Do not worry about drawdowns , we have implemented trailing SL ,so you might see a little extra drawdown but in reality its pretty less.
5: I myself have tested this strategy for 41 days with a 250$ account and right now I have 2700$.

Take profit Multi timeframeRepublish:
Take profit Multi timeframe:
In this scipts, I build risk-reward system managemant. You can take profit in two way: percent or at resistant in higher timeframe or both.
Strategy in this scripts, I use Wave trend indicator as example strategy.

MACD Willy StrategyThis strategy is mainly developed for scalping / intraday trading. It could potentially be used to identify entry/exit signals for short term options trading. It performs decently well on popular stocks when used on time frames between 5 min to 15 min using regular session bar data. It combines 3 popular indicators, EMA, MACD, and William %range, to generate both long and short signals.
EMA:
Default is 200 EMA line.
MACD:
Default is 12/26 lengths for fast/slow signal inputs.
William %R - Smoothed (Published):
This is a custom indicator that generates two moving average lines from the original William %R line.
How it works:
Entry conditions:
1. Long/short entries when bar closes above/below EMA line
2. Long/short entries when MACD line is above/below signal line (histogram > 0 for long, < 0 for short)
3. Long/short entries when William %R fast MA line is above/below slow MA line
Exit conditions:
1. Exit long when MACD line is below signal line, vise versa for exit short
2. Exit long when William %R fast MA line is below slow MA line, vise versa for exit short
3. Exit long when William %R fast MA line must in below the overbought (-20) limit, exit short when above the oversold (-80) limit.
***Note that parameters are NOT optimized for any particular stocks / instruments.
Enjoy~~!!

Oversold RSI with Tight Stop-Loss Strategy (by Coinrule)KRAKEN:LINKUSD
This is one of the best strategies that can be used to get familiar with technical indicators and start to include them in your rules on Coinrule .
ENTRY
1. This trading system uses the RSI (Relative Strength Index) to anticipate good points to enter positions. RSI is a technical indicator frequently used in trading. It works by measuring the speed and change of price movements to determine whether a coin is oversold (indicating a good entry point) or overbought (indicating a point of exit/entry for a short position). The RSI oscillates between 0 and 100 and is traditionally considered overbought when over 70 and oversold when below 30.
2. To pick the right moment to buy, the strategy enters a trade when the RSI falls below 30 indicating the coin is oversold and primed for a trend reversal.
EXIT
The strategy then exits the position when the price appreciates 7% from the point of entry. The position also maintains a tight stop-loss and closes the position if the price depreciates 1% from the entry price. The idea behind this is to cut your losing trades fast and let your winners ride.
The best time frame for this strategy based on our back testing data is the daily. Shorter time frames can also work well on certain coins, however in our experience, the daily works best. Feel free to experiment with this script and test it on a variety of your coins! With our back testing data a trading fee of 0.1% is taken into account. The fee is aligned to the base fee applied on Binance, which is the largest cryptocurrency exchange by volume. In the example shown, this strategy made a handsome net profit of 52.6% on Chainlink with 66.67% of trades being profitable.
You can execute this strategy on your favorite exchanges with Coinrule .
