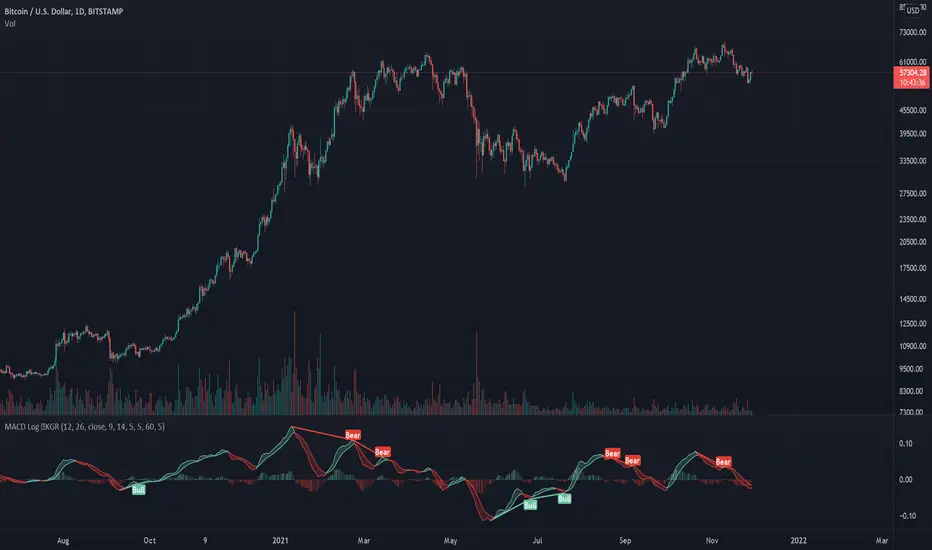
Logarithmic MACD ©KGRThis is a logarithmic MACD that comes with several advantages over the standard MACD.
Benefits: L MACD ©KGR vs Standard MACD
Normalized over longer time periods: LMACD: Yes - standard: No
Visual cues for tops: LMACD: Yes - standard: No
Visual cues for bottoms: LMACD: Yes - standard: No
Visual cues for crossing bull/bear LMACD: Yes - standard: No
Automatic divergence indicators LMACD: Yes - standard: No
Aligns with the total KGR suite highlighting confluence: LMACD: Yes - standard: No
KG Research focuses on developing crypto and general macro indicators.
Please like, follow and share to show your appreciation and support.
the KG Research team.
Macddivergence
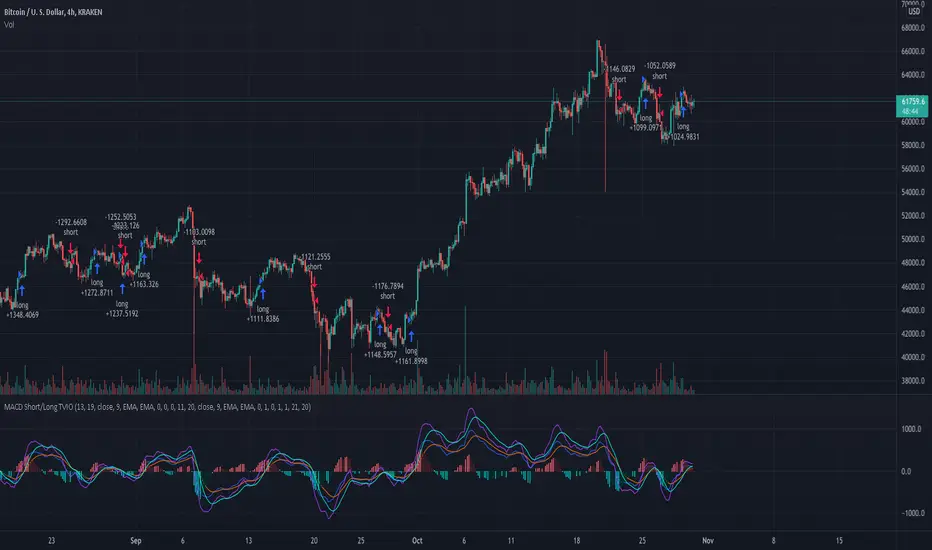
MacD Short and/or Long with Bi-Directional TP and SL This tool allows you to test any variable value for MacD and Signal for going Long or Short with each market direction having customizable values for stop loss and take profit.
For example, sometimes the MacD and Signal values are better with different lengths between Short and Long. You can use this tool to see them overlaid and determine the best settings for going one direction or the other.
This script was preset for use with XBTUSD on the 4 hour time frame. Another example with this in mind, is take profits and stop losses might not work in the Long market direction but going Short does! Without this tool that would be hard to see since typically stop loss and take profit is applied to both directions. I found with this tool that a 20% take profit seems to be a good sweet spot for going short with this strategy.
You can customize which MacD histogram you see by going to the style section and turning off the Short or Long parameters so you can see only 1 histogram at a time if you wish.
If you have any questions, please PM me.
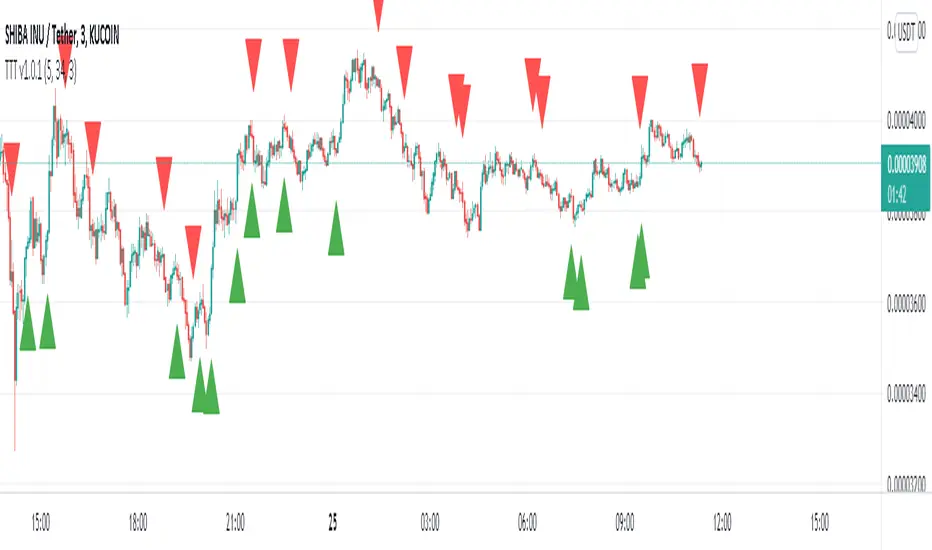
Trend Tracking Trader v1.0.1 [by Hajixde]How it works:
This indicator works based on finding the trend lines of time-shifted MACD signals.
Time frame:
The performance of the indicator highly depends on the time frame you choose and the input parameters. Please the following details carefully.
Parameters:
The default values for "Fast Length", "Slow Length", and "Signal smoothing" have been tested for several coins and tokens but you are more than welcome to choose your own numbers.
Fast Length & Slow Length:
The higher values of these lengths, the slower but more accurate trade entry and exit points.
Signal Smoothing:
By increasing this parameter, you are getting rid of cyclical noise but may also miss some low pivots. Don't choose a very high value.
Alerting:
When you add this indicator to your chart, you can enable the alerts by choosing the indicator in the alerts section and then "Buy" and "Sell" options can be selected and you'll be notified of the signals.
Tips:
Based on what I've experimented, it works great on SHIBA for a 3-min TF and the default values. ETH has shown a fantastic result on a 6-Hr TF.
- This is an original, public, and protected script which belongs to user Hajixde
Macd Divergence + MTF EMA MACD Divergence + Multi Time Frame EMA
This Strategy uses 3 indicators: the Macd and two emas in different time frames
The configuration of the strategy is:
Macd standar configuration (12, 26, 9) in 1H resolution
10 periods ema, in 1H resolution
5 periods ema, in 15 minutes resolution
We use the two emas to filter for long and short positions.
If 15 minutes ema is above 1H ema, we look for long positions
If 15 minutes ema is below 1H ema, we look for short positions
We can use an aditional filter using a 100 days ema, so when the 15' and 1H emas are above the daily ema we take long positions
Using this filter improves the strategy
We wait for Macd indicator to form a divergence between histogram and price
If we have a bullish divergence, and 15 minutes ema is above 1H ema, we wait for macd line to cross above signal line and we open a long position
If we have a bearish divergence, and 15 minutes ema is below 1H ema, we wait for macd line to cross below signal line and we open a short position
We close both position after a cross in the oposite direction of macd line and signal line
Also we can configure a Take profit parameter and a trailing stop loss

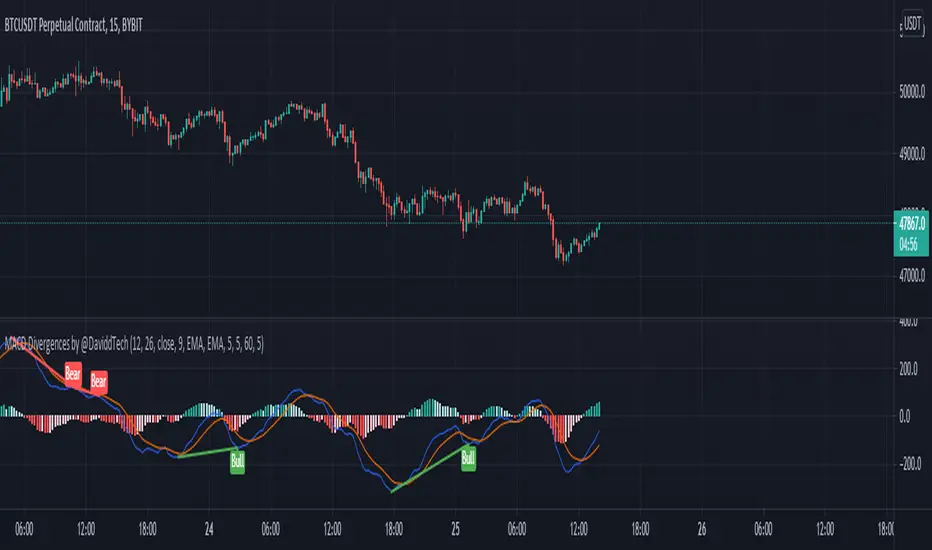
MACD Divergences by @DaviddTechThis indicator helps find divergences in the MACD.
This uses the modification of the TV built-in "Divergence indicator" (Version 10) that I have applied to the MACD.
Usage:
Add the indicator to your chart and then watch for it to plot divergences.
Triple Exponential MACDA modification of the classic MACD to use Triple EMAs which tends to have less lag than the standard indicator. (I also have a Double Exp MACD indicator, I tend to use both simultaneously)
Alert conditions are pre-configured for simple line crosses and you can enable/disable the histogram from the indicator options menu.
Enjoy!

Double Exponential MACDA modification of the classic MACD to use Double EMAs which tends to have less lag than the standard indicator.
Alert conditions are pre-configured for simple line crosses and you can enable/disable the histogram from the indicator options menu.
Enjoy!

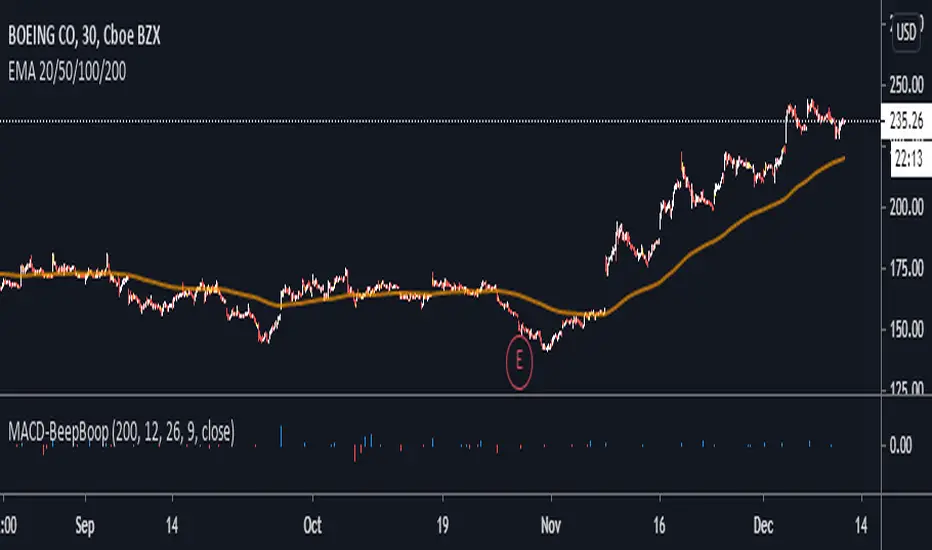
MACD BeepBoop Indicator
The indicator flags long or blue when the macd histogram value > 0 and above the ema and short or red when the macd histogram value < 0 and below the ema
I have added confirmations in the form of eliminating all bars on the histogram unless they meet the long / short entry conditions two bars in a row
You can customize the length of the ema that determines the long/short entry conditions in the settings
I have also added a yellow highlight to the bar in the chart that you would enter on. You would enter at the open of the bar following the signal bar
Stop Loss would be placed at the nearest pivot point or ATR of your choice
Note - republishing this after taking out original links
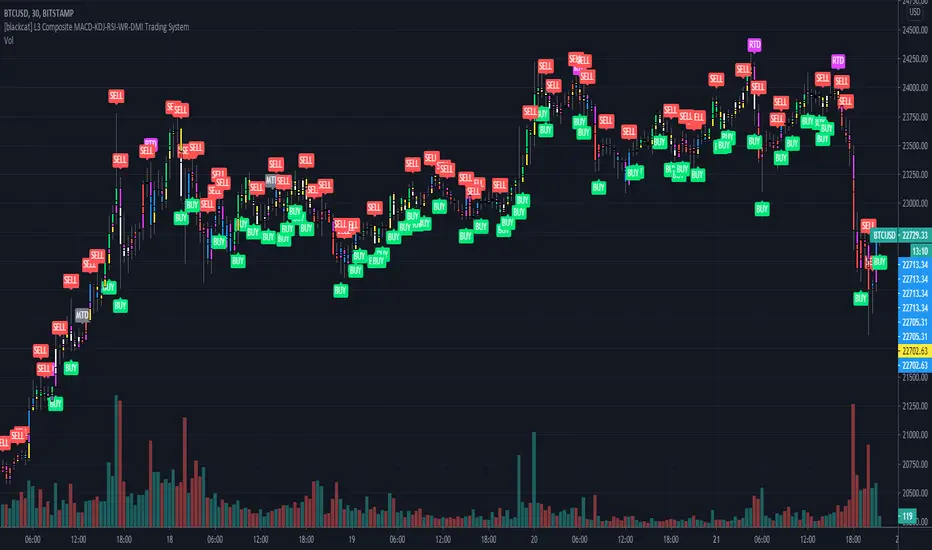
[blackcat] L3 Composite MACD-KDJ-RSI-WR-DMI Trading SystemLevel: 3
Background
The moving average convergence / divergence (MACD) indicator is a pulse oscillator that is mainly used to trade trends. Although it is an oscillator, it is not typically used to identify overbought or oversold conditions. It appears in the diagram as two lines that oscillate without limits. The crossing of the two lines provides trading signals similar to a system with two moving averages.
The KDJ indicator is a technical indicator used to analyze and predict changes in stock performance and the price patterns of a traded asset. The KDJ indicator is also known as the random index. It is a very useful technical indicator that is most commonly used in short term stock market trend analysis. KDJ is a derived form of the Stochastic Oscillator Indicator with the only difference that an additional line is called the J-line. Values of% K and% D indicate whether the security is overbought (over 80) or oversold (under 20). The moments when% K exceeds% D are the moments to sell or buy. The J line represents the deviation of the% D value from% K. The value of J can exceed for the% K and% D lines on the graph.
The Relative Strength Index (RSI) developed by J. Welles Wilder is a pulse oscillator that measures the speed and change of price movements. The RSI hovers between zero and 100. Traditionally, the RSI is considered overbought when it is above 70 and oversold when below 30. Signals can be generated by looking for divergences and error fluctuations.
Williams% R, also known as the Williams Percent Range, is a type of momentum indicator that moves between 0 and -100 and measures overbought and oversold levels. The Williams% R can be used to find entry and exit points in the market. The indicator is very similar to the stochastic oscillator and is used in the same way.
The Directional Movement Index (DMI) is an indicator developed by J. Welles Wilder in 1978 to determine in which direction asset prices are moving. The indicator does this by comparing previous highs and lows and drawing two lines: a positive movement line (+DI) and a negative movement line (-DI). The optional third line is called "Directional Movement (DX)" and it shows the difference between the two lines. When +DI is higher than -DI, the upward pressure on the price is greater than the downward pressure. If -DI is higher than +DI, the price will have greater downward pressure. This indicator can help traders assess the trend direction. Crosses between lines are sometimes used as buying and selling signals.
Function
L3 Composite MACD-KDJ-RSI-WR-DMI Trading System is a simple trading system composed of MACD-KDJ-RSI-WR-DMI together. It can produce 6 types of long entries and 3 types of short entries. It utilizes divergence effect from MACD, KDJ and RSI to detect trend reversal. 6 types of Bottom and top divergence labels are displayed in the chart together with "BUY" and "SELL".
NOTE:In order to make the actual label of the chart more clear, this script does not add stop loss and take profit functions and according labels.
Signal
b1~b3 ---> MACD, KDJ, RSI bottom divergence signal respectively, which hint bull trend may start soon.
d1~d3 ---> MACD, KDJ, RSI top divergence signal respectively, which hint bear trend may start soon.
longentry1~6 ---> with composite indicators together, 6 types of long entry signal are produced.
shortentry1~3 ---> with composite indicators together, 3 types of short entry signal are produced.
Pros and Cons
Pros:
1. excellent open-close, long-short entry signal generation with multiple powerful indicators
2. indicator resonance can help to promote the confidence level of signal and divergence alerts
Cons:
1. integration of multiple indicators is not deeply optimized. fake signal may be produced without filtering schemes
2. no range filter is added
Remarks
To celebrate number of followers exceeds 100. This is my first L3 script published.
Readme
In real life, I am a prolific inventor. I have successfully applied for more than 60 international and regional patents in the past 12 years. But in the past two years or so, I have tried to transfer my creativity to the development of trading strategies. Tradingview is the ideal platform for me. I am selecting and contributing some of the hundreds of scripts to publish in Tradingview community. Welcome everyone to interact with me to discuss these interesting pine scripts.
The scripts posted are categorized into 5 levels according to my efforts or manhours put into these works.
Level 1 : interesting script snippets or distinctive improvement from classic indicators or strategy. Level 1 scripts can usually appear in more complex indicators as a function module or element.
Level 2 : composite indicator/strategy. By selecting or combining several independent or dependent functions or sub indicators in proper way, the composite script exhibits a resonance phenomenon which can filter out noise or fake trading signal to enhance trading confidence level.
Level 3 : comprehensive indicator/strategy. They are simple trading systems based on my strategies. They are commonly containing several or all of entry signal, close signal, stop loss, take profit, re-entry, risk management, and position sizing techniques. Even some interesting fundamental and mass psychological aspects are incorporated.
Level 4 : script snippets or functions that do not disclose source code. Interesting element that can reveal market laws and work as raw material for indicators and strategies. If you find Level 1~2 scripts are helpful, Level 4 is a private version that took me far more efforts to develop.
Level 5 : indicator/strategy that do not disclose source code. private version of Level 3 script with my accumulated script processing skills or a large number of custom functions. I had a private function library built in past two years. Level 5 scripts use many of them to achieve private trading strategy.
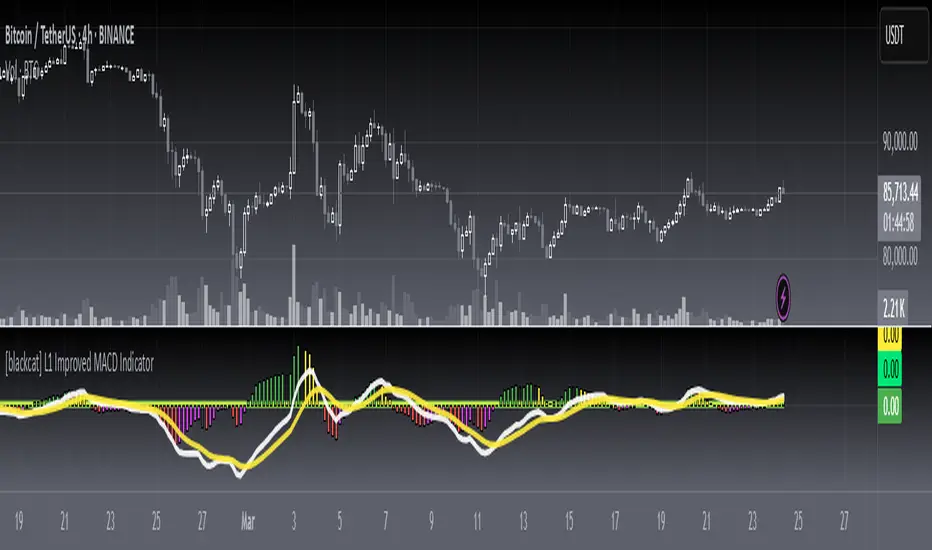
[blackcat] L1 Improved MACD IndicatorLevel: 1
Background
The MACD is a superior derivative of moving average crossovers and was developed by Gerald Appel in 1979 as a market timing tool. MACD uses two exponential moving averages with different bar periods, which are then subtracted to form what Mr. Appel calls the Fast Line. A 9-period moving average of the fast line creates the slow line.
Function
L1 Improved MACD Indicator mainly improves MACD histogram by customized an algorithm and add three levels of long entry alerts derived from ema().
Key Signal
buy1 --> the 1st level of buy alert in green
buy2 --> the 2nd level of buy alert in lime
buy3 --> the 3rd level of buy alert in yellow
diff --> classic MACD diff fast line in white
dea --> classic MACD dea slow line in yellow
macd --> classic difference histogram,but I did not use it directly in the plot.
Pros and Cons
Pros:
1. more clear sub level trend change with new histograms
2. three levels of buy alerts
Cons:
1. need sophisticated knowledge of MACD to use this well
2. this still requires a lot of MACD experience to obtain reliable trading signals
Remarks
I am a fan of MACD. Even the most classic MACD can have in-depth usage. I think MACD is the king of indicators.
Readme
In real life, I am a prolific inventor. I have successfully applied for more than 60 international and regional patents in the past 12 years. But in the past two years or so, I have tried to transfer my creativity to the development of trading strategies. Tradingview is the ideal platform for me. I am selecting and contributing some of the hundreds of scripts to publish in Tradingview community. Welcome everyone to interact with me to discuss these interesting pine scripts.
The scripts posted are categorized into 5 levels according to my efforts or manhours put into these works.
Level 1 : interesting script snippets or distinctive improvement from classic indicators or strategy. Level 1 scripts can usually appear in more complex indicators as a function module or element.
Level 2 : composite indicator/strategy. By selecting or combining several independent or dependent functions or sub indicators in proper way, the composite script exhibits a resonance phenomenon which can filter out noise or fake trading signal to enhance trading confidence level.
Level 3 : comprehensive indicator/strategy. They are simple trading systems based on my strategies. They are commonly containing several or all of entry signal, close signal, stop loss, take profit, re-entry, risk management, and position sizing techniques. Even some interesting fundamental and mass psychological aspects are incorporated.
Level 4 : script snippets or functions that do not disclose source code. Interesting element that can reveal market laws and work as raw material for indicators and strategies. If you find Level 1~2 scripts are helpful, Level 4 is a private version that took me far more efforts to develop.
Level 5 : indicator/strategy that do not disclose source code. private version of Level 3 script with my accumulated script processing skills or a large number of custom functions. I had a private function library built in past two years. Level 5 scripts use many of them to achieve private trading strategy.
Multi Oscillator Divergence IndicatorTradingview Built-in Divergence Indicator with RSI is extended for Price Divergence with
- RSI
- MACD
- Sochastic
- Money Flow
- Demand Index
- Chaikin Money Flow
Thanks to tradingview for providing this unique indicator.

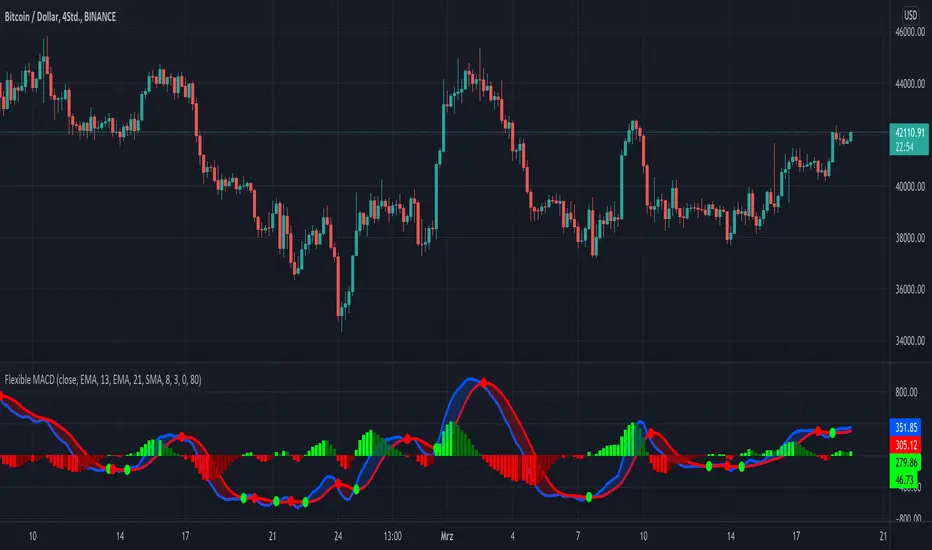
KINSKI Flexible MACDFlexible MACD (Moving Average Convergence/Divergence) Indicator
The Moving Average Convergence Divergence consists of three elements: two moving averages (the MACD line and the signal line) and a histogram. The blue MACD line is the difference between a longer and a shorter EMA (here 13 and 21 periods preset), the red signal line is an SMA (here 8 preset) on the MACD line. The histogram (green: ascending, red: descending) shows the difference between both lines.
As soon as the blue MACD line crosses the red signal line, circles are generated that indicate an up/down trend. If the red signal line is greater than or equal to the blue MACD line, this indicates a downward trend (red circle). If the blue MACD line is greater than or equal to the red signal line, this indicates an upward trend (green circle).
The special thing about this MACD indicator is the many setting options, especially the definition of the MA variants for MACD (Fast, Slow) and signal. You can define the following MA types: "COVWMA", "DEMA", "EMA", "EHMA", "FRAMA", "HMA", "KAMA", "RMA", "SMA", "SMMA", "VIDYA", "VWMA", "WMA".
You also have the following display options:
- "Up/Down Movements: On/Off" - Shows ascending and descending MACD, signal lines
- "Up/Down Movements: Rising Length" - Defines the length from which ascending or descending lines are detected
- "Bands: On/Off" - Fills the space between MACD and signal lines with colors to indicate up or down trends
- "Bands: Transparency" - sets the transparency of the fill color
Disclaimer: I am not a financial advisor. For purpose educate only. Use at your own risk.
McClellan Oscillator [CC]The McClellan Oscillator was created by Sherman and Marian McClellan and it is essentially a MACD of the advancing and declining symbols of the day and is best used as a comparison with the biggest stocks such as my example Apple but that is just my opinion. I pulled the symbol names from a Trading View blog so I'm not 100% sure if they are accurate so please let me know if I'm wrong. Buy when the indicator is over 0 and sell when it falls below 0 but keep in mind that these values are for the market itself and not the individual symbol.
This was a special request so let me know if you would like me to publish more scripts or if you want something custom done!
Note: I'm republishing this because the original script couldn't be found in searches so this will fix that.

[CryptoWho] Multi DivergencesThis script looks for divergences on up to six indicators, sums them up and draw a histogram below the chart.
You have several options to customize the output:
1. indicators: RSI, Stoch RSI, MACD, CCI, OBV, WaveTrend (LazyBear)
2. Divergences: Regular, hidden, both
3. Lookback period for divergences
BITSTAMP:BTCUSD

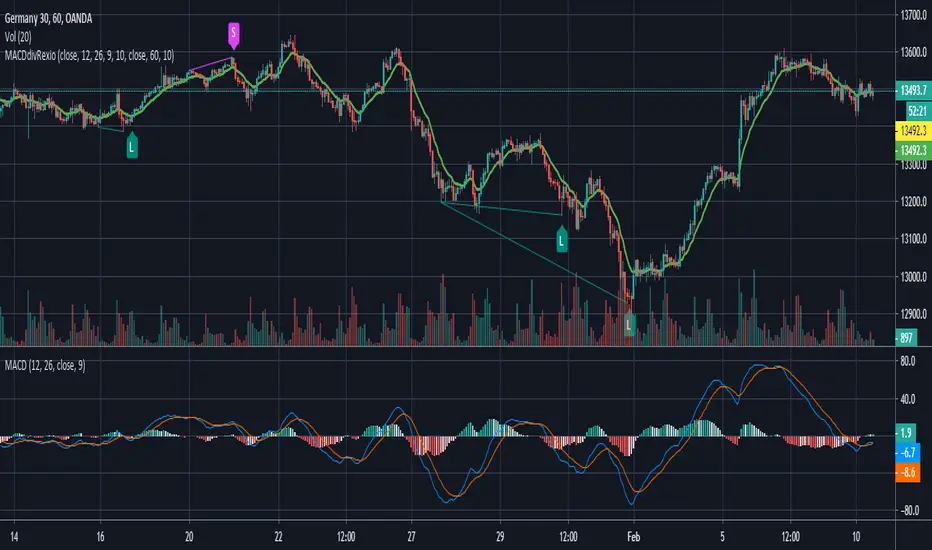
MACD divergence with line drawing by RexioAnother appoach to finding divergences at MACD. This time I think it is much smoother so I could check for divergences between two "peaks" at MACD.
I added my SL line which is last peak +- 1xATR. And the second line is peak between two points of divergence and most of the time it acts like an SR line.
If the higher timeframe trend backs up our divergence (for example: higher trend UP - divergence for L position) I can try to jump in after crossing EMA10.
This indicator is only sugestion for me. I always check price action, trend, SR line before I take any action.
Every people who will test this indicator need to know basics about divergences as THISE ARE NOT BUY/SELL SIGNALS.
If you want to help me and support my coding please contact me via private msg.
MACD Divergence +This study plots MACD Divergences and has the option of plotting a Top Dog Trading - MOM and DAD Version of the MACD
MACD Histogram and outline change color when increasing or decreasing above or below the zero-line,
Background also changes color according to MACD Line cross of Signal Line and 0 line or The Direction of DAD
Plenty of Alerts so that you dont have to stare at the screen all day

MACD w/ DivergencesTo best use the MACD Divergence indicators, adjust the following settings accordingly.
• MACD Bullish Divergence Under: <0 (lower for larger volatility and more bearish markets)
• MACD Bearish Divergence Above: >0 (higher for larger volatility and more bullish markets)
THIS SCRIPT DOES NOT REPAINT AND IS COMPLETELY FREE.
Goodluck Trading!

[SignalFI] MACD PrimeWelcome! As part of our continual process to build and enhance trusted existing indicators, we're proud to release MACD Prime to the PRIME series for those traders that rely on the popular divergence mechanics traditional MACD provides.
MACD Prime provides a default MACD structure using the popular 12,26 EMAs and a 9 lockback signal line as the core of the indicator's functionality. In this way, you will get a consistent view for what you're use to, but of course we've added additional functionality that can be used to increase the value this view provides when trading.
ADDITIONAL Functions:
1) MACD Fast and Slow EMA sources are selectable, thus allowing the user to select OHLC variants as the source input for the 12/26 trendlines.
2) Background Coloring is based on a secondary "Signal" color which be default has been set to 6. This length is configurable, and providing a leading edge to the typical "MACD Cross". Said simply, the background color will change with the trend BEFORE a default MACD cross occurs. This may provide early warning of a MACD cross, and allow for additional entry/exit signals to manifest depending on other confluence with price and trend information.
3) MACD Trend Lines. In accordance with the PRIME series MACD Prime comes bundled with Trend Line support and resistance pivots that provide additional context for how the MACD may act based on a previous and projected trend line information. By default projections are turned off, but can be enabled from within the menu options. These trendlines can be used to spot divergences as well, and can be tuned within the option to increase resolution or decrease noise provided by trend lines.
All other standard functions persist, including the typical MACD line, MACD Signal Line, and MACD Histogram.
SignalFI was created to help traders and investors to effectively analyze the market based on the Golden Mean Ratio (Fibonacci numbers), plan a trade and ultimately execute it. To help inform and educate market decisions we developed a set of Trading Indicators which are available on TradingView.
SignalFI indicators are just that, indicators. Our indicators are generally configured to use completely historical data (negating repaint), and we advise all alerts created with SignalFI indicators to be fired upon "close" of the current candle. Our indicators can provide valuable context and visualization support when performing market analysis and executing buy and sell decisions. However. we are not financial experts, and all information presented on this site or our other media outlets are for educational purposes only.

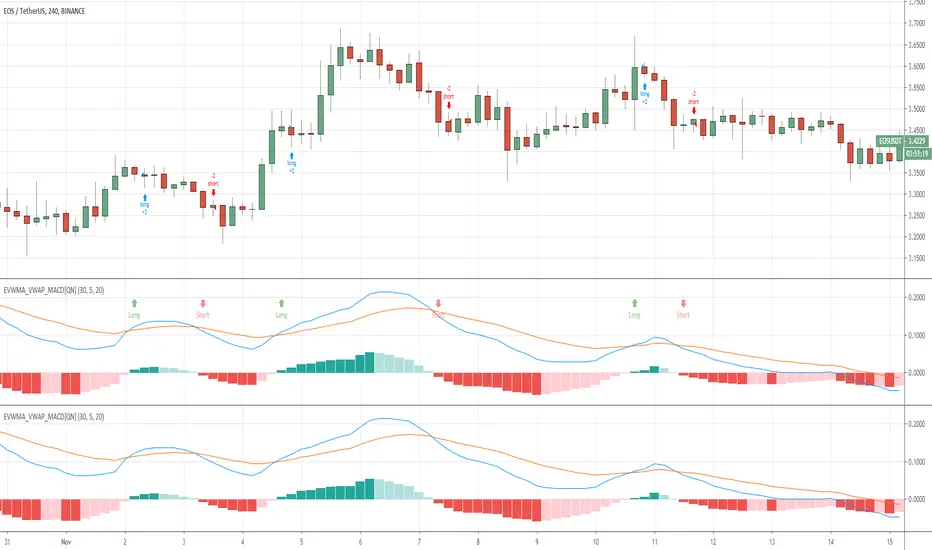
QuantNomad - EVWMA MACD StrategyPretty simple EVWMA (Elastic Volume Weighted Moving Average ) MACD Strategy.
EVWMA is a quite interesting moving average where the period of the MA is defined from the volume itself.
It incorporates volume information in a natural and logical way. The EVWMA can be looked at as an approximation to the average price paid per share.
As a volume period, you can use sum of the last x bars volumes.
Here are other EVWMA indicators/strategies:
EVWMA indicator:
EVWMA Cross strategy:

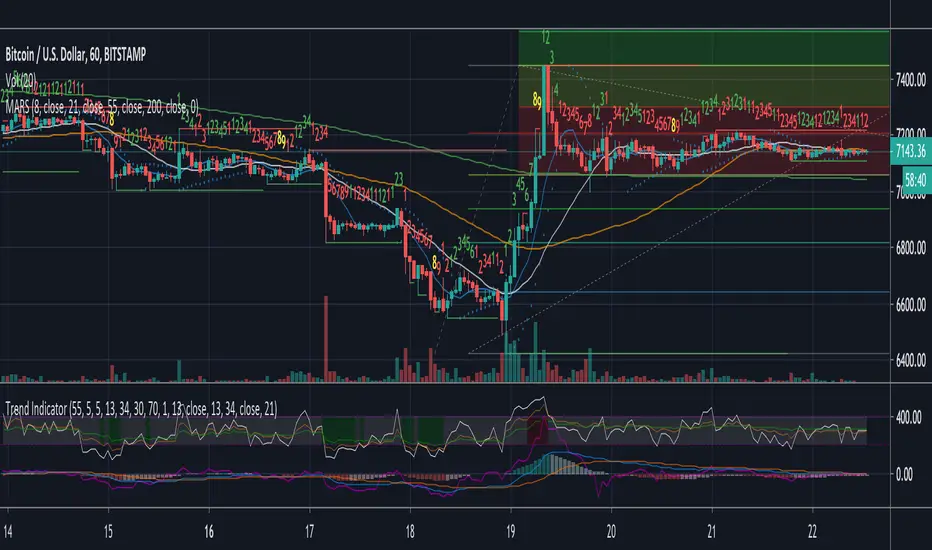
Trend Indicator
A Simple indicator combining 3 of the most popular Oscillators RSI, MacD and Momentum to help see reversals or the continuation of a trend. Designed with the COINBASE:BTCUSD chart in mind but there's not reason it shouldn't work on any other asset.
The indicator has two main parts:
- The gray area at the top between the purple dotted lines is 3 RSI's in one (5, 13, 34) These have been moved up from the RSI's original position to avoid cluttering the MacD and make the lines easier to read. Just like with the regular RSI the lower dotted line indicates oversold and the top dotted line indicates an overbought condition.
To identify this more easily the background changes to green when the middle (13 period) RSI is oversold and red when it's overbought.
*Note* On some very small timeframes the position may need to be adjusted in order to make them easier to see.
This section of the indicator is designed to give early warning signs of markets reversing by the faster white line with confirmation from the orange and green lines.
- The bottom section of the indicator has two parts. The first is a modified MacD which is slightly longer term than the original. This is to act as confirmation or entry/take profit points on divergence or if either of the lines within the MacD crossover or the histogram goes from one color to the other. The histogram is also helpful for trend-following as it lets you gauge if the momentum is gaining or losing strength.
The last part of the indicator is simply a momentum line to indicate in which direction the momentum is heading. It's designed as a confirmation of the other indicators and shouldn't be used on it's own.
All individual indicators that make up the trend indicator have been tweaked slightly to use numbers from the fibonacci sequence rather than the originals.
This indicator is best used in combination with volume and moving averages.
- Look for reversals on low volume near a moving average or key historical point.
- Look for breakouts on high volume if the oscillators line up.
Iconik Trading Suite: Divergence SeekerVisually displays divergences of almost a dozen indicators.
DM for a PowerPoint describing this indicator and the rest of Iconik in detail.
Iconik Trading Suite Indicator List:
ITS-OSC: Oscillators (v2)
ITS-PAA: Price Action Alerts (v2)
ITS-ASR: Auto Support/Resistance
-> Daily (v2)
-> 3 Day (v2)
-> Weekly (v2)
ITS-4TFC: 4 Time Frame Confirmation (v1)
ITS-DIV: Divergence Seeker (v1)
