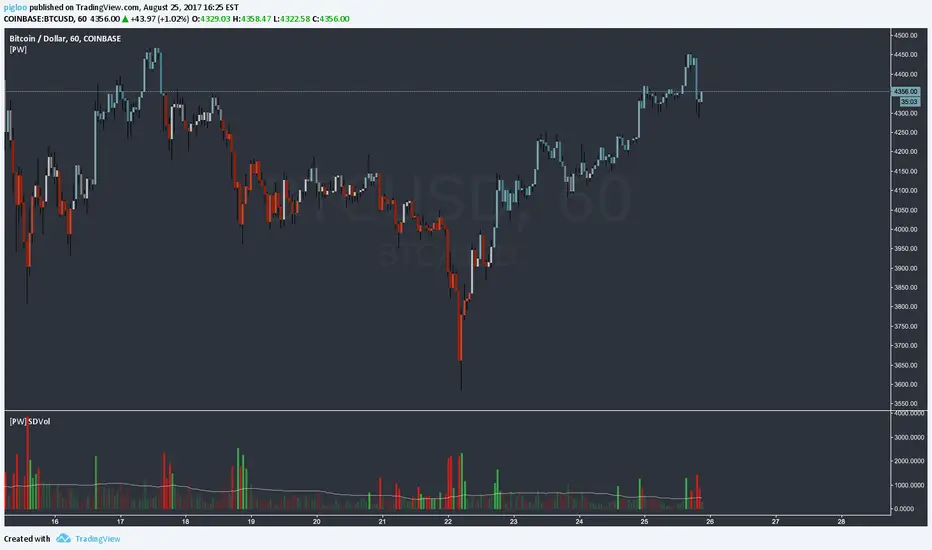
[PW] Volume Standard DeviationHere is a nice little script that highlights areas of volume using standard deviation, you can choose the look back periods.
This script is based on the excellent script by: @SteynTrade -
I have simplified it a bit and made it readable to my taste using alpha to highlight high volume areas.
Enjoy.
Mean
B3 20/50 MeanSimple MA's 20 and 50 are averaged to produce a mean MA line. I like the smoothness of it, and it can help you stay in a trade in the slow moving trends. Also if you start to see a large cloud in your favor, it could be a great time take the profits.

B3 ALMA PendulumB3 Pendulums, quick little indicators that do change print inside the current bar, so beware. It is good for anticipation, but it is important to make sure the current and next bars follow through.
Ever wanted an indicator that really points out the micro term action in the form of a pendulum swing? This my attempt to show the market ups and downs in the smallest amount of lag possible. This indicator is designed to bounce back and forth from 100 to -100 as it shows you the price's relationship to ALMA. Really its just a simple deviance from mean study made to amplify the quick ups and downs, and kind of the neatest on Heikin Ashi setups. It looks like Arabic language at first glance, lol.
This should be easy to template out to your own MA's. ~I hope you are enjoying the B3 scripts, that is now 9 open source shares and a couple protected ones. I still plan on a few more give-a-ways, as I prepare some of the algorithmic things I do for subscription. Feel free to comment about things you would like to see! ~B3

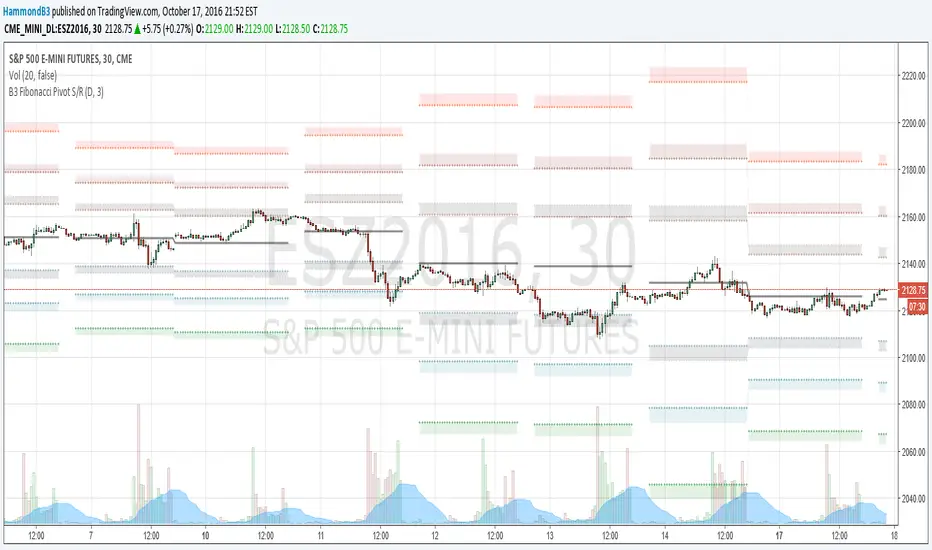
B3 Fibonacci Pivot S/RFor my second share, I give you some levels I look at everyday for the ES minis. HLC/3 of the MTF (multi-time-frame) inputs = mean and Fib-levels formed as support and resistance zones. There are some websites that will show you 20 ways to figure out a pivot for the day's intraday workings, and this one always rang true for me. I keep it set at Res=D and Len=3or5 and use on hourly charts. This indicator is capable of doing like a Res=60m Len=8 for a 5m chart or something of that nature if you wish to test it out.
I haven't tested it out for tick charts and I have noticed that this is good on index and commodity futures, and not so much other things.
Uncanny to me how well this works as reversal awareness for ES. Doesn't mean that one will happen, or if it does that it will have trade-able juice, though it is very important awareness never-the-less.
screencast.com
Function Mean Median Mode V0EXPERIMENTAL:
Request for GLAZ
Functions to handle Mean, Median, Mode Calculation.

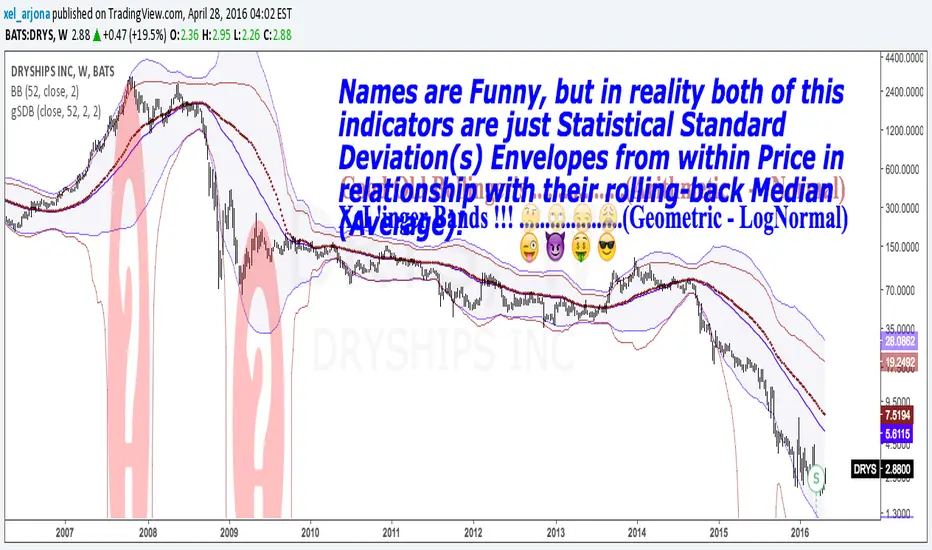
GEOMETRIC STANDARD DEVIATION BANDS v1 by @XeL_ArjonaGEOMETRIC STANDARD DEVIATION BANDS
Ver.1 By Ricardo M Arjona @XeL_Arjona
DISCLAIMER:
The Following indicator/code IS NOT intended to be a formal investment advice or recommendation by the author, nor should be construed as such. Users will be fully responsible by their use regarding their own trading vehicles/assets.
The embedded code and ideas within this work are FREELY AND PUBLICLY available on the Web for NON LUCRATIVE ACTIVITIES and must remain as is.
WHAT'S THIS?
This IS NOT the wheel "Re-Invention"... This is exactly what the name says: A pair of Envelope Bands to measure "volatility", constructed at statistical relation from within price series and their Rolling back MEAN (Simple Moving Average). YES, What Mr. Bollinger did and put it's name to this simple, cleaver and popular formula.
This time, I took the time to make another simple mod, but seems to me to be quite functional in REAL VOLATILE assets like in the example chart: TO USE THEIR GEOMETRIC MODE!!
Cheers!
Any feedback or public modification(s) are quite welcome to the community....!
@XeL_Arjona
Apr 28 2016
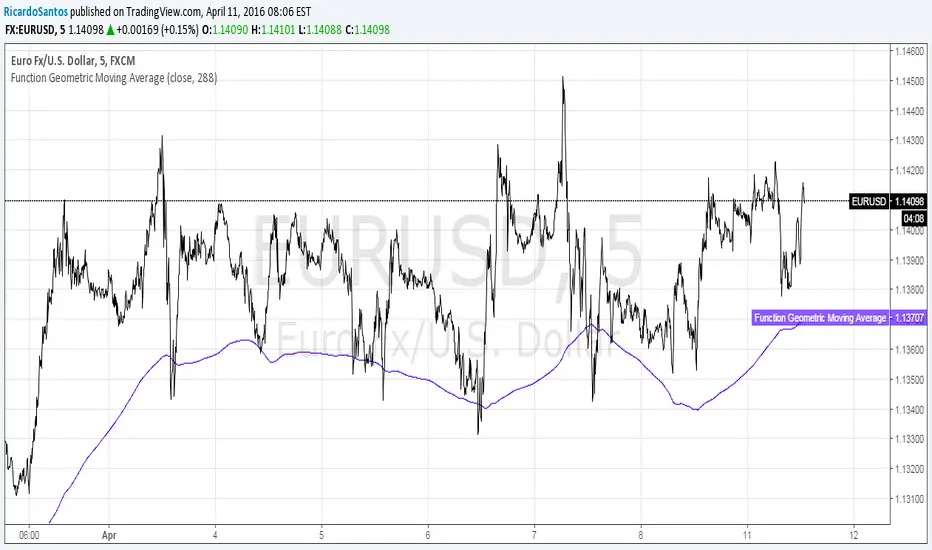
Function Geometric Moving AverageUsing a formula that is generally used for calculating investment over time to check gains on a commodity.
Geometric mean as described here: www.investopedia.com
Function Geometric Mean OscillatorUsing a formula that is generally used for calculating investment over time to check gains on a commodity.
Geometric mean as described here: www.investopedia.com

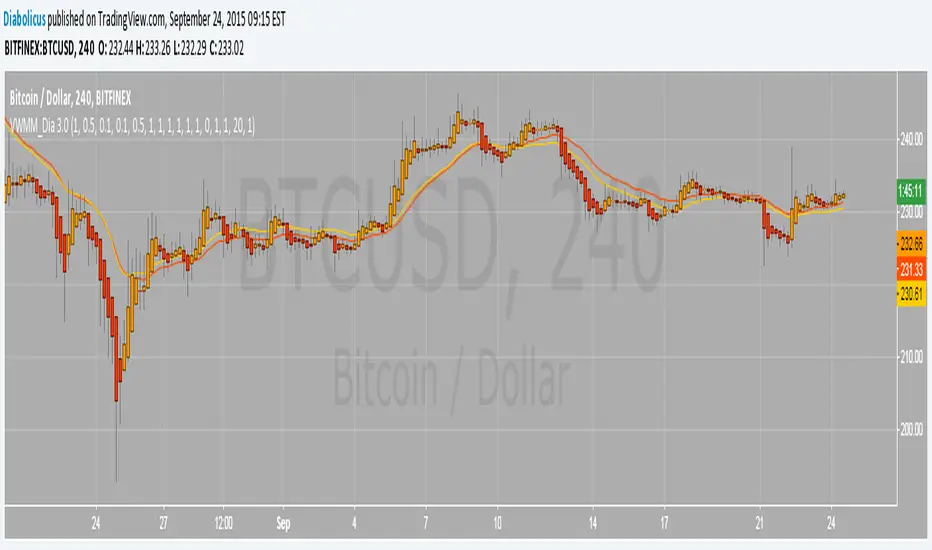
Volume Weighted Market Mean 3.0 [Dia]150924 - v3.0
This script is a complete rewrite of the previous version here .
It gathers market data from up to 8 different Bitcoin exchange pairs (8 is maximum due to script limitations).The influence of each single exchange can be customized individually, default is 50% for 0-fee exchanges, 10% for futures and 100% for all others. For each single exchange a standard deviation from the composite mean price and a average price range are determined. To make data from exchanges with different liquidity comparable, all single exchange price ranges are normalized to the range of the composite mean price. To make data from exchanges with different fee structure (= exchanges that constantly trade at a premium / discount) comparable, all single exchange prices are corrected by their respective standard deviations. To account for trade volume, all price data is weighted by the current candles volume.
- optional Heikin Ashi candle display
- optional EMAs
- lots of switches to play around with ;-)
UCS_TTM - Reversion BandsOk, Here we go - Version 1 of TTM Reversion Band goes live.
Link to TTM Reversion Band - www.tradethemarkets.com
Link to TTM Reversion Band Guide - kb.simplertrading.com
John Carters Mastering the trade - www.amazon.com
For the amount of information this has, the price tag is not hefty.
John's RTM Chapter Synopsis - www.tradethemarkets.com
What did I modify?
1. Automated the Daily + and Intraday settings. So Switching to intraday will change the setting automatically.
2. Added text callouts for RTM condition
a. John Carter's Indicator
b. Slope Based (my addition).
Future Improvement Planned.
1. Will Convert this into a system based on John's Indicator from TS.
2. Custom Options for Slope and MA setting for Trade filter.
