Gap finder (gold minds)This tool highlights where gaps happens and outlines in the chart where the gap zones are. If there is a gap up there is a green line, a gap down it is red. The gap zone is highlighted in blue. You can choose the size of your gap with the input menu to the desired size. Feel free to ask comment below. Made for the Gold Minds group
金屬

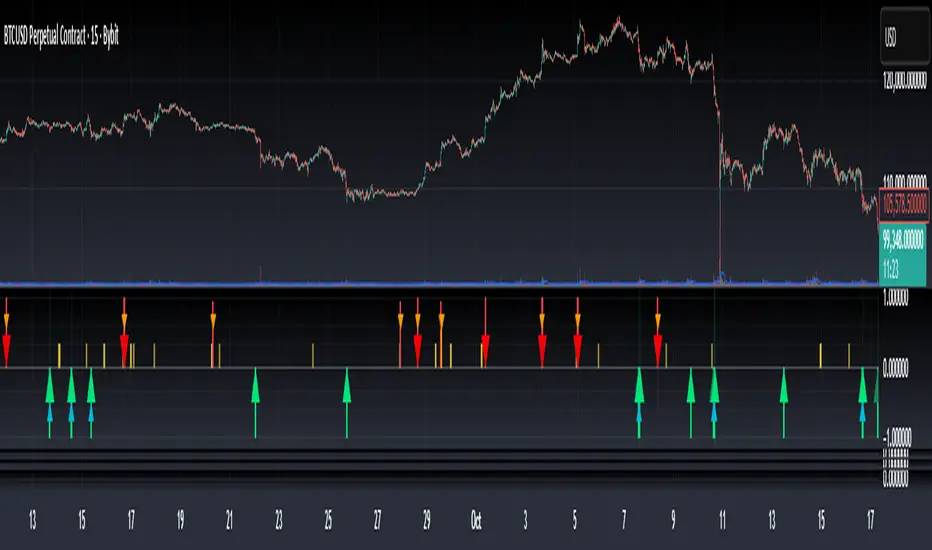
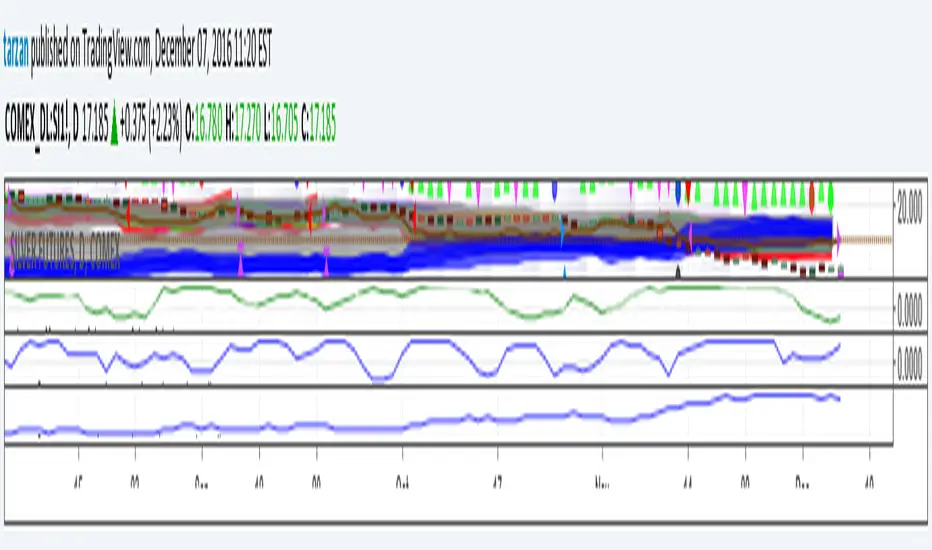
Bottom & Top Finder v3.0Bottom & Top Finder v3.0 is a proprietary multi-component oscillator designed to identify potential market reversals and extreme price conditions. The indicator analyzes momentum, volatility, and price behavior to generate bullish and bearish signals with strength classification.
█ OVERVIEW
Each signal is classified into three strength levels (Weak, Medium, Strong) allowing traders to prioritize high-conviction setups.
Signal Classification:
• Strong signals (±1.0): High conviction setups with multiple confirmations
• Medium signals (±0.6): Moderate conviction with key component alignment
• Weak signals (±0.33): Early warnings or preliminary indications
█ KEY FEATURES
Smart Signal Management
The indicator includes an intelligent system that allows signal sequences to complete naturally while preventing excessive noise. Unlike traditional cooldown systems that block all signals during a cooldown period, this implementation allows consecutive signals during a "run" and only applies cooldown after the signal run ends. This ensures complete multi-bar patterns are captured while preventing rapid flip-flopping.
Advanced Filtering System
Three optional filters allow adaptation to different market conditions:
• Volume Confirmation Filter: Validates signals against recent volume activity across a configurable lookback period. Checks if any bar in the lookback window exceeded average volume by the specified multiplier.
• Trend Alignment Filter: Four operational modes including With Trend, Counter Trend, Statistical Distance, or Off. The anomaly mode uses calculations to identify signals only at statistical extremes rather than simple directional bias.
• Signal Type Selection: Enable or disable weak, medium, and strong signals independently based on your trading style and risk tolerance.
Comprehensive Alert System
Ten distinct alert conditions cover every use case. Alerts include price level and timestamp, and are ready for webhook integration with automated trading systems.
█ HOW TO USE
Basic Setup
1 — Add "Bottom & Top Finder v3.0" to your chart in a separate indicator pane
2 — Optionally add "Bottom & Top Finder v3.0 - Chart Labels" for on-chart visual markers
3 — Configure lookback periods (defaults work well for most timeframes)
4 — Enable or disable signal strengths based on your trading style
5 — Apply filters as needed to reduce noise in your specific market
Signal Interpretation
Histogram magnitude indicates signal conviction. Multiple signal types can fire simultaneously and are aggregated into the composite score.
Alert Configuration
Set up alerts through TradingView's standard alert system using the built-in alert conditions. Choose from individual signal types (for specific setups) or aggregate alerts (for broader monitoring).
Recommended Approach
• Combine indicator signals with price action and support/resistance analysis
• Use strong signals for entries, weaker signals for early warnings or exits
• Enable filters when trading liquid markets with reliable volume data
• Adjust cooldown period based on timeframe: lower for active trading, higher for swing setups
• Start with default settings and adjust based on backtesting results
█ SETTINGS
Lookback Settings
• Main Lookback Period: Primary calculation period for most components (default: 21). Lower values increase sensitivity, higher values smooth signals.
• Range Lookback: Extended lookback for range high/low analysis (default: 50). Affects extreme condition detection.
Signal Settings
• Enable Weak Signals: Toggle weak signal detection (default: on)
• Enable Medium Signals: Toggle medium signal detection (default: on)
• Enable Strong Signals: Toggle strong signal detection (default: on)
Filter Settings
• Enable Volume Filter: Require volume confirmation (default: off)
• Volume Lookback: Period to check for volume spikes (default: 30)
• Volume Spike Multiplier: Threshold above average volume (default: 1.3x)
• Trend Filter Mode: Off, With Trend, Counter Trend, or Anomaly (default: off)
• Trend SMA Period: Moving average period for trend calculations (default: 50)
• Anomaly Threshold: Minimum statistical deviation for anomaly mode (default: 1.5)
Display Settings
• Show Composite Histogram: Toggle main histogram display (default: on)
• Show Signal Bars: Toggle triangle markers in indicator pane (default: on)
• Show RSI Reference: Overlay normalized RSI for context (default: off)
█ TIMEFRAME CONSIDERATIONS
The indicator works on any timeframe from 1-minute to monthly charts. However, optimal performance requires timeframe-appropriate configuration:
Shorter Timeframes (1m-15m)
Consider reducing main lookback period for increased responsiveness. Volume filter may be less reliable in some markets during low-liquidity sessions.
Medium Timeframes (1H-4H)
Default lookback periods are optimized for these timeframes. Volume and trend filters provide good noise reduction.
Longer Timeframes (1D+)
Consider increasing lookback periods for smoother signals. Filters are highly effective at these timeframes.
█ BEST PRACTICES
Risk Management
This indicator is a technical analysis tool designed to identify potential reversal zones and does not guarantee profitable trades. Users should:
• Understand that signals indicate potential setup zones, not guaranteed outcomes
• Employ proper position sizing and risk management on every trade
• Combine indicator signals with their own analysis and trading strategy
• Paper trade and backtest thoroughly before live implementation
• Never risk more than they can afford to lose
Signal Context
Indicator signals should be evaluated within broader market structure. Consider:
• Proximity to key support and resistance levels
• Overall trend direction and strength
• Market volatility and liquidity conditions
• Confluence with other technical indicators or patterns
• Fundamental factors that may override technical signals
█ NOTES
• All signals use confirmed bar data and do not repaint
• The cooldown system tracks top and bottom signals independently
• Multiple signal types can fire simultaneously; the composite score aggregates them
• Anomaly mode measures standard deviation magnitude, not just directional bias
• Volume filter checks any bar in the lookback period, not just the current bar
• Strong signals require more confirmations than medium or weak signals
Top Finder 1.1Top Finder is an automated cryptocurrency signals and analysis tool which uses a complex algorithm involving multiple indicators, trends, and cross-overs including proprietary formulas developed in-house to predict the top or near top price of cryptocurrencies. It also works well on stocks, gold, oil and forex, even soybeans!
Top Finder is the sister indicator to Bottom Finder (check my other scripts).
Signal strength is represented by height/color of the signal. (Taller signal = stronger signal).

Bottom Finder 2.2Release 2.2
Bottom Finder is an automated cryptocurrency signals and analysis tool which uses a complex algorithm involving multiple indicators, trends, and cross-overs including proprietary formulas developed in-house to predict the bottom price of cryptocurrencies. It also works well on stocks, gold, oil and forex!
Future updates will be included onto this script.
Tip #1: In a bear market, the Half height (fuchsia colored) signals should be ignored by the risk averse trader. In a bull market feel free to buy on both the signals.
Tip #2: In a bear market, use a smaller percent gain instead of TSSL to set your exit targets. In a bull do the opposite, using TSSL (or method of your choice) to exit.

Bottom Finder 2.1Release 2.1 Final!
Bottom Finder is an automated cryptocurrency signals and analysis tool which uses a complex algorithm involving multiple indicators, trends, and cross-overs including proprietary formulas developed in-house to predict the bottom price of cryptocurrencies. It also works well on stocks, gold, oil and forex!

Dhananjay Volatility stop strategy v1.0
Sharing one more strategy after getting good feedback on my earlier published strategy.
This is simple volatility stop strategy where in we are using VStop as entry and exit point.
Again smart traders can add MA to decide the trend and can avoid trading in opposite direction of trend which will help them to minimize loss making trades.
There are more than 1 parameters which traders can use/change to make this strategy compatible to their instrument.
To understand what is VStop use google.com :-)
Looking forward to receiving feedback from all of you.

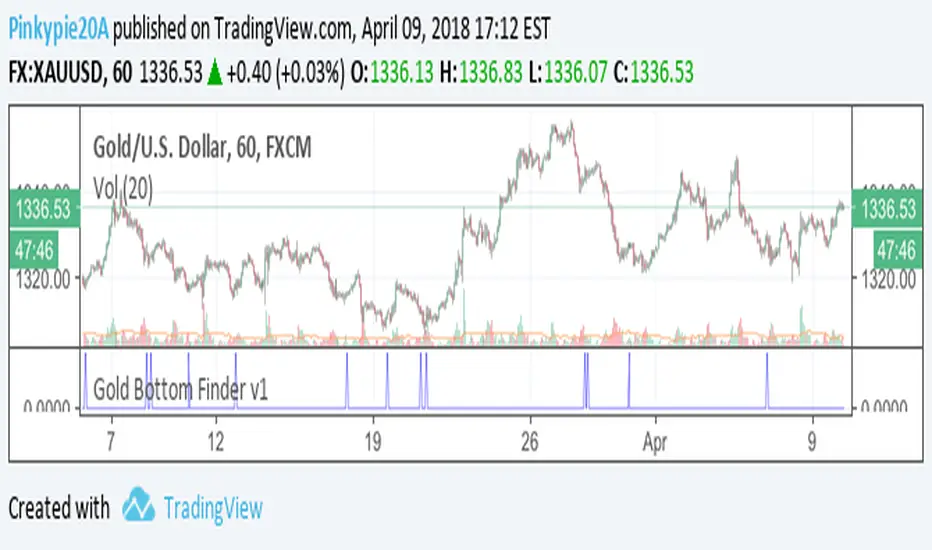
Gold Bottom Finder v1For the gold bugs, Bottom Finder Gold edition v1 script. If you would like to try it out, please post your access requests below.
Ichimoku Cloud strategy for gold marketThis strategy is based on main ichimoku features (Leading span , conversion line and base line) compared to cloud conditions.
I indicated all possibilities in this indicator and strategy decision is based on crossing factors of each main line through two other line confirmations.

min_Crypto_Thesis_indicator_MoriceauThis indicator is for minute candlestick and this back test work perfectly with Bitcoin and Gold.
The indicator tells you when you need to buy and sell your position. The backtest work at 86% of the last year.

Tick Tick BoomThis is THE tick tick boom method from the GOLD MINDS group!
When we enter a trade the line changes color.
If your charts are not in UTC time then you can adjust the UTC offset time. If your charts are in UTC-9 then set this to 9, if you are in UTC+1 set this to -1, if your charts are un UTC then set this to 0.
I noticed daily pivots, support, and resistance levels are pretty useful targets here. Uncheck the box if you would like to see the levels.
Many thanks to Dimitri Wallace!

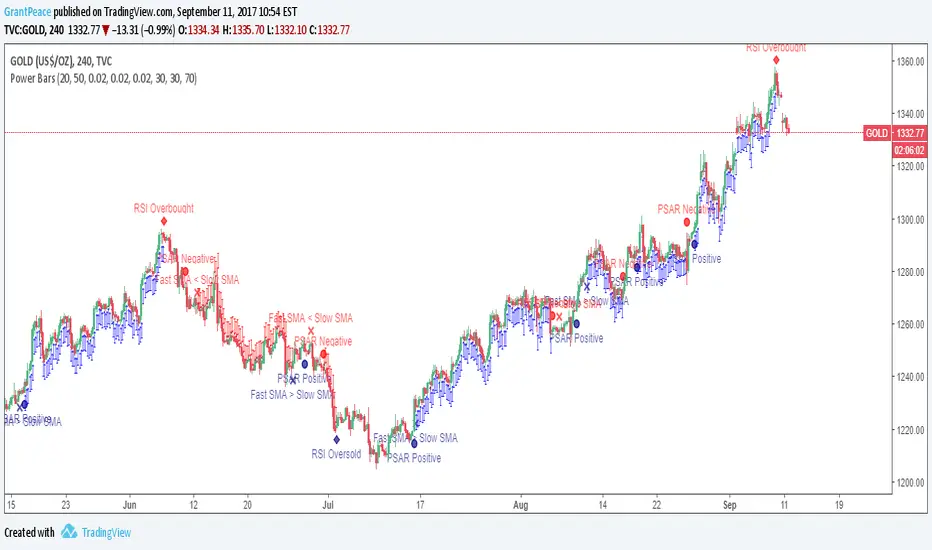
Power Bars This is the latest and greatest of technical analysis .
Values for your favourite indicators can easily be changed to customise your strategy.
When an indicator becomes bullish or bearish , a notification appears on the bar.
When all indicators align, Power Bars show up. Red Power Bars are bearish , blue Power Bars are bullish.
This is what the bars look like close-up.

cooltoyz: The Turtle SurferThis strategy applies the old tested turtle trading strategy, defining a channel and riding the trend, but
It has some twists tough, to make it adapt on the fly to changes in market conditions.
Since all parameters can be adjusted from the inputs, the strat can (and needs) to be fine tuned for the current values of an asset. for example, for gold values, it works good for years. for btc, it breaks for dates with values under 1500$. that's because 1% of 800 is not the same as 1% of 2400$..... Yeah, data fitting, i know all that....
Some of the parameters work well only for low volatility markets, others are designed exactly to capture volatility. So the parameters must be tested, turned on-off to see how well they do. The default values ARE NOT a generic good for all, most surely.
The Turtle Surfer moves slowly, but it's prepared to rabbit jump in/out if some moon/doom event shows up without invitation :)
If you want to play with the strat, start with all checkboxes off, then turn on/off each one and see the results for the asset you want.
I have had good results in xau, btc and eth

15 Minute Gold Trend-Following StrategyThis is the main strategy that I will be forward testing on demo for a month or two, then making it an EA in MetaTrader4
You can see the code for yourself this time, all the strategy is, is a crossover of various moving averages.
Commission included, $10,000 account.
Results over the past 3 months, beginning in January 2017.

5 minute XAUUSD Strategy (Gold)Most definitely this is the best strategy I have ever coded. (Read Note Below)
Version 3 of PineScript code, 2 contract/lot trades at once, pyramiding = 2.
Commission of 100 pips included on each trade, accurate representation of actual spreads, commission_value = 0.02.
This is essentially 270% of profit in a single month - check the date on the first trade.
Trend following strategy as all the previous ones before, but this one is crazy.
Max drawdown is 34%, all that drawdown and more is profit made, but there cannot be any emotional involvement in this strategy.
Choppy markets produce losses, as is with all trend-following strategies.
(4 lines of code, nice and simple)
Downside - the last month in which this was backtested may not provide actual representation of past movement (market could have been exceptionally trending the last month), (but maybe it does ;v)
Unfortunately, we cannot know because "TRADINGVIEW WON'T OFFER BACKTESTING FOR FARTHER BACK!" fix this please.

XAUUSD 1minute StrategySorry, protected script as it uses a couple key indicators that are somewhat of a trade secret.
What I will tell you, is that the code is version 3, so no repaints, although this one never had them in the first place.
In my code, I use 'contracts', which I suppose are sizes, of 20.
Commission included to make it more realistic.
All this profit is from the start of the last week.
This is a trend-following strategy, so it does poorly in ranging conditions.
Essentially 4 lines of code.

Upgraded XAUUSD 30m only Strategy V2.0So i've been fiddling around with this once more
The result is increased net profit, same time frame as previous strategy, more drawdown, but that comes with the net profit.
1 pip = 1$
Pyramiding of 3 orders.
Commission included.
More trades
Profitability rate is about the same.
Gold/Silver 30m Only Strategy Buy/Sell SignalsIn my free time I felt like coding this strategy, and after backtesting it, it appears that the 30m time frame is the most profitable.
I only have been working on it for gold, but it should work similarly for silver as well.
This includes no pyramiding, and with pyramiding orders of 5, this strategy is upwards of 100% profitable.
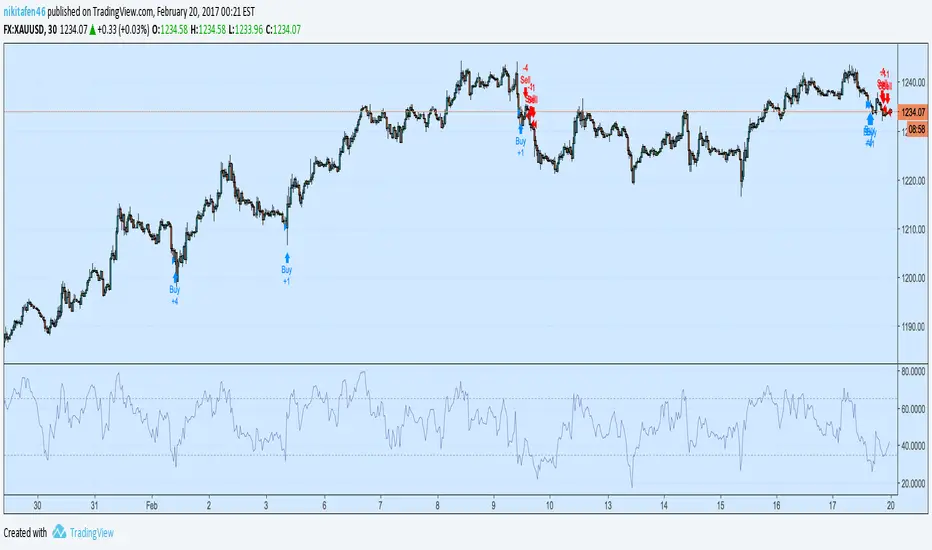
Buy order - when price is above the 162 day EMA and RSI is less than 35
Sell order - when price is below the 162 day EMA and RSI is greater than 65
I will probably be adjusting it to increase the profitability and %success rate.

420_betaA newer, more customizable version of the holy grail script I published for silver before.
This script is a work in progress (as was the last version) and although I have been trying to refine this script I would still only classify it in the early stages of development; unlike my previous Euro Dollar strength holy grail script which was designed to work with only the EU pair or the XAGUSD spread script that was designed to work only with silver traded in USD, this script is designed to work with ANY commodity traded in USD, EUR, GBP, or JPY.
In this version I have tried to make smaller time frames work (60 - 240 supported now?) and added a lot of options for average type to be considered in the basket. Not every average created equally though, so I need feedback still etc...
I have also added the ability to specify what the 'basis currency' is. For example XAUUSD --> USD is basis currency. XAGGBP --> GBP is basis currency.
The only supported currencies at the moment are USD, EUR, GBP, and JPY (case sensitive)
If someone requests another (CHF, CAD, etc) I can add that as well.
I have an alert centric version (study, not a strategy) that I am trying out as well on my Euro dollar strength script and this 420_beta script
If you want access, feel free to ask, but as this is still in beta and I'm looking for feedback I'll probably only provide this script to those who have a record of trading commodities here on TV (aka published an idea on XAUUSD, XAGUSD, USOIL, Copper, etc...)
- Snoop

420_alphaA newer, more polished (aka less buggy), and updated version of the holy grail script I published for silver before.
This script is a work in progress (as was the last version) and although I have been trying to refine this script I would still only classify it in the early stages of development; unlike my previous Euro Dollar strength holy grail script which was designed to work with only the EU pair or the XAG spread script that was designed to work only with silver, this script is designed to work with ANY commodity traded in US dollars as this script also utilizes my holy grail basket method to determine the true strength of any commodity in terms of USD.

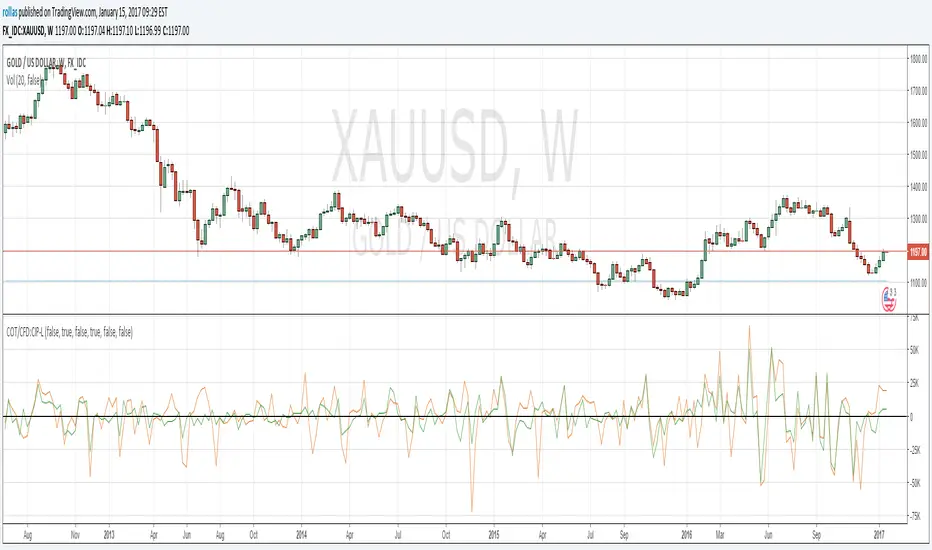
COT/CFD:CIP-LThe Commitments of Traders (COT) reports provide traders positions at the close of Tuesday's trading session. Reports show how many long and how many short contracts do traders of each category hold. This version covers the change in positions (CIP) in legacy format for CFD's. Default is Futures only. You can include Options from the input menu. From the style menu you can turn on or off different trader groups data. As the original data is weekly, charts will only work at weekly and upper time frames.
Tarzan's spread ratio indicator - DeLuxeThis indicator plots any two securities as a spread ratio using either +,-,/, or *.
It also allows you to use a simple moving average of length 1 to n for your spread ratio.
If you know what you want to do but don't know how to code it, we can work it out, you can float me some cheese on paypal and I'll do a nice job. This indicator is yours for free.
Tarzan = noprism@hushmail.com
Peace
USD (basket) / XAG SpreadHey all; I made this script for default usage on the 15 min chart for XAGUSD, try it out and tell me what you think.
It is similar to what the original user /u/MarcoValente published for his gold/silver spread script; however I have made some changes so this is usable for XAGUSD and utilizes my 'holy grail' method of basket weighting the USD (aka why the code is protected) for comparison against silver and I also made some visual enhancements like color changes, filled area of interest, and crossover markings.
One way this script can be thought of actually 'doing' is measuring the true strength of the USD against a basket vs silver. As the USD gains strength, the price per unit of silver should decrease; as the USD loses strength the price per unit of silver should increase.
The filled area is the difference between the spread and the slow MA; the marked crosses are the cross of the spread with the slow MA.
Feel free to PM me with questions etc. I find that this script is slow to load sometimes so if it doesn't immediately load try changing time frames a few times before returning to 15 min and if all else fails just wait it out haha
