MATA GOLD RATIOMata Gold Instrument: User Guide
The Instrument to Gold Oscillator is a technical analysis tool that normalizes the ratio of an instrument's price (e.g., BTC/USD) to the price of gold (XAU/USD) into a 0-100 scale. This provides a clear and intuitive way to evaluate the relative performance of an instrument compared to gold over a specified period.
---
How It Works
1. Calculation of the Ratio:
The ratio is calculated as:
\text{Ratio} = \frac{\text{Instrument Price}}{\text{Gold Price}}
2. Normalization:
The ratio is normalized using the highest and lowest values over a user-defined period (length), typically 14 periods:
\text{Normalized Ratio} = \frac{\text{Ratio} - \text{Min(Ratio)}}{\text{Max(Ratio)} - \text{Min(Ratio)}} \times 100
3. Overbought/Oversold Levels:
Above 80: The instrument is relatively expensive compared to gold (overbought).
Below 20: The instrument is relatively cheap compared to gold (oversold).
---
How to Use the Oscillator
1. Identify Overbought and Oversold Levels:
If the oscillator rises above 80, the instrument may be overvalued relative to gold. This could signal a potential reversal or correction.
If the oscillator falls below 20, the instrument may be undervalued relative to gold. This could signal a buying opportunity.
2. Track Trends:
Rising oscillator values indicate the instrument is gaining value relative to gold.
Falling oscillator values indicate the instrument is losing value relative to gold.
3. Crossing the Midline (50):
When the oscillator crosses above 50, the instrument's value is gaining strength relative to gold.
When it crosses below 50, the instrument is weakening relative to gold.
4. Combine with Other Indicators:
Use this oscillator alongside other technical indicators (e.g., RSI, MACD, STOCH) for more robust decision-making.
Confirm signals from the oscillator with price action or volume analysis.
---
Example Scenarios
1. Trading Cryptocurrencies Against Gold:
If BTC/USD's oscillator value is above 80, Bitcoin may be overvalued relative to gold. Consider reducing exposure or looking for short opportunities.
If BTC/USD's oscillator value is below 20, Bitcoin may be undervalued relative to gold. This could be a good time to accumulate.
2. Commodities vs. Gold:
Analyze the relative strength of commodities (e.g., oil, silver) against gold using the oscillator to identify periods of overperformance or underperformance.
---
Advantages of the Oscillator
Relative Performance Insight: Tracks the performance of an instrument relative to gold, providing a macro perspective.
Clear Visual Representation: The 0-100 scale makes it easy to identify overbought/oversold conditions and trend shifts.
Customizable Periods: The user-defined length allows flexibility in analyzing short- or long-term trends.
---
Limitations
Dependence on Gold: As the oscillator is based on gold prices, any external shocks to gold (e.g., geopolitical events) can influence its signals.
No Absolute Buy/Sell Signals: The oscillator should not be used in isolation but as part of a broader analysis strategy.
---
By using the Instrument to Gold Oscillator effectively, traders and investors can gain valuable insights into the relative valuation and performance of assets compared to gold, enabling more informed trading and investment decisions.
金屬

Fractal levels Gold [AstroHub]This indicator detects key fractal points on a price chart and visually marks them with shapes and levels. It helps traders identify potential reversal zones and dynamic support/resistance levels, enhancing market analysis.
Key Features:
Fractal Detection:
The indicator identifies top and bottom fractals using a 5-bar pattern.
A top fractal forms when the middle bar has a higher high compared to the two bars on either side.
A bottom fractal forms when the middle bar has a lower low compared to the two bars on either side.
Fractal Filtering:
The indicator can filter out "pristine" fractals (uninterrupted fractal patterns) based on custom conditions, making it more selective and reducing false signals.
Fractal Plotting:
are plotted as downward triangles.
are plotted as upward triangles.
Users can choose to display or hide fractal points and their corresponding labels.
Fractal Levels:
The indicator automatically plots fractals' levels on the chart, marking potential resistance and support zones.
Fractal levels change dynamically as new fractals are identified.
Customizable Display Options:
Show or hide fractals and levels with adjustable settings.
Choose whether to apply filtering for pristine fractals.
Display the pivot labels to easily track fractal positions.
How It Works:
The indicator uses a simple approach to recognize top and bottom fractals . When a valid fractal is detected, it highlights it on the chart and plots the corresponding price level.
By default, top fractals are shown above the bars (red color), and bottom fractals are shown below the bars (green color).
Fractal levels represent potential reversal points and can act as dynamic support and resistance zones.
Best Use:
The indicator is particularly useful in identifying reversal points and trend changes, helping traders to spot key price levels.
It can be used across various timeframes and markets, particularly for trend-following or reversal strategies.
Customizable Settings:
Show Pivots: Toggle the display of pivot points.
Show Pivot Labels: Display labels for pivot levels.
Show Fractals: Toggle fractal points on the chart.
Show Fractal Levels: Show or hide the levels corresponding to the detected fractals.
Filter for Pristine Fractals: Enable this option to filter out non-pristine fractals for higher accuracy.
Conclusion:
This indicator provides clear, actionable fractal signals, helping traders easily identify critical levels for entry and exit. With customizable settings and visual cues, it's suitable for both novice and expe

Marcel's Dynamic Profit / Loss Calculator for GoldOverview
This Dynamic Risk / Reward Tool for Gold is designed to help traders efficiently plan and manage their trades in the volatile gold market. This script provides a clear visualisation of trade levels (Entry, Stop Loss, Take Profit) while dynamically calculating potential profit and loss. It ensures gold traders can assess their positions with precision, saving time and improving risk management.
Key Features
1. Trade Level Visualisation:
Plots Entry (Blue), Stop Loss (Red), and Take Profit (Green) lines directly on the chart.
Helps you visualise and confirm trade setups quickly which is good for scalping and day trades.
2. Dynamic Risk and Reward Calculations:
Calculates potential profit and loss in real time based on user-defined inputs such as position size, leverage, and account equity.
Displays a summary panel showing risk/reward metrics directly on the chart.
3. Customisable Settings:
Allows you to adjust key parameters like account equity, position size, leverage, and specific price levels for Entry, Stop Loss, and Take Profit.
Defaults are dynamically generated for convenience but remain fully adjustable for flexibility.
How It Works
The script uses gold-specific conventions (e.g., 1 lot = 100 ounces, 1 pip = 0.01 price change) to calculate accurate risk and reward metrics.
It dynamically positions Stop Loss and Take Profit levels relative to the entry price, based on user-defined or default offsets.
A real-time summary panel is displayed in the bottom-right corner of the chart, showing:
Potential Profit: The monetary value if the Take Profit is hit.
Potential Lo
ss: The monetary value if the Stop Loss is hit.
How to Use It
1. Add the script to your chart on a gold trading pair (e.g., XAUUSD).
2. Input your:
Account equity.
Leverage.
Position size (in lots).
Desired En
try Price (default: current close price).
3. Adjust the Stop Loss and Take Profit levels to your strategy, or let the script use default offsets of:
500 pips below the Entry for Stop Loss.
1000 pips above the Entry for Take Profit.
4. Review the plotted levels and the summary panel to confirm your trade aligns with your risk/reward goals.
Why Use This Tool?
Clarity and Precision:
Provides clear trade visuals and financial metrics for confident decision-making.
Time-Saving:
Automates the calculations needed to evaluate trade risk and reward.
Improved Risk Management:
Ensures you never trade without knowing your exact potential loss and gain.
This script is particularly useful for both novice and experienced traders looking to enhance their risk management and trading discipline in the Gold market. Enjoy clearer trades at speed.

GOLD MonitorI'm using this platform from sometime and I carry out trading on Gold, using a kind of scalping strategy.
Scalping is not an easy task to do. Personally I found a lot of problems while detecting the trend direction.
So I decided to develop an indicator that is capable, in a discrete way, to give an instant-view on the market that is interesting.
This indicator can summarize in a small table all interesting figures related to gold scalping trading and is useful while joined with technical and fundamental analysis.
In this way it is possible to easy take under control all important aspects related to gold trading that I summarize here and you can find inside the table:
1) Gold / USD current direction
2) USD dollar strength (instant DXY) indicator take under consideration the DXY value every each tick and measures the increase or decrease in percentage. If there is a decrease the indicator displays a red low arrow, if there is an increase the indicator displays a green high arrow
also Gold friends are important so it is possible to find also:
3) NZDUSD (that is a Gold friend) variation percentage. If there is a decrease the indicator displays a red low arrow, if there is an increase the indicator displays a green high arrow
4) AUDUSD (that is a Gold friend) variation percentage. If there is a decrease the indicator displays a red low arrow, if there is an increase the indicator displays a green high arrow
then it is possible to find DXY USD dollar strength calculated between previous period (e.g. in timeframe M5 last 5 minutes) and current period (current 5 minutes). This indication is represented by an high arrow if there has been an increase, or by an low arrow if there has been a decrease.
Last but not least the information about the Gold trend itself with the possible forecast for the current period. This information must be carefully interpreted together with other instruments for technical analysis like Fibonacci lines.

Bitcoin to GOLD [presentTrading]**Introduction and How it is Different**
Unlike traditional indicators, the BTGR offers a unique perspective on market sentiment and asset valuation by juxtaposing two seemingly disparate assets: Bitcoin, the digital gold, and Gold, the traditional store of value. This article introduces an advanced version of this ratio, complete with upper and lower bands calculated using standard deviations. These bands add an extra layer of analytical depth, allowing for more nuanced trading strategies.
BTCUSD 12h bigger picture
**Economic Principles**
The BTGR is rooted in the economic principles of asset valuation and market sentiment. Gold has long been considered a safe haven asset, a place where investors park their money during times of economic uncertainty. Bitcoin, on the other hand, is often viewed as a high-risk, high-reward investment. By comparing the two, the BTGR provides insights into the broader market sentiment.
- Risk Appetite: A high BTGR indicates a bullish sentiment towards riskier assets like Bitcoin.
- Market Uncertainty: A low BTGR suggests a bearish sentiment and a flight to the safety of Gold.
- Asset Diversification: The BTGR can be used as a tool for portfolio diversification, helping investors balance risk and reward.
**How to Use It**
Setting Up the Indicator
- Platform: The indicator is designed for use on TradingView.
- Time Frame: A 480-minute time frame is recommended for more accurate signals.
- Parameters: The moving average is set at 200 periods, and the standard deviation is calculated over the same period.
**Trading Signal**
Long Entry: Consider going long when the BTGR crosses above the upper band.
Short Entry: Consider going short when the BTGR crosses below the lower band.
Note: Due to the issue that the number of trading is less than about 100 times, the corresponding strategy is not allowed to publish.

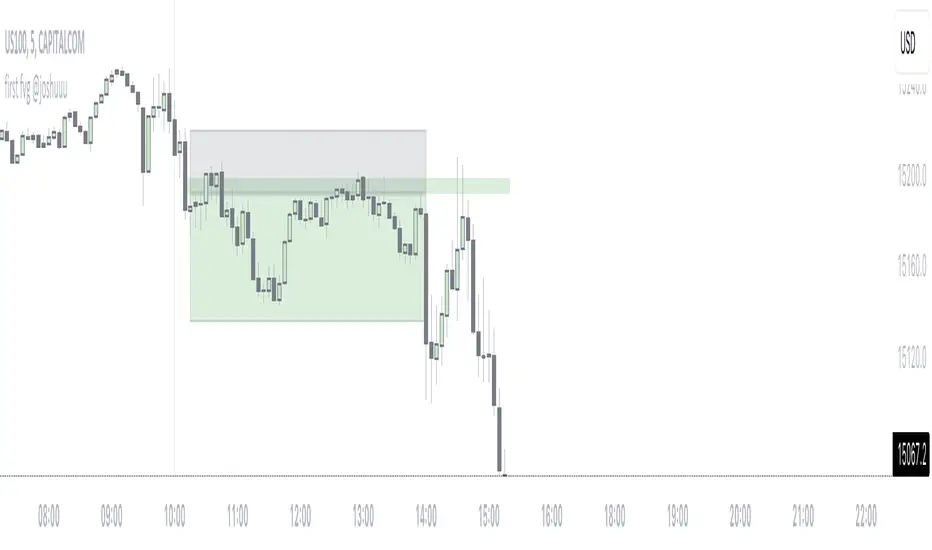
first fvg @joshuuuThis indicator was created to display and alert the user for the first Fair Value Gap (FVG) of up to three trading sessions.
Bullish FVG occurs when the high of the first candle is lower than the low of the third candle, resulting in a price gap between them.
Conversely, a Bearish FVG takes place when the low of the first candle is higher than the high of the third candle, leading to a gap between these prices.
ICT emphasizes on three crucial timeframes: 3-4 am NY, 10-11 am NY, and 2-3 pm NY, collectively referred to as the 'silver bullet' times. The very first FVG formed during these periods can significantly impact the remainder of that trading session.
Building upon these concepts, CasperSMC developed a strategy involving buying/selling the very first FVG and placing a stop order just above/below the candle responsible for creating the FVG.
The strategy aims for a consistent 2-to-1 Reward-to-Risk ratio (2RR).
This indicator serves to support the strategy by not only displaying those fvgs but also sending alerts, reducing the need for constant screen monitoring.
Correlation Coefficient - DXY & XAUPublishing my first indicator on TradingView. Essentially a modification of the Correlation Coefficient indicator, that displays a 2 ticker symbols' correlation coefficient vs, the chart presently loaded.. You can modify the symbols, but the default uses DXY and XAU, which have been displaying strong negative correlation.
As with the built-in CC (Correlation Coefficient) indicator, readings are taken the same way:
Positive Correlation = anything above 0 | stronger as it moves up towards 1 | weaker as it moves back down towards 0
Negative Correlation = anything below 0 | stronger moving down towards -1 | weaker moving back up towards 0
This is primarily created to work with the Bitcoin weekly chart, for comparing DXY and Gold (XAU) price correlations (in advance, when possible). If you change the chart timeframe to something other than weekly, consider playing with the Length input, which is set to 35 by default where I think it best represents correlations with Bitcoin's weekly timeframe for DXY and Gold.
The intention is that you might be able to determine future direction of Bitcoin based on positive or negative correlations of Gold and/or the US Dollar Index. DXY has been making peaks and valleys prior to Bitcoin since after March 2020 black swan event, where it peaked just after instead. In the future, it may flip over again and Bitcoin may hit major highs or lows prior to DXY, again. So, keep an eye on the charts for all 3, as well as the indicator correlations.
Currently, we've moved back into negative correlation between Bitcoin and DXY, and positive correlation with Bitcoin and Gold:
Negative Correlation b/w Bitcoin and DXY - if DXY moves up, Bitcoin likely moves down, or if DXY moves down, Bitcoin likely moves up (or if Bitcoin were to move first before DXY, as it did on March 2020, instead)
Positive Correlation b/w Bitcoin and Gold - Bitcoin and Gold will likely move up or down with each other.
DXY is represented by the green histogram and label, Gold is represented by the yellow histogram and label. Again, you can modify the tickers you want to check against, and you can modify the colors for their histograms / labels.
The inspiration from came from noticing areas of same date or delayed negative correlation between Bitcoin and DXY, here is one of my most recent posts about that:
Please let me know if you have any questions, or would like to see updates to the indicator to make it easier to use or add more useful features to it.
I hope this becomes useful to you in some way. Thank you for your support!
Cheers,
dudebruhwhoa :)

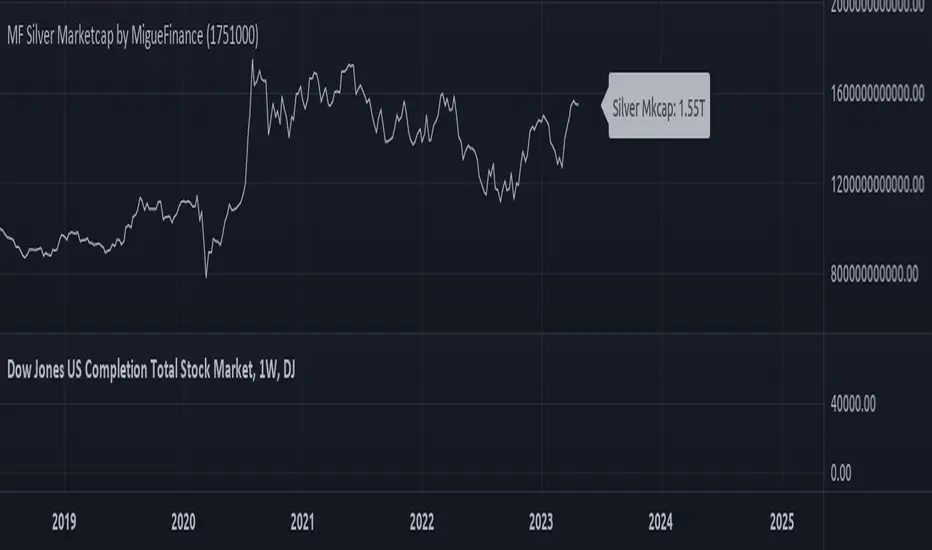
MF Total Silver Market Capitalization by MigueFinanceThis is the Current Market Capitalization and Historical Chart of Silver
There might be discrepancies in the future on the current market capitalization of silver due to the number of silver ever mined which is always increasing.
So as to update it when necessary, one of the sites you can check to get the most up to date amount is: "https://companiesmarketcap.com/silver/marketcap/" and then edit the amount of tonnes on the settings of this indicator.
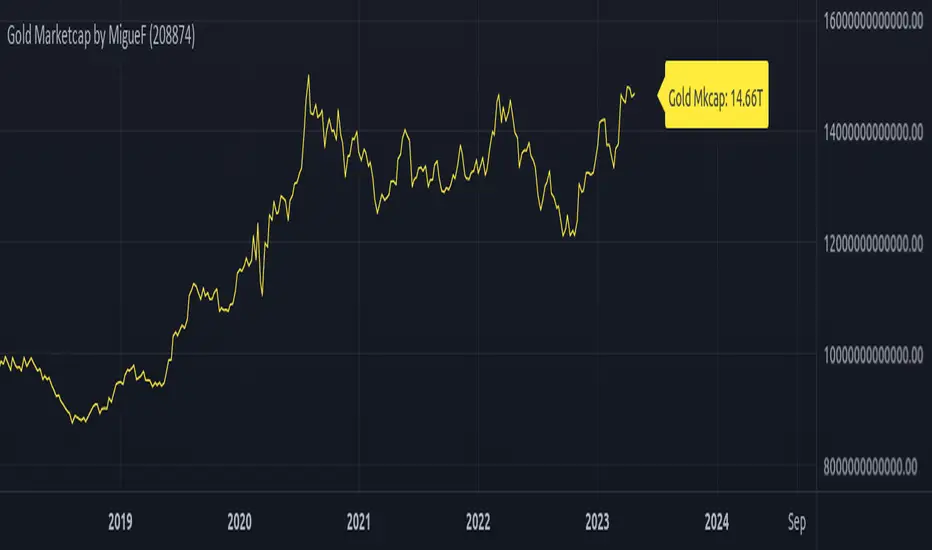
Total Gold Market Capitalization by MigueFinanceThis is the Current Market Capitalization and Historical Chart of Gold
There might be discrepancies in the future in the current market cap of gold due to the number of gold ever mined which is always increasing, so as to update it when necessary, you can go and check the site: "https://www.gold.org/goldhub/data/how-much-gold" and edit the amount of tonnes on the settings of this indicator
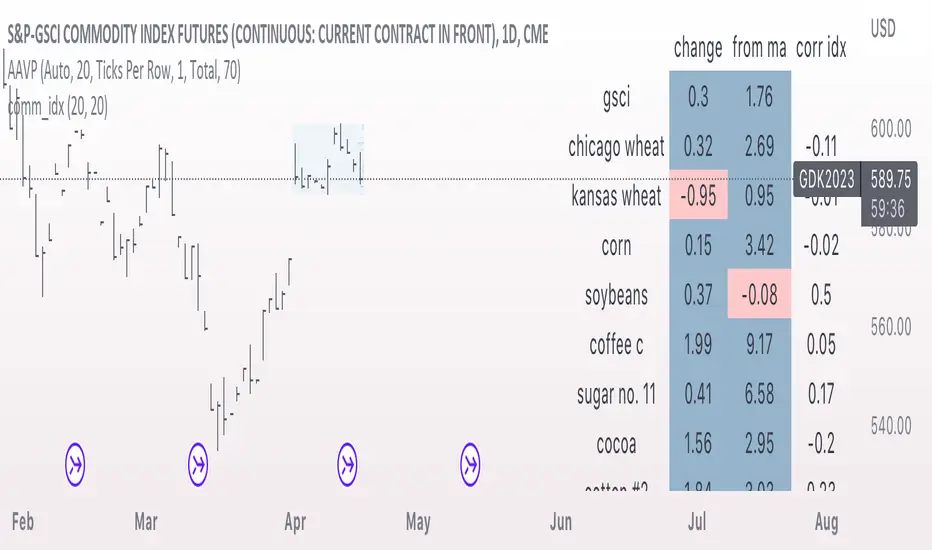
comm_idxThis script displays information about the components of the Goldman Sachs Commodity Index. The index is based on futures contracts in the categories of agricultural products, softs commodities, livestock, energies, industrial metals, and precious metals. The statistics displayed in the table are:
change: 1-day % change
from ma: the % change from a moving average
corr idx: correlation of the contract to the GSCI
The lengths for the moving average and correlation statistic can be set using the inputs.
See the script source for the symbols used for each commodity. Although most of the symbols correspond to the actual futures contract used to compute the index, LME contracts are not available on tradingview. Hence, corresponding HKEX contracts are used for the industrial metals.
Market Relative Candle Ratio ComparatorIntroducing the Market Relative Candle Ratio Comparator, a visually captivating script that eases the way you compare two financial assets, such as cryptocurrencies and market indices. Leveraging a distinctive calculation method based on percentage changes and their averages, this tool presents a crystal-clear view of how your chosen assets perform in relation to each other, both for individual candles and over a range of previous candles.
Tailoring the script to your preferences is a walk in the park, as it allows you to easily adjust input symbols, moving average lengths, and other parameters to match your analytical approach. The visually arresting column chart it creates employs vivid red and green colors to underscore the differences between the two assets on each candle. Simultaneously, the lower-opacity columns depict the accumulated differences over a specified lookback period. This vibrant blend of colors and opacities results in a dynamic visual experience, enabling you to better grasp market trends relative to each other.
The reverse bool input is a handy feature that lets you invert the effect of the input symbol (DXY by default) in the comparison. When you set the reverse input to true, the script multiplies the calculated DXY percentage change by -1, effectively reversing the comparison. This is particularly useful when examining assets with an inverse relationship or when you'd like to analyze the input symbol's impact in the opposite direction.
For instance, if the input symbol represents a market index that generally moves in the opposite direction of the selected cryptocurrency, enabling the reverse input will help you better visualize and understand the relationship between the two assets by inverting the input symbol's effect on the comparison.
In the accompanying chart, you can observe the comparison of Bitcoin's movement relative to the Dollar, Gold, Bonds, and the S&P 500. The indicator reveals that in the last day, Bitcoin outperformed Bonds, Gold, and the Dollar but not the S&P 500!

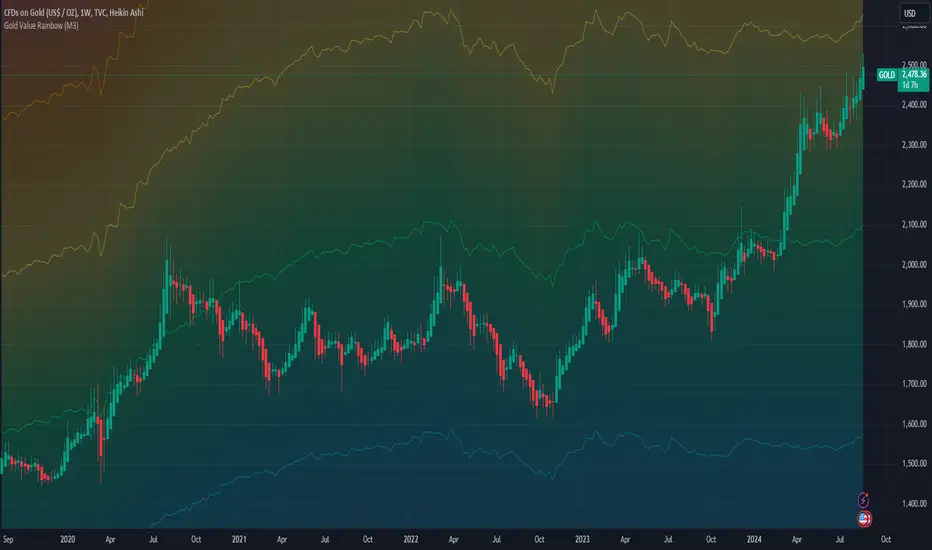
Gold Value RainbowThis indicator can only be used with 'GOLD' ticker. It is used to estimate Gold valuation based on major countries base money supply M0 such as US, EU, JP and CN. These 4 countries represent nearly 75% of total global money supply in the world. The chart will compare how gold value will move alongside with base money supply for comparison study. The chart presented here is just a relative comparison with some scaling and shifting so it doesn't refers to any real measurement. However it can be used to track gold price whether it's too cheap or too expensive in relative to money supply available in the market.
- The gray line represent major countries money supply M0
- The rainbow above the gray line represent the multiplication factors from 1x, 2x, ..., 10x
- The rainbow below the gray line represent the division factors from 0.8x, 0.6x, ..., 0.2x
Check other script to value stock and index:
- Stock Value Rainbow: script to value stock based on book value, earning, dividend and cash flow
- Index Value Rainbow: script to value index based on fed balance sheet and base money supply
- Gold Value Rainbow: script to value gold based on global money supply
- Stock Value US: script to check US stock value
- Stock Value EU: script to check EU stock value
- Stock Value JP: script to check JP stock value
- Stock Value CN: script to check CN stock value
Recession Warning Traffic LightThis is an indicator that uses 6 different metrics to determine the combined probability of a recession and compares the high probability warning periods against actual historical periods of recession.
GREEN tells us that the referenced recession indicators are not exhibiting any warning. Observe the long stretches of “all-green” in between recessionary periods in the chart above.
RED will show a full-on warning level for that particular recession indicator, signaling that monitoring of this sector is clearly showing a problem – which has in the past, reliably exhibited itself as a forewarning of recessions.
Adding green and red together can help determine a combined probability of recession.
IMPORTANT: Your chart should be on 1d and set to SPX , DJI ,or NDQ indices
Precious metals: This indicator calculates the relative prices of Gold & rhodium. Gold is a flight-to-quality asset. Rhodium is the rarest of precious industrial metals and prices spike when the economy is heating up. In front of a recession, the upper relative movement of rhodium precedes gold.
Stock markets: This indicator compares closing prices to growth rate curves of the SPX. This indication is the noisiest but tells us very well when the recession has ended. Stock market indices, which respond to “smart money” moving out of markets when the other indicators begin to warn of recession, or when markets become overheated and rise to historically unsustainable levels.
Yield curve: This indicator compares the 3m & 10y treasuries and detects yield curve inversions. Interest rates are controlled by the Federal Reserve and by the purchasers in the Federal Treasury auction markets, which together create the treasury yield curve. This inversion is the most reliable recession indicator. These happen during a flight to quality.
Federal Reserve: This indicator measures GDP and detects contraction which is technically a recession. This is usually one of the last indicators to enter a Warning state, and it could be 6 months delayed simply confirming what may have already been projected.
Money Supply. This indicator measures the M2 money supply, which typically grows about 1% per calendar quarter. When this shrinks, it's tapping the brakes on the economy. This can also lead to yield curve inversion. This is also a measure of inflation and its effects on the aggregate money supply (liquid capital) available for short-term economic activity, or which can be directed into the purchase of long-term, less liquid assets.
Leading Economic factors: There is a whole basket of leading economic indicators that, as collections, reflect overall growth or contraction of economic activity. These indicators include measures of level and growth in productivity, employment, housing, consumer confidence, industrial purchasing confidence, and much more. These indicators may or may not be detached from the broader economy, and often provide up to 6 months of foresight. For more information please visit www.conference-board.org
Actual Recession: Central Bank indicators are published by the Federal Reserve and reflect their own analysis of national and regional economic health, as well as their calculations of the likelihood of a recession. The Federal Reserve has a recession ticker which is used to plot periods of actual recessions on this indicator for comparison.

SFC Smart Money BenchmarkA benchmark is a standard or point of reference, which traders can use to measure something else.
This indicator is showing how correlated pairs are performing and what is the current correlation between them.
Features:
- Market performance - daily, weekly, monthly
- Sigma - volatility . It will be coloured in red, if the volatility is bigger than one standard deviation.
-Correlation - Positive correlation will be coloured in green if it is confirmed by the P-value, negative correlation in red.
-Confidence intervals
-Determination
Markets:
- Metal sector
- US Stock Indices
- Major USD Pairs
Market performance
The indicator is plotting a table with the current performance of the particular group, for example the metal sector and all correlated Gold pairs. The table is showing the performance of the pairs based on monthly, weekly and daily bases in the same time. In this case the trader can track all pairs simultaneously and see if there are anomalies between the pairs - SMT Divergence.
For example:
We know that Gold and Silver are very strong correlated pairs. In this case if Gold is going up, but Silver not, probably this move is only current manipulation and the true move is not clear. In that moment the trader can decide not to open an order or take some profit.
With the Sigma value traders also can track the current volatility of the price. The strength of the volatility is measured by the standard deviation.
-1>Sigma<1 - The asset is moving normally
-2>Sigma<-1 or 21 - The asset is volatile
-3>Sigma<-2 or 32 - The asset is very volatile
Correlation
The indicator is showing the current correlation between all pair from the table. The correlation is set to the first pair of the table. In order to make the correlation more accurate the indicator calculates the P-value and the Determination coefficient. The confidence intervals are also displayed in order to show how strong correlation should be expected.
Pearson correlation is a measure of linear correlation between two sets of data. It is the ratio between the covariance of two variables and the product of their standard deviations; thus, it is essentially a normalized measurement of the covariance, such that the result always has a value between −1 and 1. As with covariance itself, the measure can only reflect a linear correlation of variables, and ignores many other types of relationships or correlations.
P-value evaluates how well your data rejects the null hypothesis, which states that there is no relationship between two compared groups. Successfully rejecting this hypothesis tells you that your results may be statistically significant. In academic research, p-value is defined as the probability of obtaining results ‘as extreme’ or ‘more extreme’, given that the null hypothesis is true — essentially, how likely it is that you would receive the results (or more dramatic results) you did assuming that there is no correlation or relationship (e.g. the thing that you’re testing) among the subjects
Coefficient of Determination is just the square of pearson’s correlation coefficient R. This is done as it is easier to explain linear regression in terms of R² than R. As R ranges from -1 to 1, R² would range from 0 to 1 — clearly explaining relationship with 0 being not related and 1 being perfectly related.
The correlation confidence interval is the range in which the population correlation is most likely to be found.
The degree of certainty for which it is likely to be within that range is called the confidence level.
When you collect sample data, you can not know the exact value of the correlation.
Note:
For the Stock indices there is an extra calculation, showing the current market expectations - Fear and Greed Index. The calculated index could differs a bit from the original CNN Fear and Greed indicator, because they calculate the index based on Future markets. This indicator calculate the index based on the market that we trade - indices.
Supported pairs:
-Option Gold - XAUUSD , GDX , Silver , Aluminum, Platinum , Palladium, 30Y US Yields, 10Y US Yields, 2Y US Yields, XAUEUR, XAUGBP, XAUAUD , XAUCAD , XAUCNY , XAUJPY
-Option Others - Table1: SP500 , US30, NAS100 ; Table2: DXY , EURUSD , GBPUSD , AUDUSD

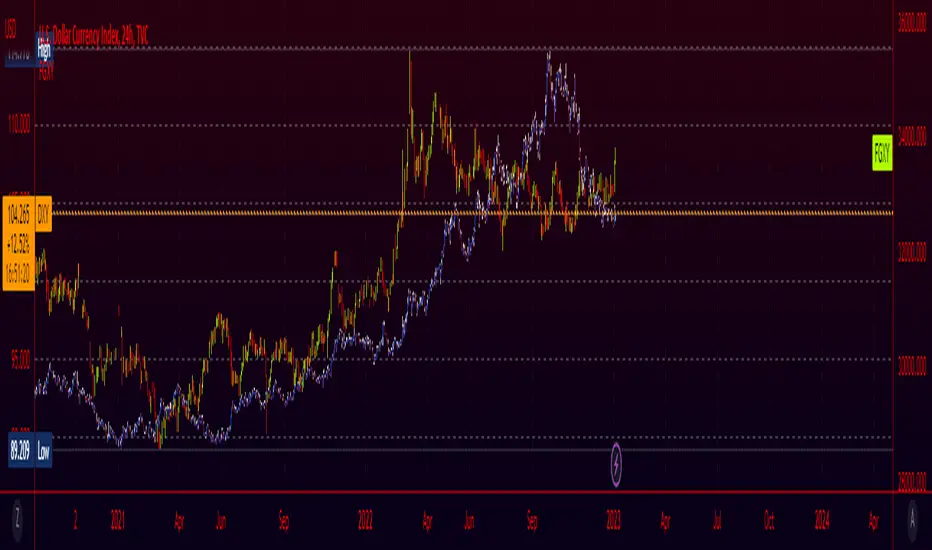
Fiat Currency and Gold Indices (FGXY) CandlesA modification of my previous indicator "Crypto Index (DXY) Candles". The idea was to create a similar currency basket to the standard DXY, but from the perspective of other currencies. Still using the standard DXY weights, this indicator allows you to create a tailored index for other currencies, provided that a currency pair exists for each of the 6 components. This means that even currencies that aren't included should work in theory; just find the 3 character currency prefix used by tradingview and give it a shot! This indicator is useful for gauging how well countries/currencies are holding up and when paired with the standard DXY may help see potential inflection points. For use on longer time frames (~1h-~3d) as some of the data being pulled seems to have issues on lower timeframes.
The Price of Hard MoneyIf we calculate “the price of hard money” (the market capitalization weighted price of gold plus Bitcoin); we get this chart.
Since 2017, Bitcoin’s share of hard money growth has been increasing, we can see it visibly on the gold chart by a widening delta between the price of hard money and the Gold price. We can also see some interesting technical behaviours.
In 2021, Hard Money broke out and held this breakout above the 2011 Gold high. Only later in 2022 did a correction of 20% occur – typical of Golds historic volatility in periods of inflation and high interest rates.
Hard Money is at major support and we have evidence for a fundamental shift in investor capital flows away from gold and into Bitcoin.
This Indicator is useful:
- To track the market capitalization of Gold (estimated), Bitcoin and combined market capitalization of Hard Money.
- To track the price action and respective change in investor flows from Gold to Bitcoin .
Provided Bitcoin continues to suck more value out of gold with time, this chart will be useful for tracking price action of the combined asset classes into the years to come.

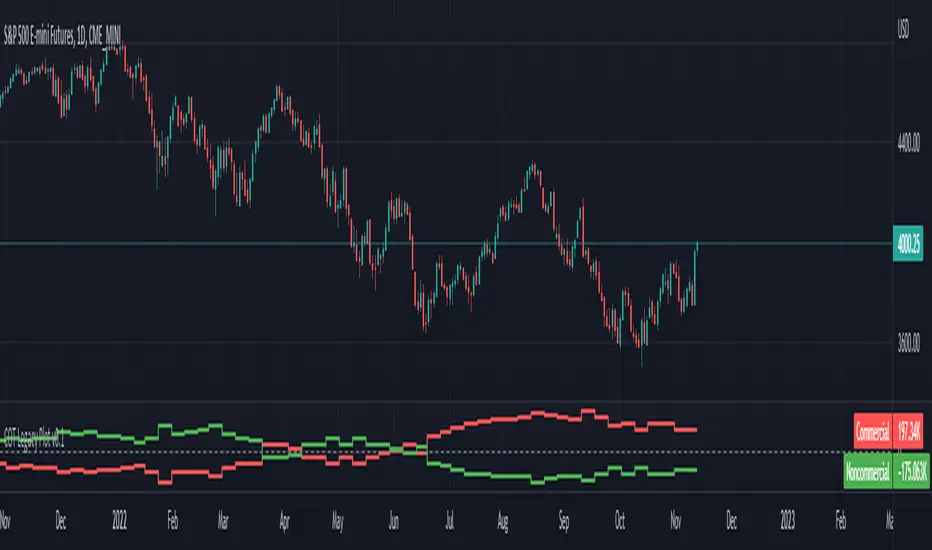
ILM CFTC COT Legacy PlotUse this indicator on Daily Timeframe
Please refer to the below link for CFTC Disaggregated COT
www.cftc.gov
This script is very similar to COT Financial Plot indicator except that it plots the data for Futures in Legacy buckets Commercial vs. Non-Commercial
In Chart Currency TickersQuick View of Multiple Currencies & Gold Price on Chart
In Chart Currency Tickers will help quick view of Multiple Currencies (Up/Down points & Percentage), you can change symbols on settings as per your requirement
മെയിൻ കറൻസികളും സ്വർണവിലയും റിയൽ ടൈം മോണിറ്റർ ചെയ്യുന്നതിനും മാർക്കറ്റ് സെന്റിമെൻറ് അറിയുന്നതിനും അതിനനുസരിച്ച് ട്രേഡിങ്ങ് ഡിസിഷൻ എടുക്കുന്നതിനും നിങ്ങളെ സഹായിക്കുന്നു
Happy Trading to All..!!!
Asif Kerim Naduvilaparambil

Money Supply Index (MSI) by zdmreThe primary objective of the states monetary policy is to maintain price stability with sustainable maximum economic growth. In anticipation of higher inflation , the Central Banks raise short-term interest rate thereby to reduce money supply. Conversely, the Central Banks reduce short-term interest rate to inject additional money into the economy in apprehension of unleashing recessionary forces. The stock markets usually respond negatively to interest rate increases and positively to interest rate decreases. The linkages between money market and stock market a wealth effect due to a change in money supply disturbs the equilibrium in the portfolio of investors.
This index indicates the long-run and short-run dynamic effects of broad money supply (M2) on U.S. stock market (this symbol is optional (Bitcoin, Gold or Oil or other markets etc.)).
#DYOR

Sovereign Gold Hodlers Script for comparing nations and their gold, with options including:
Default Comparing the Price of Gold
Use Relative Valuations price / prior price
Measure Reserves/Price
GDP/Gold Price
GDP/Gold Reserves
Given the state of the world I thought it'd be good do see where countries stand, how much real money they hold. I think gold is going to play an increased role in trade between economies in the near future.

CHN BUY SELLCHN BUY SELL is formed from two RSI indicators, those are RSI 14 and RSI 7 . I use RSI 14 to determine the trend and RSI 7 to find entry points.
+ Long (BUY) Signal:
- RSI 14 will give a "BUY" signal, then RSI 7 will give entry point to LONG when the candle turns yellow.
+ Short (SELL) Signal:
- RSI 14 will give a "EXIT" signal, then RSI 7 will give entry point to SHORT when the candle turns purple.
+ About Take Profit and Stop Loss:
- With Gold, I usually set Stop Loss and Take Profit at 50 pips
- With currency pairs, I usually keep my Stop Loss and Take Profit at 30 pips
- With crypto, I usually keep Stop Loss and Take Profit at 1.5%
Recommended to use in time frame M15 and above .
This method can be used to trade Forex, Gold and Crypto.
My idea is formed on the view that when the price is moving strongly, the RSI 14 will tell us what the current trend is through a "BUY" or "EXIT" signal. When RSI 14 reaches the oversold area it will form a "BUY" signal and when it reaches the overbought area it will give an "EXIT" signal. I believe that when the price reaches the oversold or overbought area, the price momentum has also decreased and is about to reverse.
After receiving a signal from RSI 14, my job is to wait for an Entry signal from RSI 7. When RSI 7 reaches the overbought area, a yellow candle will appear and that's when we enter a LONG order. When the RSI 7 reaches the oversold area, a purple candle will appear and that's when we enter a SHORT order.

Metals:Backwardation/ContangoMETALS: Gold , Silver , Copper ( GC , SI, HG)
Quickly visualize carrying charge market vs backwardized market by comparing the price of the next 2 years of futures contracts.
Carrying charge (contract prices increasing into the future) = normal, representing the costs of carrying/storage of a commodity. When this is flipped to Backwardation (contract prices decreasing into the future): its a bullish sign: Buyers want this commodity, and they want it NOW.
Note: indicator does not map to time axis in the same way as price; it simply plots the progression of contract months out into the future; left to right; so timeframe DOESN'T MATTER for this plot
There's likely some more efficient way to write this; e.g. when plotting for Gold ( GC ); 21 of the security requests are redundant; but they are still made; and can make this slower to load
TO UPDATE(once a year will do): in REQUEST CONTRACTS section, delete old contracts (top) and add new ones (bottom). Then in PLOTTING section, Delete old contract labels (bottom); add new contract labels (top); adjust the X in 'bar_index-(X+_historical)' numbers accordingly
This is one of three similar indicators: Meats | Metals | Grains
-If you want to build from this; to work on other commodities ; be aware that Tradingview limits the number of contract calls to 40 (hence the 3 seperate indicators)
Tips:
-Right click and reset chart if you can't see the plot; or if you have trouble with the scaling.
-Right click and add to new scale if you prefer this not to overlay directly on price. Or move to new pane below.
--Added historical input: input days back in time; to see the historical shape of the Futures curve via selecting 'days back' snapshot
updated 15th June 2022
© twingall

MACD Scalper AnalysisThis is a scalper analysis movement designed around MACD and 200 EMA
The rules are simple:
For long we check if the close of the candle is above the ema200 and we have a crossover between macd and signal
Once this happens we analyse the next candle, if its close higher than open , we can consider it a win and if its close lower than open we consider a lose.
For short we check if the close of the candle is below the ema200 and we have a crossunder between macd and signal
Once this happens we analyse the next candle, if its close higher than open , we can consider it a loss and if its close lower than open we consider a win.
Once we have all of this we analyse the average percentage movement and establish if the specific asset or timeframe is worthy for us.
At the same time it can give a good idea if we can go with a divergence strategy, like for example we have a short entry, but we will actually go long and viceversa.
If you have any questions let me know !
