Simple RSI-MA Algo Beats DOW By Huge Margin Over Past 100 Years!This simple RSI-MA long/short algorithm beats the Dow by a FREAKING HUGE margin over the past century (excluding dividends and trading costs).
The algorithm uses a fast SMA of the RSI as a buy/cover signal and a slow SMA of the RSI as a sell/short signal.
Backtest period = 09/17/1916 - 11/02/2015
Dow = 98 --> 17,830 = +18,094% = 5.38% CAGR
Algorithm = net profit + open P/L = +43,349% = 6.31% CAGR
Notice how the algorithm dodged both the 30s' Great Depression and the 2008 Crisis. Pretty cool huh? :)
ALGORITHM'S FORMULA (use weekly chart):
Buy/Cover = MA10(RSI10) cross> 50
Sell/Short = MA50(RSI10) cross< 50
STRATEGY TESTER'S SETTINGS:
- Initial cash = $10,000
- Pyramiding disabled
- Re-investment enabled (order size = 100% of equity )
- Trade re-calculations disabled
DISCLAIMER: None of my ideas and posts are investment advice. Past performance is not an indication of future results. This strategy was constructed with the benefit of hindsight and its future performance cannot be guaranteed.
動量指標(MOM)


Romi Trend and Momentum Oscillator
Great oscillator which determines trend and momentum. So accurate it could be used as a stand alone indicator.


Jinqian168_V2RSI, EMA of RSI, EMA of RSI's EMA, and Stochastic.
V2 added Price Bar Coloring. Buy when Orange or Green, Sell when Yellow or Red.

Zweig Market Breadth Thrust Indicator [LazyBear]The Breadth Thrust (BT) indicator is a market momentum indicator developed by Dr. Martin Zweig. According to Dr. Zweig a Breadth Thrust occurs when, during a 10-day period, the Breadth Thrust indicator rises from below 40 percent to above 61.5 percent.
A "Thrust" indicates that the stock market has rapidly changed from an oversold condition to one of strength, but has not yet become overbought. This is very rare and has happened only a few times. Dr. Zweig also points out that most bull markets begin with a Breadth Thrust.
All parameters are configurable. You can draw BT for NYSE, NASDAQ, AMEX or based on combined data (i.e., AMEX+NYSE+NASD). There is also a "CUSTOM" mode supported, so you can enter your own ADV/DEC symbols.
More info:
Definition: www.investopedia.com
A Breadth Thrust Signal: www.mcoscillator.com
A Rare "Zweig" Buy Signal: www.moneyshow.com
Zweig Breadth Thrust: recessionalert.com
List of my public indicators: bit.ly
List of my app-store indicators: blog.tradingview.com

JMA RSX Clone [LazyBear]RSX is a "noise free" version of RSI, with no added lag. This is a port of a clone to Pine.
Use this indicator just like RSI. I have set the default length to 14, feel free to experiment. You can reduce length with out worrying about jaggedness.
Options page has all the configurable parameters. You can use the plot names to setup alerts.
I have couple of more indicators built using this, will post them later. Let me know what you think about this indicator.
RSX Clone compared to normal RSI:
Smoothness helps a lot in identifying the divergences correctly:
More info:
www.jurikres.com
List of my public indicators: bit.ly
List of my app-store indicators: blog.tradingview.com

Momentum of Relative strength to Index Leaf_West styleMomentum of Relative Strength to index as used by Leaf_West. This is to be used with the companion Relative Strength to Index indicator Leaf_West Style. Make sure you use the same index for comparison. If you follow his methods be aware of the different moving averages for the different time periods. From Leaf_West: "on my weekly and monthly R/S charts, I include a 13 EMA of the R/S (brown dash line) and an 8 SMA of the 13 EMA (pink solid line). The indicator on the bottom of the weekly/monthly charts is an 8 period momentum indicator of the R/S line. The red horizontal line is drawn at the zero line.
For daily or 130-minute time periods (or shorter), my R/S charts are slightly different - the moving averages of the R/S line include a 20EMA (brown dash line), a 50 EMA (blue dash line) and an 8 SMA of the20 EMA (pink solid line). The momentum indicator is also slightly different from the weekly/monthly charts – here I use a 12 period calculation (vs 8 SMA period for the weekly/monthly charts)." Leaf's methods do evolve and so watch for any changes to the preferred MAs etc..

[RS][JR]RSI Momentum V1RSI Momentum
By Ricardo Santos and JR
This system is a clash of two indicators, Momentum and RSI. Strength of signals are viewed by both height and color. Dark Green or Light Red bars signal strong momentum. Light Red bar signals and Green bar signals reach an apex at the top of the indicator pane.

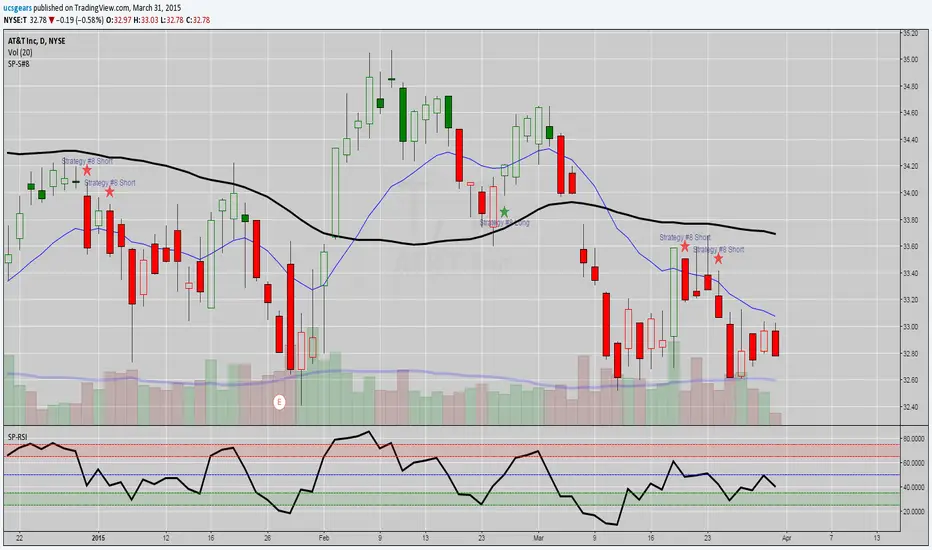
UCS_S_Steve Primo - Strategy #8Hello Fellas,
Hope you are trading fantastic and fine. Here is another setup from Steve Primo (Stocks) Setups. He claims this can be applied on any market, and you can. Primarily focused on Stocks and Futures market.
NOTE : I DID CODE THE BOTTOM INDICATOR, NOT PUBLISHING IT, ITS JUST RSI(5)
What did I change, ofcourse I don't publish what I find, There is a bit of me in the codes.....
1. Setup only shows up at meaningful levels, Stringent Filter
Myself and tradearcher will keep this upto date. As he has volenteered to help with the track record of steve primo strategies.
docs.google.com
This is more like catching a freight train after a mini pullback.
AGAIN, This is not a holy grail, but this fits my personality of trading, Buying pullbacks on stronger stocks. Because it is harder to get a UCS_momo_Oscillator to signal a setup, primarily because of the smoothing, you can use this as an alternative to catch the excitement trade.
Do not sit on it for more than T+4 days, Unless another setup triggered in your way.
Rule - Buy/Sell the candle breakout next day after the setup - in the direction it is setting up
- Close the Position @ 100% candle extension or RSI Oversold.
UCS_Murrey's Math Oscillator_V2Hello, Murrey Math lovers, Thanks for those who showed interest on this. Based on a request, I have updated the plot / candle coloring, for Version - 2.
This has been in the queue for a while.
There was a Glitch found with the Multiplier. Will Fix in the next version. The Current Version (and the previous version) only supports 1/8 fractions. Will not support 0.25. The code needs to be updated, to automate the fractal line glitches for other ratios, Planned for future update.
Good Luck and Enjoy the Colorful Oscillator. Please keep your suggestions flowing. Lets make it better.

Mirrored MACD [LazyBear]This is a famous indicator I have seen used by many Forex traders in MT4 platform. This indicator uses the difference between EMA of "close" and EMA of "open" to form the oscillator lines (not just a convergence/divergence calculation between EMA of "close")
Current market state is determined by which histogram is above zero line. For more confirmation, wait for it to cross above Signal line too. Crossing down the signal or zeroline should be the exit condition. Also, look for divergences.
Use plot labels BullHisto/BearHisto/BearLine/BullLine/ZeroLine/Signal for setting up alerts.
Complete list of my indicators:
-----------------------------
docs.google.com