BTC Halving [YinYangAlgorithms]This Indicator not only estimates what it thinks may be the PRICE for the Start, High and Low of the Halving, but likewise estimates WHEN the Start, High and Low of Halving may be. It then creates Trend Lines based on these predictions so that you may get an evaluation towards if the Price is currently Overbought or Oversold. These Trend Lines may be very useful for seeing the Slope in which the Price may move if it is to reach the estimated Price by the estimated Date. By evaluating the Prices location based on these Trend Lines we may determine if the Price is currently Overbought or Oversold.
These Trend Lines likewise may help identify locations of Support and Resistance. If the Price is much higher than its current Trend Line it is Overbought. There is a chance it will Consolidate back to the Trend Line or it may even correct with a dump all the way back to it; the opposite is true if it is much lower than its current Trend Line.
Trend Lines and Estimates are not all that is featured within this Indicator however. There are also Price Zones which may help identify if the price is currently:
Very Overbought (Red)
Slightly Overbought (Orange)
Neutral (Yellow)
Slightly Oversold (Teal)
Very Oversold (Green)
These zones may help give you an idea of how the price is currently fairing and its potential for movement. Likewise, it may help define where Support and Resistance may be found.
The trend line estimates are done with an algorithm created to evaluate the difference between price and % change that has occurred between the Start, High and Low of all the halvings over how many days between each data type. This may allow us to make an educated estimate towards what Price and Date the Start, High and Low will occur at.
Our Zones are created by evaluating the current Market Cap and circulating supply vs Max Supply of BTC. This may help give us an evaluation of what Price may be considered to be Overbought and Oversold; and likewise may help with estimations of where there may be Support and Resistance based on these Zones.
Tutorial:
In the example above we’re displaying the Halving Start Trend Line, our Information Tables and our Estimated Halving Vertical Marker. This Trend Line may help to display not only the trajectory and slope the Price needs to take to reach the Estimated Halving Price by the Estimated Halving Date; but it may also help to show if the price is Overvalued or Undervalued based on its position above or below this Trend Line.
Based on the Trajectory of the Estimated High Upward Trend Line (Green Line) in the photo above and from the ‘High Date’ estimated in the Information tables; we may attempt to estimate the location the ATH of this Bull Market will create and the price slope it may follow in doing so. This Trajectory may be very useful for understanding the price action that may occur for it to reach the High estimated Price by the High estimated Date.
We currently allow for two different types of zones within our Settings, one called ‘Fast’ displayed in the example above; and the other called ‘Slow’ displayed in the example below.
Our Fast Zone aims to move the Zone Levels Faster in an attempt to move with volatility and parabolic movement. This may help to keep the Very Overbought (Red) and Very OverSold (Green) Levels more accurate by attempting to keep the price within them. By doing so, we may aim to keep all of the Slightly Overbought, Slightly Oversold and Neutral Levels more accurate as well.
The Levels within these zones are defined by the Bright (less transparent) Lines. Whereas the Darker (more transparent) lines represent the Basis Lines between two different levels. These Basis lines may likewise act as a Support and Resistance Location too, but generally hold less weight than the actual Levels themselves.
What you may see is that during the Bull Market, the price is within the very Overbought Zones and even touches again the Very Overbought Level a few times. Likewise, during the Bear Market, the price is within the very Oversold Zones and even slightly drops below the Very Oversold Level. This may be expected and likewise may help to give estimates at potential for growth and decay within the Price based on which condition the Market is within.
Slow Zones move a little slower than Fast Zones, however they may still be accurate. Likewise, it is up to you to decide which Zone works better for your specific Trading Style; however, by default, the Zone type is set to Fast.
If you refer to both the Fast and Slow examples above, you may notice in the Fast the Price is only slightly above the ‘Slightly Oversold’ (Teal) line. Also, In the Fast, the Price where the ‘Very Overbought’ Level is 100k. This is one of the many reasons we’ve opted for ‘Fast’ as the default, and it is because it allows more room for movement; and in our opinion, potentially accuracy as well.
If you refer to the Slow example, you’ll see that the price is currently facing the Neutral Level as a Resistance location. However, if you refer to the price residing at the Slows ‘Very Overbought’ Level, it is only 81.5k, compared to the 100k of Fast.
The BTC Halving is a major event that takes place roughly every 4 years. It historically has a major impact on the market, and some may even say it signifies the Start, or close to start of the Bull Market. Therefore, since historically there may be cycles that BTC and potentially crypto itself follows, we’ve developed this Indicator in hopes that it may solve one of the biggest questions traders face. What Date will the Start, High and Low of the Halving occur and also at what Price.
Hopefully this Tutorial has given you some guidance as to how this Indicator may be used to help identify some of these key levels; including the slope at which the price may have to move if it is to reach its projection Price by its projected Date.
Settings:
1. Show Prediction Trend Lines:
- Options:
All
Start + High
Start + Low
High + Low
Start
High
Low
None
- Description:
Prediction Trend Lines may be an important way to see the Slope the Price needs to take to reach the Predicted Price by the Predicted Date. This may be useful for identifying if the Price is currently Overbought or Oversold.
2. Zone Type:
- Options:
Fast
Slow
- Description:
Zone types change the way the Zones expand.
3. Show Zones:
- Options:
All
Zones
Basis
None
- Description:
Zones are a way of seeing Overbought and Oversold Price locations based on Market Cap and Circulating Supply vs Max Supply.
4. Vertical Markers:
- Options:
All
Line
Label
None
- Description:
Vertical Markers display where the Halving has occurred with a Vertical Line and Label.
5. Show Tables:
Tables may be useful for seeing the Price and Date for when the Start, High and Low of the Halving may occur.
6. Fill Zones:
Filling in Zones may help to identify which Zone the Price is currently in.
If you have any questions, comments, ideas or concerns please don't hesitate to contact us.
HAPPY TRADING!
Moving_average

WPO Modified [BackQuant]The Wave Period Oscillator (WPO), developed by Akram El Sherbini, is a sophisticated technical analysis tool that offers traders a dynamic way to interpret market cycles. Its design is inspired by the natural ebb and flow of markets, which often follow cyclical patterns driven by underlying economic, political, and psychological factors. The oscillator's unique contribution to market analysis lies in its ability to smooth out the "noise" inherent in daily price movements, thus providing a clearer view of the market's rhythmic fluctuations over time.
-----> Time Cycle Oscillators' in the IFTA Journal 2018 (page 66 - 77), as found below:
ifta.org
El Sherbini's WPO is grounded in the concept of wave period analysis, which suggests that financial markets move in waves or cycles. The oscillator translates these movements into a visual tool that oscillates above and below a central zero line. Peaks and troughs on the oscillator correspond to the crests and troughs of market price waves, providing a visual representation of the market's heartbeat.
The WPO is not merely a tool for identifying trends but also for detecting shifts in market momentum. It does this through a mathematical model that measures divergence—when the direction of the oscillator deviates from the direction of price movement. Such divergences can be precursors to potential reversals or continuations in the market, offering traders advance notice of significant changes in price direction.
Further refining its utility, the WPO incorporates methods for calculating divergence that are sensitive to the unique conditions of different markets and securities. This includes adjusting for volatility and market velocity, allowing the oscillator to provide relevant signals regardless of the market environment.
In practical terms, traders use the WPO to time their entries and exits with greater precision. When the oscillator shows a high peak or a deep trough, it can signal that a market is potentially overbought or oversold, respectively. The WPO's smoothing property ensures that these signals are not just reactionary to short-term price spikes or drops, but indicative of more substantial, sustained movements.
By providing a more measured and smoothed analysis of market cycles, the WPO helps to filter out insignificant price movements and focus on the ones that matter—those that indicate a significant wave of buying or selling pressure. This can be particularly valuable in the cryptocurrency markets, where volatility is high, and traditional indicators may struggle to provide clear signals.
For traders and analysts alike, the Wave Period Oscillator represents a convergence of technical precision and market psychology. By focusing on the periodic nature of market movements, it aligns traders with the rhythm of the markets, potentially leading to more harmonious trading decisions that are in step with the market's natural waves.
Please see the backtest here:
For more simple terms:
You can use this indicator as a the oscillator
Above 0 for long
Below 0 for short
OR
WPO MA
Above 0 for long
Below 0 for short

Machine Learning: STDEV Oscillator [YinYangAlgorithms]This Indicator aims to fill a gap within traditional Standard Deviation Analysis. Rather than its usual applications, this Indicator focuses on applying Standard Deviation within an Oscillator and likewise applying a Machine Learning approach to it. By doing so, we may hope to achieve an Adaptive Oscillator which can help display when the price is deviating from its standard movement. This Indicator may help display both when the price is Overbought or Underbought, and likewise, where the price may face Support and Resistance. The reason for this is that rather than simply plotting a Machine Learning Standard Deviation (STDEV), we instead create a High and a Low variant of STDEV, and then use its Highest and Lowest values calculated within another Deviation to create Deviation Zones. These zones may help to display these Support and Resistance locations; and likewise may help to show if the price is Overbought or Oversold based on its placement within these zones. This Oscillator may also help display Momentum when the High and/or Low STDEV crosses the midline (0). Lastly, this Oscillator may also be useful for seeing the spacing between the High and Low of the STDEV; large spacing may represent volatility within the STDEV which may be helpful for seeing when there is Momentum in the form of volatility.
Tutorial:
Above is an example of how this Indicator looks on BTC/USDT 1 Day. As you may see, when the price has parabolic movement, so does the STDEV. This is due to this price movement deviating from the mean of the data. Therefore when these parabolic movements occur, we create the Deviation Zones accordingly, in hopes that it may help to project future Support and Resistance locations as well as helping to display when the price is Overbought and Oversold.
If we zoom in a little bit, you may notice that the Support Zone (Blue) is smaller than the Resistance Zone (Orange). This is simply because during the last Bull Market there was more parabolic price deviation than there was during the Bear Market. You may see this if you refer to their values; the Resistance Zone goes to ~18k whereas the Support Zone is ~10.5k. This is completely normal and the way it is supposed to work. Due to the nature of how STDEV works, this Oscillator doesn’t use a 1:1 ratio and instead can develop and expand as exponential price action occurs.
The Neutral (0) line may also act as a Support and Resistance location. In the example above we can see how when the STDEV is below it, it acts as Resistance; and when it’s above it, it acts as Support.
This Neutral line may also provide us with insight as towards the momentum within the market and when it has shifted. When the STDEV is below the Neutral line, the market may be considered Bearish. When the STDEV is above the Neutral line, the market may be considered Bullish.
The Red Line represents the STDEV’s High and the Green Line represents the STDEV’s Low. When the STDEV’s High and Low get tight and close together, this may represent there is currently Low Volatility in the market. Low Volatility may cause consolidation to occur, however it also leaves room for expansion.
However, when the STDEV’s High and Low are quite spaced apart, this may represent High levels of Volatility in the market. This may mean the market is more prone to parabolic movements and expansion.
We will conclude our Tutorial here. Hopefully this has given you some insight into how applying Machine Learning to a High and Low STDEV then creating Deviation Zones based on it may help project when the Momentum of the Market is Bullish or Bearish; likewise when the price is Overbought or Oversold; and lastly where the price may face Support and Resistance in the form of STDEV.
If you have any questions, comments, ideas or concerns please don't hesitate to contact us.
HAPPY TRADING!

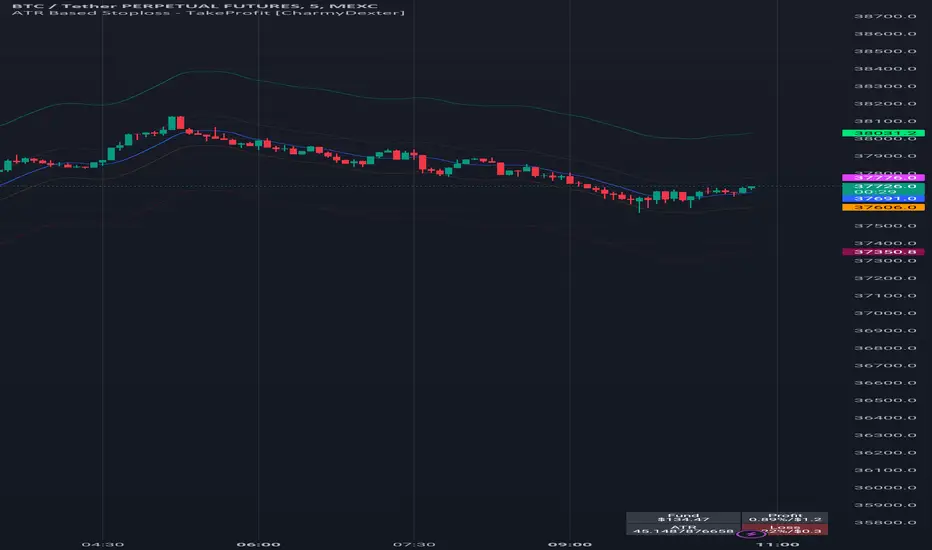
ATR Based Stoploss - TakeProfit [CharmyDexter]
This script combines the power of Average True Range (ATR) and a Moving Average (MA) to dynamically set stop-loss and take-profit levels. It introduces a volatility surge condition and includes a risk management table for comprehensive trade insights.
1) **Originality:**
- This script is original in its approach to combining Average True Range (ATR) with a Moving Average (MA) to create a dynamic stop-loss and take-profit strategy. The addition of a volatility surge condition and the inclusion of a risk management table further contribute to its uniqueness.
2) **Functionality:**
- The script aims to provide traders with a dynamic stop-loss and take-profit strategy based on ATR, incorporating a volatility surge condition and a moving average. The risk management table displays crucial information, including the fund size, potential profit/loss, ATR values, and risk.
3) **Operation:**
- The script uses ATR to calculate volatility, identifying surges in volatility. It adjusts the stop-loss and take-profit levels based on the average of ATR during these surge periods. The moving average acts as a trend indicator, and the script dynamically adjusts stop-loss and take-profit levels accordingly.
4) **Usage:**
- Traders can use this script by applying it to their preferred financial instrument's chart. The script automatically plots the moving average and dynamically adjusts stop-loss and take-profit levels based on ATR and volatility surges. Users can observe the levels on the chart for potential trade management.
5) **Concepts:**
- The script employs concepts of ATR for volatility, moving average for trend identification, and a dynamic adjustment mechanism during volatility surges. Risk management is incorporated by calculating potential profit/loss percentages based on user-defined risk.
6) **Mashup Explanation:**
- The script combines ATR, moving average, and volatility conditions to create a comprehensive strategy. ATR determines the market's volatility, the moving average serves as a trend indicator, and volatility surges trigger dynamic adjustments to stop-loss and take-profit levels. The risk management table enhances the script's utility.
7) **Line Descriptions:**
- Blue Line (Moving Average): Indicates the trend direction.
- Lime Line (Long Take Profit): Represents the level for taking profit in a long position.
- Maroon Line (Short Take Profit): Represents the level for taking profit in a short position.
- Fuchsia Line (Short Stop Loss): Represents the level for setting a stop loss in a short position.
- Orange Line (Long Stop Loss): Represents the level for setting a stop loss in a long position.
8) **Line Usage:**
- Use the blue line for trend identification.
- When taking long positions, the close should be above the blue line.
- For long positions, the lime line is a potential take-profit level, and the orange line is a potential stop-loss level.
- For short positions, the maroon line is a potential take-profit level, and the fuchsia line is a potential stop-loss level.
- The risk management table provides insights into fund size, potential profit/loss, ATR values, and risk.
Note: The profit/loss calculations in this script may not be entirely accurate due to factors like market execution. Market execution may not always occur at the exact levels specified by the script due to slippage or delays in order processing. This can impact the realized profit or loss compared to the calculated levels.
It is crucial to note that this ATR Based Stop-loss - Take-Profit indicator is merely one tool among many that traders can employ to establish trading targets. Additional technical indicators are essential for taking trades and making informed decisions.
Commented-out sections for alerts and shape plotting are provided, allowing for visual and auditory notifications if desired.
It's crucial for traders to be aware of these factors and use the script as a tool within a broader trading strategy. Additionally, regular monitoring and adjustments based on real-time market conditions are recommended to enhance the accuracy of profit/loss assessments.
SMA Cross with a Price FilterA moving average strategy generates an entry (buy) signal when the price goes above the moving average, and an exit (sell) signal when the price goes below the moving average. But it gives lots of whipsaws and noise depends on the moving average we use. A fast moving average gives more whipsaws and a slow moving average gives less whipsaws. To reduce the noise/whipsaws, we can add a filter on a fast/slow moving average. It will improve entry/exit performance significantly specially for those who don't want to watch the market actively.
I created this indicator with a price filter. This means the price of an underlying asset must be at least a specific percentage above its moving average to generate a buy signal and a specific percentage below its moving average to generate a sell signal. This price filter can also be a confirmation after the price crosses above/below its SMA. I couldn't find any indicator yet based on this idea. So I wrote this indicator and publishing it so it helps those who are interested.
I use 200 SMA and 3% price filter as default and using SPY as an example. So,
ENTRY signal when the closing price of SPY is 3% above its 200 SMA.
EXIT signal when the closing price of SPY is 3% below its 200 SMA.
Enjoy and let me know if it works.
** This chart only generates entry (buy) and exit (sell) signals. Please, do your own diligence to make any investment or trading decisions.

Trend-based Price Action StrategyThis is a strategy script that combines trend-based price action analysis with the Relative Strength Index (RSI) and Exponential Moving Averages (EMA) as trend filters. Here's a summary of the key components and logic:
Price Action Candlestick Patterns:
Bullish patterns: Engulfing candle and Morning Star.
Bearish patterns: Engulfing candle and Evening Star.
RSI Integration:
RSI is used to identify overbought and oversold conditions.
EMA Trend Filter:
Three EMAs with different periods: Fast , Medium and Slow.
Long trend condition occur when the fast EMA is above the medium and the medium is above the slow EMA.
Short trend condition occur when the slow EMA is above the medium and the medium is above the fast EMA.
Long entry conditions: RSI is oversold, RSI is decreasing, bullish candlestick pattern, and EMA trend filter conditions are met.
Short entry conditions: RSI is overbought, RSI is decreasing, bearish candlestick pattern, and EMA trend filter conditions are met.
Exit conditions:
Take profit or stop loss is reached.
Plotting:
Signals are plotted on the chart when entry conditions are met.
EMAs are plotted when the EMA trend filter is enabled.
This script aims to capture potential trend reversal points based on a combination of candlestick patterns, RSI, and EMA trend analysis.
Traders can use this script as a starting point for further customization or as a reference for developing their own trading strategies. It's important to note that past performance is not indicative of future results, and thorough testing and validation are recommended before deploying any trading strategy.

[KVA] Extremes ProfilerExtremes Profiler is a specialized indicator crafted for traders focusing on the relationship between price extremes and moving averages. This tool offers a comprehensive perspective on price dynamics by quantifying and visualizing significant distances of current prices from various moving averages. It effectively highlights the top extremes in market movements, providing key insights into price extremities relative to these averages. The indicator's ability to analyze and display these distances makes it a valuable tool for understanding market trends and potential turning points. Traders can leverage the Extremes Profiler to gain a deeper understanding of how prices behave in relation to commonly watched moving averages, thus aiding in making informed trading decisions
Key Features :
Extensive MA Analysis : Tracks the price distance from multiple moving averages including EMA, SMA, WMA, RMA, and HMA.
Top 50 (100) Distance Metrics : Highlights the 50 (100)greatest (highest or lowest) distances from each selected MA, pinpointing significant market deviations.
Customizable Periods : Offers flexibility with adjustable periods to align with diverse trading strategies.
Comprehensive View : Switch between timeframes for a well-rounded understanding of short-term fluctuations and long-term market trends.
Cross-Asset Comparison : Utilize the indicator to compare different assets, gaining insights into the relative dynamics and volatility of various markets. By analyzing multiple assets, traders can discern broader market trends and better understand asset-specific behaviors.
Customizable Display : Users can adjust the periods and number of results to suit their analytical needs.

Machine Learning: Optimal Length [YinYangAlgorithms]This Indicator aims to solve an issue that most others face; static lengths. This Indicator will scan lengths from the Min to Max setting (1 - 400 by default) to calculate which is the most Optimal Length in the current market condition. Almost every Indicator uses a length in some part of their calculation, and this length is usually adjustable via the Settings; however it is generally a static fixed length. Static non changing lengths may not always produce optimal results. As market conditions change generally the optimal length will too. For this reason we have created this indicator.
This Indicator will create a Neutral (Min - Max Length), Fast (Min - Mid Length ((Max - Min) / 2)) and Slow (Mid Length ((Max - Min) / 2) - Max Length). This allows you to understand which the Optimal Fast, Slow and Neutral lengths are within the given Mix and Max length settings.
This Indicator then plots these Optimal Lengths as an Oscillator which can then be used within ANOTHER Indicator as a Source within its Settings. Stand alone this Indicator may not prove all that useful, however when its Lengths are inputted into another Indicator it may prove very useful. This allows other Indicators to use the Optimal Length within its calculations from the Settings rather than relying on simply a fixed length. Unfortunately this results in users needing to manually plug the Optimal Length plots into the second Indicator; but it also allows for endless possibilities with applying Machine Learning Optimal Lengths within both Traditional and Non-Traditional Indicators and may give other Pine Coders an easy and effective way to add Machine Learning auto adjustable lengths within their already created Indicators.
The beautiful part about this Indicator is that aside from inputting the Optimal Length Plot into another Indicator, there is no manual updating needed. When the Optimal Length changes, the change will automatically reflect in the other Indicator without the need for you to manually adjust its length. This may be very useful with both time preservation, as well as if there is an automated strategy based upon said Indicator that now won’t need manual intervention.
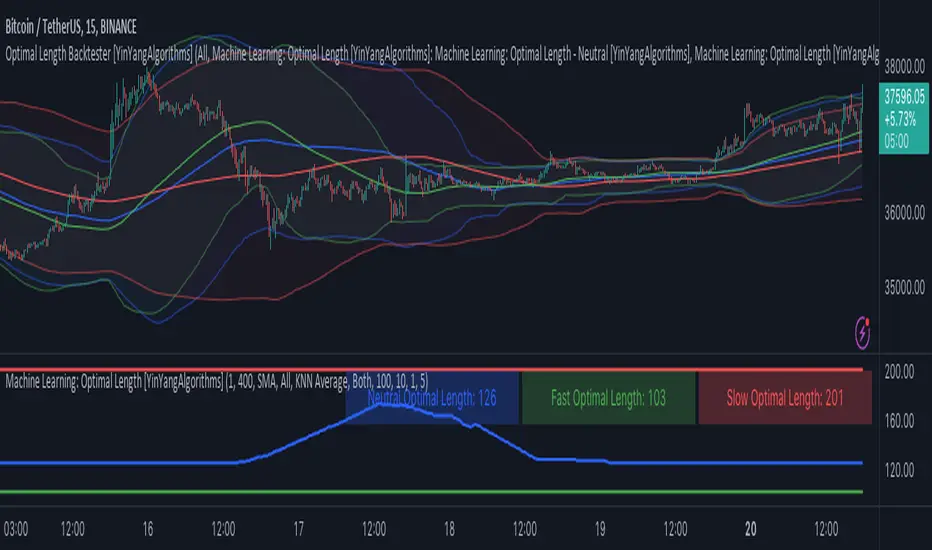
Tutorial:
By default this is what the Machine Learning: Optimal Length Indicator looks like. It is simply a way of both Displaying and Plotting our current Optimal Length so that we may then use it as a source within ANOTHER Indicator. This will allow the automation of an Optimal Length to be updated, rather than needing any manual input from yourself (aside from set up).
For instance if you set the start length to 1 and the end length to 400 (default settings), it will scan to find the optimal Length setting between 1 and 400. This features 3 types of lengths:
Fast (Green Line): 1-199 (from start length to half way of total)
Slow (Red Line): 200 - 400 (mid way to end length)
Neutral (Blue Line): 1 - 400 (start to end length)
By breaking down the Optimal Length detection into these 3 different types, we can see how the Optimal Length compares and changes based on the lengths allotted to them and how performance changes.
For instance, you may notice that both the Fast and Slow Optimal Length didn’t change much in the example above; however the Neutral Optimal Length changed quite a bit. This is due to the fact that the Neutral is inclusive of all lengths available and may be considered the more accurate due to that. However, this doesn’t mean the Fast and Slow lengths aren’t important and should be used. They may be useful for seeing how something fairs in a Fast and Slow standpoint.
If you change your TimeFrame from 15 minute to 1 Day, you’ll notice that the Optimal Lengths gravitate towards their upper bounds:
199 is max for Fast, it’s at 195
400 is max for Slow, its at 393
400 is max for Neutral, its at 399
The Optimal Length may move up to its upper bounds on Higher Time Frames because there is a lot of price action and long term data being displayed. This may lead to higher lengths performing better in a profitability standpoint since its data is based on so far back and such drastic price movements.
Below we’re going to go through a few examples, including the code so you may reproduce the example and have an understanding of how versatile Inputting an Optimal Length as a source may be within Traditional Indicators.
Adding the Machine Learning: Optimal Length to another Indicator:
You may add the Optimal Length to another Indicator as shown in the example above. In the example we are adding the ‘Machine Learning: Optimal Length - Neutral’ to our Neutral Length within the Settings. The external Indicator needs to have the ability to input the Optimal Length as a Source, this way it can automatically change within the external Indicator when the Optimal Length Indicator changes its Optimal Length.
Please note you may get an error within an external Indicator that accepts the Length as a Source if you don’t select the Machine Learning: Optimal Length. For instance, if you use ‘Close’ within BTC/USDT the length used would be ~36,000. This length is too long and will throw an error.
For this reason, we will ensure the Max Length that may be used is 1000.
Please note, on lower Time Frames you may need to adjust the Max Length. For instance if 20k bar data is used, the Max Length ‘may’ fail to load when going by default Min: 1 and Max: 400. Generally with most pairs it will load if your TradingView subscription is Premium or greater; however if it is less there is a chance it may fail. If it fails for you too often please lower the Max Length Amount; or send us a message we can look into a fix for this.
*** If it fails to load, please try removing the external Indicator and re-adding it and adding the Lengths back as a Source within the Settings. Sometimes it fails, but re-adding may fix it. If it keeps failing afterwards, reduce the Max Length Amount as mentioned above. ***
Simple Moving Average:
In this example above have the Fast, Slow and Neutral Optimal Length formatted as a Slow Moving Average. The first example is on the 15 minute Time Frame and the second is on the 1 Day Time Frame, demonstrating how the length changes based on the Time Frame and the effects it may have.
Here is the code for the example Indicator shown above. This example shows how you may use the Optimal Length as a Source and then use that Optimal Length and plot it as a Simple Moving Average:
//@version=5
indicator("Optimal Length - Backtesting - MA", overlay=true, max_bars_back=5000)
outputType = input.string("All", "Output Type", options= )
lengthSource = input.source(close, "Neutral Length")
lengthSource_fast = input.source(close, "Fast Length")
lengthSource_slow = input.source(close, "Slow Length")
showNeutral = outputType == "Neutral" or outputType == "Fast + Neutral" or outputType == "Slow + Neutral" or outputType == "All"
showFast = outputType == "Fast" or outputType == "Fast + Neutral" or outputType == "Fast + Slow" or outputType == "All"
showSlow = outputType == "Slow" or outputType == "Slow + Neutral" or outputType == "Fast + Slow" or outputType == "All"
//Neutral
optimalLength = math.min(math.max(math.round(lengthSource), 1), 1000)
optimalMA = ta.sma(close, optimalLength)
//Fast
optimalLength_fast = math.min(math.max(math.round(lengthSource_fast), 1), 1000)
optimalMA_fast = ta.sma(close, optimalLength_fast)
//Slow
optimalLength_slow = math.min(math.max(math.round(lengthSource_slow), 1), 1000)
optimalMA_slow = ta.sma(close, optimalLength_slow)
plot(showNeutral ? optimalMA : na, color=color.blue)
plot(showFast ? optimalMA_fast : na, color=color.green)
plot(showSlow ? optimalMA_slow : na, color=color.red)
Bollinger Bands:
In the two examples above for Bollinger Bands we have first the 15 Minute Time Frame and then the 1 Day Time Frame. As described above in ‘Adding the Machine Learning: Optimal Length to another Indicator’ sometimes it may fail to load, for this reason in the 15 Minute it was reduced to a max of 300 Length.
Bollinger Bands are a way to see a Simple Moving Average (SMA) that then uses Standard Deviation to identify how much deviation has occurred. This Deviation is than Added and Subtracted from the SMA to create the Bollinger Bands which help Identify possible movement zones that are ‘within range’. This may mean that the price may face Support / Resistance when it reaches the Outer / Inner bounds of the Bollinger Bands. Likewise, it may mean the Price is ‘Overbought’ when outside and above or ‘Underbought’ when outside and below the Bollinger Bands.
By applying All 3 different types of Optimal Lengths towards a Traditional Bollinger Band calculation we may hope to see different ranges of Bollinger Bands and how different lookback lengths may imply possible movement ranges on both a Short Term, Long Term and Neutral perspective. By seeing these possible ranges you may have the ability to identify more levels of Support and Resistance over different lengths and Trading Styles.
Below is the code for the Bollinger Bands example above:
//@version=5
indicator("Optimal Length - Backtesting - Bollinger Bands", overlay=true, max_bars_back=5000)
outputType = input.string("All", "Output Type", options= )
lengthSource = input.source(close, "Neutral Length")
lengthSource_fast = input.source(close, "Fast Length")
lengthSource_slow = input.source(close, "Slow Length")
showNeutral = outputType == "Neutral" or outputType == "Fast + Neutral" or outputType == "Slow + Neutral" or outputType == "All"
showFast = outputType == "Fast" or outputType == "Fast + Neutral" or outputType == "Fast + Slow" or outputType == "All"
showSlow = outputType == "Slow" or outputType == "Slow + Neutral" or outputType == "Fast + Slow" or outputType == "All"
mult = 2.0
src = close
neutralColor = color.blue
slowColor = color.red
fastColor = color.green
//Neutral
optimalLength = math.min(math.max(math.round(lengthSource), 1), 1000)
optimalMA = ta.sma(close, optimalLength)
//Fast
optimalLength_fast = math.min(math.max(math.round(lengthSource_fast), 1), 1000)
optimalMA_fast = ta.sma(close, optimalLength_fast)
//Slow
optimalLength_slow = math.min(math.max(math.round(lengthSource_slow), 1), 1000)
optimalMA_slow = ta.sma(close, optimalLength_slow)
//Neutral Bollinger Bands
dev = mult * ta.stdev(src, math.round(optimalLength))
upper = optimalMA + dev
lower = optimalMA - dev
plot(showNeutral ? optimalMA : na, "Neutral Basis", color=color.new(neutralColor, 0))
p1 = plot(showNeutral ? upper : na, "Neutral Upper", color=color.new(neutralColor, 50))
p2 = plot(showNeutral ? lower : na, "Neutral Lower", color=color.new(neutralColor, 50))
fill(p1, p2, title = "Neutral Background", color=color.new(neutralColor, 96))
//Slow Bollinger Bands
dev_slow = mult * ta.stdev(src, math.round(optimalLength_slow))
upper_slow = optimalMA_slow + dev_slow
lower_slow = optimalMA_slow - dev_slow
plot(showFast ? optimalMA_slow : na, "Slow Basis", color=color.new(slowColor, 0))
p1_slow = plot(showFast ? upper_slow : na, "Slow Upper", color=color.new(slowColor, 50))
p2_slow = plot(showFast ? lower_slow : na, "Slow Lower", color=color.new(slowColor, 50))
fill(p1_slow, p2_slow, title = "Slow Background", color=color.new(slowColor, 96))
//Fast Bollinger Bands
dev_fast = mult * ta.stdev(src, math.round(optimalLength_fast))
upper_fast = optimalMA_fast + dev_fast
lower_fast = optimalMA_fast - dev_fast
plot(showSlow ? optimalMA_fast : na, "Fast Basis", color=color.new(fastColor, 0))
p1_fast = plot(showSlow ? upper_fast : na, "Fast Upper", color=color.new(fastColor, 50))
p2_fast = plot(showSlow ? lower_fast : na, "Fast Lower", color=color.new(fastColor, 50))
fill(p1_fast, p2_fast, title = "Fast Background", color=color.new(fastColor, 96))
Donchian Channels:
Above you’ll see two examples of Machine Learning: Optimal Length applied to Donchian Channels. These are displayed with both the 15 Minute Time Frame and the 1 Day Time Frame.
Donchian Channels are a way of seeing potential Support and Resistance within a given lookback length. They are a way of withholding the High’s and Low’s of a specific lookback length and looking for deviation within this length. By applying our Fast, Slow and Neutral Machine Learning: Optimal Length to these Donchian Channels way may hope to achieve a viable range of High’s and Low’s that one may use to Identify Support and Resistance locations for different ranges of Optimal Lengths and likewise potentially different Trading Strategies.
The code to reproduce these Donchian Channels as displayed above is so:
//@version=5
indicator("Optimal Length - Backtesting - Donchian Channels", overlay=true, max_bars_back=5000)
outputType = input.string("All", "Output Type", options= )
lengthSource = input.source(close, "Neutral Length")
lengthSource_fast = input.source(close, "Fast Length")
lengthSource_slow = input.source(close, "Slow Length")
showNeutral = outputType == "Neutral" or outputType == "Fast + Neutral" or outputType == "Slow + Neutral" or outputType == "All"
showFast = outputType == "Fast" or outputType == "Fast + Neutral" or outputType == "Fast + Slow" or outputType == "All"
showSlow = outputType == "Slow" or outputType == "Slow + Neutral" or outputType == "Fast + Slow" or outputType == "All"
mult = 2.0
src = close
neutralColor = color.blue
slowColor = color.red
fastColor = color.green
//Neutral
optimalLength = math.min(math.max(math.round(lengthSource), 1), 1000)
optimalMA = ta.sma(close, optimalLength)
//Fast
optimalLength_fast = math.min(math.max(math.round(lengthSource_fast), 1), 1000)
optimalMA_fast = ta.sma(close, optimalLength_fast)
//Slow
optimalLength_slow = math.min(math.max(math.round(lengthSource_slow), 1), 1000)
optimalMA_slow = ta.sma(close, optimalLength_slow)
//Neutral Donchian Channels
lower_dc = ta.lowest(optimalLength)
upper_dc = ta.highest(optimalLength)
basis_dc = math.avg(upper_dc, lower_dc)
plot(showNeutral ? basis_dc : na, "Donchain Channel - Neutral Basis", color=color.new(neutralColor, 0))
u = plot(showNeutral ? upper_dc : na, "Donchain Channel - Neutral Upper", color=color.new(neutralColor, 50))
l = plot(showNeutral ? lower_dc : na, "Donchain Channel - Neutral Lower", color=color.new(neutralColor, 50))
fill(u, l, color=color.new(neutralColor, 96), title = "Donchain Channel - Neutral Background")
//Fast Donchian Channels
lower_dc_fast = ta.lowest(optimalLength_fast)
upper_dc_fast = ta.highest(optimalLength_fast)
basis_dc_fast = math.avg(upper_dc_fast, lower_dc_fast)
plot(showFast ? basis_dc_fast : na, "Donchain Channel - Fast Neutral Basis", color=color.new(fastColor, 0))
u_fast = plot(showFast ? upper_dc_fast : na, "Donchain Channel - Fast Upper", color=color.new(fastColor, 50))
l_fast = plot(showFast ? lower_dc_fast : na, "Donchain Channel - Fast Lower", color=color.new(fastColor, 50))
fill(u_fast, l_fast, color=color.new(fastColor, 96), title = "Donchain Channel - Fast Background")
//Slow Donchian Channels
lower_dc_slow = ta.lowest(optimalLength_slow)
upper_dc_slow = ta.highest(optimalLength_slow)
basis_dc_slow = math.avg(upper_dc_slow, lower_dc_slow)
plot(showSlow ? basis_dc_slow : na, "Donchain Channel - Slow Neutral Basis", color=color.new(slowColor, 0))
u_slow = plot(showSlow ? upper_dc_slow : na, "Donchain Channel - Slow Upper", color=color.new(slowColor, 50))
l_slow = plot(showSlow ? lower_dc_slow : na, "Donchain Channel - Slow Lower", color=color.new(slowColor, 50))
fill(u_slow, l_slow, color=color.new(slowColor, 96), title = "Donchain Channel - Slow Background")
Envelopes / Envelopes Adjusted:
Envelopes are an interesting one in the sense that they both may be perceived as useful; however we deem that with the use of an ‘Optimal Length’ that the ‘Envelopes Adjusted’ may work best. We will start with examples of the Traditional Envelope then showcase the Adjusted version.
Envelopes:
As you may see, a Traditional form of Envelopes even produced with our Machine Learning: Optimal Length may not produce optimal results. Unfortunately this may occur with some Traditional Indicators and they may need some adjustments as you’ll notice with the ‘Envelopes Adjusted’ version. However, even without the adjustments, these Envelopes may be useful for seeing ‘Overbought’ and ‘Oversold’ locations within a Machine Learning: Optimal Length standpoint.
Envelopes Adjusted:
By adding an adjustment to these Envelopes, we may hope to better reflect out Optimal Length within it. This is caused by adding a ratio reflection towards the current length of the Optimal Length and the max Length used. This allows for the Fast and Neutral (and potentially Slow if Neutral is greater) to achieve a potentially more accurate result.
Envelopes, much like Bollinger Bands are a way of seeing potential movement zones along with potential Support and Resistance. However, unlike Bollinger Bands which are based on Standard Deviation, Envelopes are based on percentages +/- from the Simple Moving Average.
The code used to reproduce the example above is as follows:
//@version=5
indicator("Optimal Length - Backtesting - Envelopes", overlay=true, max_bars_back=5000)
outputType = input.string("All", "Output Type", options= )
displayType = input.string("Envelope Adjusted", "Display Type", options= )
lengthSource = input.source(close, "Neutral Length")
lengthSource_fast = input.source(close, "Fast Length")
lengthSource_slow = input.source(close, "Slow Length")
showNeutral = outputType == "Neutral" or outputType == "Fast + Neutral" or outputType == "Slow + Neutral" or outputType == "All"
showFast = outputType == "Fast" or outputType == "Fast + Neutral" or outputType == "Fast + Slow" or outputType == "All"
showSlow = outputType == "Slow" or outputType == "Slow + Neutral" or outputType == "Fast + Slow" or outputType == "All"
mult = 2.0
src = close
neutralColor = color.blue
slowColor = color.red
fastColor = color.green
//Neutral
optimalLength = math.min(math.max(math.round(lengthSource), 1), 1000)
optimalMA = ta.sma(close, optimalLength)
//Fast
optimalLength_fast = math.min(math.max(math.round(lengthSource_fast), 1), 1000)
optimalMA_fast = ta.sma(close, optimalLength_fast)
//Slow
optimalLength_slow = math.min(math.max(math.round(lengthSource_slow), 1), 1000)
optimalMA_slow = ta.sma(close, optimalLength_slow)
percent = 10.0
maxAmount = math.max(optimalLength, optimalLength_fast, optimalLength_slow)
//Neutral
k = displayType == "Envelope" ? percent/100.0 : (percent/100.0) / (optimalLength / maxAmount)
upper_env = optimalMA * (1 + k)
lower_env = optimalMA * (1 - k)
plot(showNeutral ? optimalMA : na, "Envelope - Neutral Basis", color=color.new(neutralColor, 0))
u_env = plot(showNeutral ? upper_env : na, "Envelope - Neutral Upper", color=color.new(neutralColor, 50))
l_env = plot(showNeutral ? lower_env : na, "Envelope - Neutral Lower", color=color.new(neutralColor, 50))
fill(u_env, l_env, color=color.new(neutralColor, 96), title = "Envelope - Neutral Background")
//Fast
k_fast = displayType == "Envelope" ? percent/100.0 : (percent/100.0) / (optimalLength_fast / maxAmount)
upper_env_fast = optimalMA_fast * (1 + k_fast)
lower_env_fast = optimalMA_fast * (1 - k_fast)
plot(showFast ? optimalMA_fast : na, "Envelope - Fast Basis", color=color.new(fastColor, 0))
u_env_fast = plot(showFast ? upper_env_fast : na, "Envelope - Fast Upper", color=color.new(fastColor, 50))
l_env_fast = plot(showFast ? lower_env_fast : na, "Envelope - Fast Lower", color=color.new(fastColor, 50))
fill(u_env_fast, l_env_fast, color=color.new(fastColor, 96), title = "Envelope - Fast Background")
//Slow
k_slow = displayType == "Envelope" ? percent/100.0 : (percent/100.0) / (optimalLength_slow / maxAmount)
upper_env_slow = optimalMA_slow * (1 + k_slow)
lower_env_slow = optimalMA_slow * (1 - k_slow)
plot(showSlow ? optimalMA_slow : na, "Envelope - Slow Basis", color=color.new(slowColor, 0))
u_env_slow = plot(showSlow ? upper_env_slow : na, "Envelope - Slow Upper", color=color.new(slowColor, 50))
l_env_slow = plot(showSlow ? lower_env_slow : na, "Envelope - Slow Lower", color=color.new(slowColor, 50))
fill(u_env_slow, l_env_slow, color=color.new(slowColor, 96), title = "Envelope - Slow Background")
Hopefully these examples, including reproducing code, have given you some insight as to how useful this Machine Learning: Optimal Length may be and how another Indicator may easily modify their existing code to incorporate the usage of such Machine Learning: Optimal Length. We likewise will publish a Backtesting Indicator which incorporates all of the concepts we’ve gone over within here; in case you wish to take advantage of the Traditional Indicators mentioned above that allow the input of Machine Learning: Optimal Length and don’t wish to code them.
If you have any questions, comments, ideas or concerns please don't hesitate to contact us.
HAPPY TRADING!
K`s Extreme DurationExtreme duration uses a special combination of the RSI and its relative position to deliver a reversal signal.
The following are the conditions to generate signals:
* Bullish signal: The current 8-period RSI is below 50 and above 35 while the previous 5 RSI's are below 35.
* Bearish signal: The current 8-period RSI is above 50 and below 65 while the previous 5 RSI's are above 65.

DNS Relax Buy/SellDNS Relax Buy/Sell Indicator
It is a very simple indicator to use for long-term investors.
It uses ema 3 in Buy and Sell alerts. If ema 3 crosses the baseline line (ema200 Daily) up, it means Buy, and if it breaks down, it means Sell.
There is also a 'take profit line' to determine and see the profit rate.
It can be changed from the settings.
Additionally, the blue line on the indicator (appears as full blue) is the closing price line of the bar where the buy signal is located. It can be turned off from the style settings.
You can also turn buy and sell signals on and off from the settings.
My advice to you is to use this indicator in small time periods. for example, in 1-minute, 3-minutes or 5-minutes time periods.
It can be used in all financial instruments.
Wishing you to always win.

Smart MAThe Smart MA indicator is a tool designed for traders seeking insights into market trends, with its foundation rooted in moving averages. It offers two distinctive color options, with "Crossing" as the default choice and "Direction" as an alternative. Let's delve deeper into these options:
1. "Crossing" Color Option (Default):
Key Features:
Utilizes the interaction between fast and slow moving averages.
The color of the base moving average (MA) line dynamically changes based on crossovers between these moving averages.
Offers real-time visual signals for potential shifts in market sentiment.
Interpretation:
With the "Crossing" color option as the default setting, the base MA line's color responds to the interaction of the fast and slow moving averages.
A crossover where the fast MA crosses above the slow MA may prompt the base MA line to change to a bullish color (e.g., teal), indicating a potential bullish trend.
Conversely, if the fast MA crosses below the slow MA, the base MA line's color may alter to represent a bearish sentiment (e.g., red). This color shift provides a visual marker for a potential bearish trend, potentially guiding traders towards shorting opportunities.
2. "Direction" Color Option:
Key Features:
Focuses on the directional trend of the base moving average (MA).
The color of the base MA line signifies the direction in which the base MA is moving.
Aids in quickly identifying the prevailing market trend.
Interpretation:
Uptrend - Bullish Direction: When the base MA slopes upward, indicating an average price increase over the chosen base MA length, the base MA line's color may shift to a bullish hue (e.g., teal). This visual cue signals a potential uptrend, suggesting favorable long positions.
Downtrend - Bearish Direction: If the base MA slopes downward, signifying an average price decrease over the selected base MA length, the base MA line could change to a bearish shade (e.g., red). This color shift acts as an indicator of a potential downtrend, implying possible opportunities for shorting.
Customization:
Both color options allow traders to adjust the indicator's parameters, including base MA length, MA type, fast MA length, and slow MA length, to align with their trading strategies and preferred timeframes.
In summary, the Smart MA indicator, based on moving averages, provides traders with two color options: the default "Crossing" and "Direction" as an alternative. The "Crossing" option leverages fast and slow moving averages to offer real-time visual cues for dynamic market shifts. The "Direction" option simplifies trend analysis by focusing on the directional trend of the base MA. The choice between these options depends on your trading style and the depth of analysis you require. With the Smart MA indicator, you're equipped to make informed trading decisions in today's financial markets.

Machine Learning: VWAP [YinYangAlgorithms]Machine Learning: VWAP aims to use Machine Learning to Identify the best location to Anchor the VWAP at. Rather than using a traditional fixed length or simply adjusting based on a Date / Time; by applying Machine Learning we may hope to identify crucial areas which make sense to reset the VWAP and start anew. VWAP’s may act similar to a Bollinger Band in the sense that they help to identify both Overbought and Oversold Price locations based on previous movements and help to identify how far the price may move within the current Trend. However, unlike Bollinger Bands, VWAPs have the ability to parabolically get quite spaced out and also reset. For this reason, the price may never actually go from the Lower to the Upper and vice versa (when very spaced out; when the Upper and Lower zones are narrow, it may bounce between the two). The reason for this is due to how the anchor location is calculated and in this specific Indicator, how it changes anchors based on price movement calculated within Machine Learning.
This Indicator changes the anchor if the Low < Lowest Low of a length of X and likewise if the High > Highest High of a length of X. This logic is applied within a Machine Learning standpoint that likewise amplifies this Lookback Length by adding a Machine Learning Length to it and increasing the lookback length even further.
Due to how the anchor for this VWAP changes, you may notice that the Basis Line (Orange) may act as a Trend Identifier. When the Price is above the basis line, it may represent a bullish trend; and likewise it may represent a bearish trend when below it. You may also notice what may happen is when the trend occurs, it may push all the way to the Upper or Lower levels of this VWAP. It may then proceed to move horizontally until the VWAP expands more and it may gain more movement; or it may correct back to the Basis Line. If it corrects back to the basis line, what may happen is it either uses the Basis Line as a Support and continues in its current direction, or it will change the VWAP anchor and start anew.
Tutorial:
If we zoom in on the most recent VWAP we can see how it expands. Expansion may be caused by time but generally it may be caused by price movement and volume. Exponential Price movement causes the VWAP to expand, even if there are corrections to it. However, please note Volume adds a large weighted factor to the calculation; hence Volume Weighted Average Price (VWAP).
If you refer to the white circle in the example above; you’ll be able to see that the VWAP expanded even while the price was correcting to the Basis line. This happens due to exponential movement which holds high volume. If you look at the volume below the white circle, you’ll notice it was very large; however even though there was exponential price movement after the white circle, since the volume was low, the VWAP didn’t expand much more than it already had.
There may be times where both Volume and Price movement isn’t significant enough to cause much of an expansion. During this time it may be considered to be in a state of consolidation. While looking at this example, you may also notice the color switch from red to green to red. The color of the VWAP is related to the movement of the Basis line (Orange middle line). When the current basis is > the basis of the previous bar the color of the VWAP is green, and when the current basis is < the basis of the previous bar, the color of the VWAP is red. The color may help you gauge the current directional movement the price is facing within the VWAP.
You may have noticed there are signals within this Indicator. These signals are composed of Green and Red Triangles which represent potential Bullish and Bearish momentum changes. The Momentum changes happen when the Signal Type:
The High/Low or Close (You pick in settings)
Crosses one of the locations within the VWAP.
Bullish Momentum change signals occur when :
Signal Type crosses OVER the Basis
Signal Type crosses OVER the lower level
Bearish Momentum change signals occur when:
Signal Type crosses UNDER the Basis
Signal Type Crosses UNDER the upper level
These signals may represent locations where momentum may occur in the direction of these signals. For these reasons there are also alerts available to be set up for them.
If you refer to the two circles within the example above, you may see that when the close goes above the basis line, how it mat represents bullish momentum. Likewise if it corrects back to the basis and the basis acts as a support, it may continue its bullish momentum back to the upper levels again. However, if you refer to the red circle, you’ll see if the basis fails to act as a support, it may then start to correct all the way to the lower levels, or depending on how expanded the VWAP is, it may just reset its anchor due to such drastic movement.
You also have the ability to disable Machine Learning by setting ‘Machine Learning Type’ to ‘None’. If this is done, it will go off whether you have it set to:
Bullish
Bearish
Neutral
For the type of VWAP you want to see. In this example above we have it set to ‘Bullish’. Non Machine Learning VWAP are still calculated using the same logic of if low < lowest low over length of X and if high > highest high over length of X.
Non Machine Learning VWAP’s change much quicker but may also allow the price to correct from one side to the other without changing VWAP Anchor. They may be useful for breaking up a trend into smaller pieces after momentum may have changed.
Above is an example of how the Non Machine Learning VWAP looks like when in Bearish. As you can see based on if it is Bullish or Bearish is how it favors the trend to be and may likewise dictate when it changes the Anchor.
When set to neutral however, the Anchor may change quite quickly. This results in a still useful VWAP to help dictate possible zones that the price may move within, but they’re also much tighter zones that may not expand the same way.
We will conclude this Tutorial here, hopefully this gives you some insight as to why and how Machine Learning VWAPs may be useful; as well as how to use them.
Settings:
VWAP:
VWAP Type: Type of VWAP. You can favor specific direction changes or let it be Neutral where there is even weight to both. Please note, these do not apply to the Machine Learning VWAP.
Source: VWAP Source. By default VWAP usually uses HLC3; however OHLC4 may help by providing more data.
Lookback Length: The Length of this VWAP when it comes to seeing if the current High > Highest of this length; or if the current Low is < Lowest of this length.
Standard VWAP Multiplier: This multiplier is applied only to the Standard VWMA. This is when 'Machine Learning Type' is set to 'None'.
Machine Learning:
Use Rational Quadratics: Rationalizing our source may be beneficial for usage within ML calculations.
Signal Type: Bullish and Bearish Signals are when the price crosses over/under the basis, as well as the Upper and Lower levels. These may act as indicators to where price movement may occur.
Machine Learning Type: Are we using a Simple ML Average, KNN Mean Average, KNN Exponential Average or None?
KNN Distance Type: We need to check if distance is within the KNN Min/Max distance, which distance checks are we using.
Machine Learning Length: How far back is our Machine Learning going to keep data for.
k-Nearest Neighbour (KNN) Length: How many k-Nearest Neighbours will we account for?
Fast ML Data Length: What is our Fast ML Length? This is used with our Slow Length to create our KNN Distance.
Slow ML Data Length: What is our Slow ML Length? This is used with our Fast Length to create our KNN Distance.
If you have any questions, comments, ideas or concerns please don't hesitate to contact us.
HAPPY TRADING!

Fisher+ [OSC]The Fisher Transform Indicator is classified as an oscillator, meaning that its value swings above and below a central point. This characteristic allows traders to identify overbought and oversold conditions, providing potential clues about market reversals. As mentioned previously, it is an oscillator so the strength of the move is displayed by how long the fisher line stays above/below zero. Indicator can be used to aid in confluence near supply/demand zones.
White Line = Fisher
Red/Blue Line = Moving Average
--Changes color whether fisher line is above/below the MA
Red/Blue Shaded Line = Moving Average
--Changes color based on a smoothing factor
Red/Blue Shaded Fill = Asset in Overbought/Oversold Conditions
Red/Blue Circles = Asset in Extreme Overbought/Oversold Conditions
Red/Blue Triangles = MACD Signals Below/Above "0"
Divergence Labels = Asset Signaling Divergence
The moving average line will turn red/blue as long as the fisher line is below/above the moving average. The shaded MA line will switch colors based on if it is moving in an up/down trend. The MA can also be used as a signal and treated similar to an oscillator. Market trending conditions will either keep the MA below/above the dashed zero line.
MACD code credited to LazyBear's MACD Leader indicator. It is used to filter out/confirm any signals such as divergences. As long as the MACD Leader line is above both the MACD line and signal lines then it'll signal with with a triangle. MACD divergences will be added at a later time.

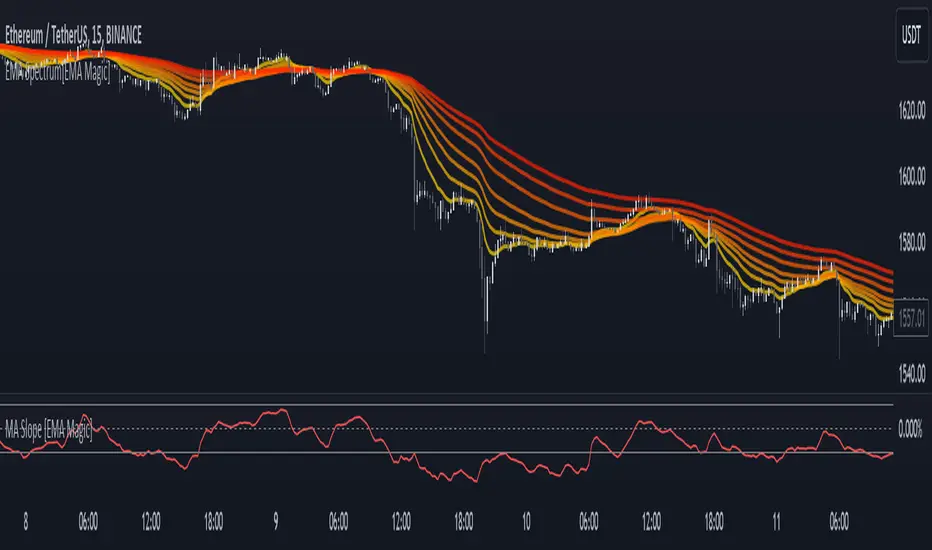
MA Slope [EMA Magic]█ Overview:
The MA Slope calculates the slope based on a given moving average.
The Moving Average Slope indicator allows you to identify the direction and the strength of a trend.
It calculates the rate of change in percentage based on the user-defined moving average.
█ Calculation: This indicator calculates the slope based on the changes of moving average and normalizes it with Average True Range(ATR).
The default value of ATR is 7.I recommend not changing it unless you know exactly what are you doing.
█ Input Settings:
The settings are divided into three sections:
The first section is for time frame adjustments. Modify it separately from the chart, Allows you to use moving averages from different time frames.
In the second section, you can configure the base calculation,including Moving Average and Average True Range(ATR) settings.
In the third section, you can detect breakout and sudden change signals, which are highlighted in the background of the indicator.
Note that When you change the breakout limit value, it also affects the band limit indicator on your chart.
To avoid signal confusion, use only one at a time.
Here is the example the breakout signals:
█ Usage:
When the slope is increasing, it indicates an uptrend.
When the slope is decreasing, it indicates a downtrend.
When the slope is moving around zero and choppy, it indicates no specific trend or price is in a range zone.
Uptrend and Range Zone example:
Downtrend example:
Slope peaks on extreme levels can signal a potential trend reversal point.
Breakout of the upper or lower bands can be translated into a trading signal.Indicating that price will probably continue to move in the direction of the breakout.
Favor long setups when the slope is increasing or it is positive and favor short setups when the slope is decreasing or it is negative.
Fits with any moving average you use, e.g., EMA, WMA, MA Ribbon, and more.
█ Alert
Alerts are available for both signal conditions.
█ Recap
Take the time to study price movements alongside this indicator for a deeper understanding.Whether you're a novice or experienced trader, this indicator can come helpful
Hull WavesThe Hull Waves indicator is based on the Hull Moving Averages (HMA), which are special moving averages that stand out for their ability to filter out market noise and offer a clearer view of price trends. Compared to traditional moving averages, HMAs are more responsive yet smoother, allowing traders to capture significant price movements without getting overwhelmed by short-term fluctuations.
The HMAs integrated into Hull Waves provide two distinct perspectives on the price trend:
8-period HMA: This short-term HMA is extremely reactive and closely follows price changes. It is ideal for capturing short-term trading signals while the medium-term 21-period HMA offers a more balanced view of price trends and identifies medium-term trends.
By crossing HMAs, traders can efficiently identify trend reversal points or strong market continuations.
Another feature of the indicator is the “fan” of dynamic lines, which acts as a visual float for price candles, allowing traders to quickly evaluate trading opportunities.
The "fan" or float of dynamic lines represents a visual representation of the candle's price movements. These lines extend from the start point to the end point, like an open fan. This visual approach makes the market dynamics immediately evident.
Strategy:
Long Entry Signal (Buy):
When the Hull Waves range shows a series of upward sloping lines and the Hull Moving Averages (e.g. 8-period HMA) crosses the 21-period HMA upwards, it is a long entry signal.
Confirmation of the signal can come from an increase in trader volume or other supporting indicators.
Place a buy order at the next closing price.
Short Entry Signal (Sell):
When the Hull Waves range shows a series of downward sloping lines and the Hull Moving Averages (e.g. 8-period HMA) crosses the 21-period HMA downward, it is a short entry signal.
Confirm the signal with an increase in trader volume or other relevant indicators.
Place a sell order at the next closing price.
Exit Signal (Closing a Position):
To close a long position, wait for a signal reversal, such as the Hull Moving Averages crossing downwards or a change in the Hull Waves range.
To close a short position, wait for a signal reversal, such as the Hull Moving Averages crossing higher or a change in the Hull Waves range.

Crossover EMMMCrossover EMMM is an indicator that displays the Madrid Moving Averages (EMMM) and detects crossovers (upward crossings) and crossunders (downward crossings) between two moving averages. It uses two input parameters to define the fast and slow EMMM lengths. The script calculates the EMMM values, their changes, and assigns colors based on the change direction. The fast EMMM is plotted in green or red, and the slow EMMM is plotted in blue or red, depending on the change direction. The script also displays triangle shapes below or above the bars to indicate crossovers and crossunders.
The "Madrid Moving Average" (EMMMM) is a type of moving average used in technical analysis to smooth price fluctuations of financial assets, such as stocks or currency pairs. Unlike the Simple Moving Average (SMA), which treats all data equally, the EMMM gives more weight to recent data. This results in the EMMM responding more swiftly to price changes, making it well-suited for identifying short-term trends.
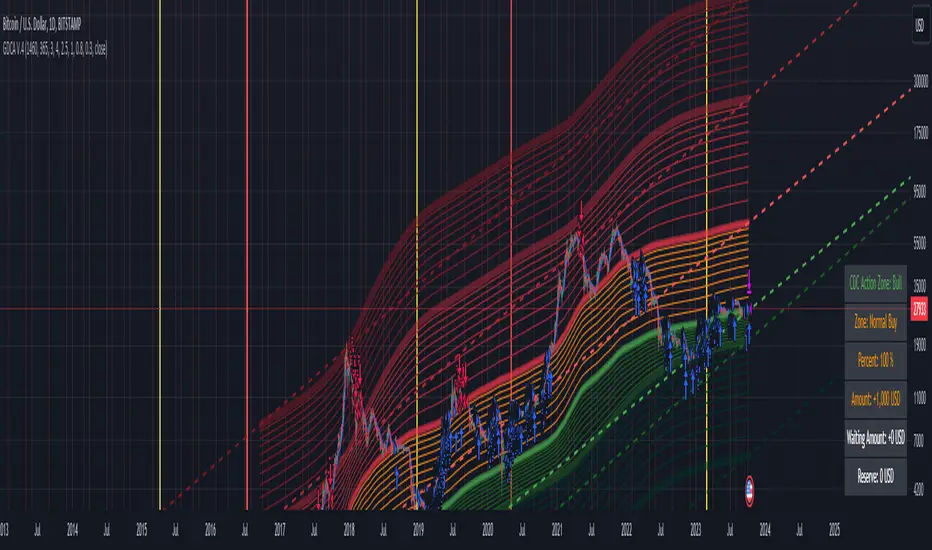
Grospector DCA V.4This is system for DCA with strategy and can trade on trend technique "CDC Action Zone".
We upgrade Grospector DCA V.3 by minimizing unnecessary components and it is not error price predictions.
This has 5 zone Extreme high , high , normal , low , Extreme low. You can dynamic set min - max percent every zone.
Extreme zone is derivative short and long which It change Extreme zone to Normal zone all position will be closed.
Every Zone is splitted 10 channel. and this strategy calculate contribution.
and now can predict price in future.
Idea : Everything has average in its life. For bitcoin use 4 years for halving. I think it will be interesting price.
Default : I set MA is 365*4 days and average it again with 365 days.
Input :
len: This input represents the length of the moving average.
strongLen: This input represents the length of the moving average used to calculate the strong buy and strong sell zone.
shortMulti: This input represents the multiplier * moveing average used to calculate the short zone.
strongSellMulti: This input represents the multiplier used to calculate the strong sell signal.
sellMulti: This input represents the multiplier * moveing average used to calculate the sell zone.
strongBuyMulti: This input represents the multiplier used to calculate the strong sell signal.
longMulti: This input represents the multiplier * moveing average used to calculate the long zone.
*Diff sellMulti and strongBuyMulti which is normal zone.
useDerivative: This input is a boolean flag that determines whether to use the derivative display zone. If set to true, the derivative display zone will be used, otherwise it will be hidden.
zoneSwitch: This input determines where to display the channel signals. A value of 1 will display the signals in all zones, a value of 2 will display the signals in the chart pane, a value of 3 will display the signals in the data window, and a value of 4 will hide the signals.
price: Defines the price source used for the indicator calculations. The user can select from various options, with the default being the closing price.
labelSwitch: Defines whether to display assistive text on the chart. The user can select a boolean value (true/false), with the default being true.
zoneSwitch: Defines which areas of the chart to display assistive zones. The user can select from four options: 1 = all, 2 = chart only, 3 = data only, 4 = none. The default value is 2.
predictFuturePrice: Defines whether to display predicted future prices on the chart. The user can select a boolean value (true/false), with the default being true.
DCA: Defines the dollar amount to use for dollar-cost averaging (DCA) trades. The user can input an integer value, with a default value of 5.
WaitingDCA: Defines the amount of time to wait before executing a DCA trade. The user can input a float value, with a default value of 0.
Invested: Defines the amount of money invested in the asset. The user can input an integer value, with a default value of 0.
strategySwitch: Defines whether to turn on the trading strategy. The user can select a boolean value (true/false), with the default being true.
seperateDayOfMonth: Defines a specific day of the month on which to execute trades. The user can input an integer value from 1-31, with the default being 28.
useReserve: Defines whether to use a reserve amount for trading. The user can select a boolean value (true/false), with the default being true.
useDerivative: Defines whether to use derivative data for the indicator calculations. The user can select a boolean value (true/false), with the default being true.
useHalving: Defines whether to use halving data for the indicator calculations. The user can select a boolean value (true/false), with the default being true.
extendHalfOfHalving: Defines the amount of time to extend the halving date. The user can input an integer value, with the default being 200.
Every Zone: It calculate percent from top to bottom which every zone will be splited 10 step.
To effectively make the DCA plan, I recommend adopting a comprehensive strategy that takes into consideration your mindset as the best indicator of the optimal approach. By leveraging your mindset, the task can be made more manageable and adaptable to any market
Dollar-cost averaging (DCA) is a suitable investment strategy for sound money and growth assets which It is Bitcoin, as it allows for consistent and disciplined investment over time, minimizing the impact of market volatility and potential risks associated with market timing
Donchian MA Bands [LuxAlgo]The Donchian MA Bands script is a complete trend indicator derived from the popular Donchian channel indicator as well as various customizable moving averages to estimate trend direction and build support/resistance levels & zones.
🔶 USAGE
The indicator outputs various elements, the main ones being a lower dynamic zone (blue by default), an upper dynamic zone (in orange by default), and one support and resistance level/zones (red/green by default).
A prominent lower zone is indicative of an uptrend, while a prominent upper zone is indicative of a downtrend. These zones can be used as support/resistance as well.
Support/resistance zones and levels can be used using a breakout methodology or to determine price bounced if a level was tested multiple times.
The indicator contains various modes affecting the output of the indicator, described below.
🔹 Clouds
Clouds return one upper/lower dynamic zone and look/act similarly to a trailing stop. Price over the lower zone is indicative of an uptrend, and price under the upper zone is indicative of a downtrend.
🔹 Upper Band
The upper band mode returns a dynamic zone closer to prices during an uptrend, and farther away during a downtrend.
This band can act as a support during uptrends.
🔹 Lower Band
The lower band mode returns a dynamic zone closer to prices during an uptrend, and farther away during a downtrend.
This band can act as a resistance during downtrends.
🔹 Bands
Bands return both upper and lower zones, the zones are more apparent depending on the price trend direction, with uptrends being indicated by a more visible lower zone, and downtrends being indicated by a more visible upper zone.
Breakout dots are highlighted when price breakout the indicator displayed extremities, and can be indicative of a confirmed trend reversal.
These breakouts can be more effective for trend following during trending markets. Ranging markets might return breakouts highlighting the top/bottom.
🔶 DETAILS
The core of this script is the highest / lowest mean average (MA) value for a given number of bars back ( Donchian lines).
This is repeated a few times with the obtained values.
When Bands are chosen ( Style ) this will be repeated 1 more time.
The type of mean average can be customized ( Type MA ), as well as the number of bars back ( Length ).
Depending on the choice of bands ( Style ) the script will focus on certain area's of interest.
When the option Clouds , Upper band or Lower band is chosen, an extra feature, support/resistance (S/R), will be shown.
These color-filled areas are visible when there is a difference between the 2nd and 3rd highest/lowest values.
The lines/areas can be used for stop loss, entry, exit,...
You can set the type of MA and Length separately ( Settings -> S/R ).
If you don't need this feature, simply set Type ( Settings -> S/R ) -> NONE
The shape sometimes resembles triangles, indicating a potential direction
Default the average of the highest and lowest values is plotted (Style -> Mid Donchian)
This can act as potential support/resistance or visualization of the trend, the mean average is not plotted but can be (Style -> MA)
🔹 Note
When the option Bands is chosen, an indication is plotted when the closing price breaks above the highest band or breaks below the lower band. This isn't necessarily a buy/sell signal, it is merely a signal that these lines are broken.
Users should decide on their own how they use the bands/lines/areas as entry, exit, trailing stop, stop loss, profit taking,...
🔶 SETTINGS
🔹 Bands
Style: Clouds (default), Upper band, Lower band, Bands
Type MA: choose between SMA, EMA, RMA, HullMA, WMA, VWMA (default), DEMA, TEMA, NONE (off)
Length: Length of moving average and Donchian calculations (default 20)
Colour Bands
🔹 S/R (Support/Resistance, visible with Clouds, Upper band or Lower band)
Type MA: choose between SMA, EMA, RMA, HullMA, WMA, VWMA (default), DEMA, TEMA, NONE (off)
Length: Length of moving average and Donchian calculations (default 20)
Colour S/R

blackOrb PhaseMA matrix for identification of bullish/bearish macro phases and strategy implementation through the definition of effective MA lengths.
Moving Averages, when conventionally employed in either single-line or dual-line configurations, come with inherent limitations that hinder their effectiveness in capturing the complexities of varying market conditions.
In response to this challenge, blackOrb Phase utilizes a combination of quantitative and relational MA analysis techniques, providing users with a more comprehensive understanding of market trends and a granular derivation of price-dynamic phases by using the following features:
I. MA matrix to identify effective MA lengths for strategy implementation
II. Stochastic coloring for trend tracking and macro phase identification
III. Diverse MA options for enhanced analytical flexibility
Technical Methodology
I. MA Matrix to Identify Effective MA Lengths for Strategy Implementation
Central to the methodology is the ability to identify optimal MA lengths for effective strategy implementation. blackOrb Phase utilizes a matrix of multiple MAs, each characterized by unique parameters, to establish a relational grid structure. By systematically examining price data within predefined vertical segments, this matrix offers a linear multi-level modulation of historical price data, providing access to up to 500 prior data instances. This methodology enhances the analysis of both micro price dynamics shifts and bullish or bearish macro trend changes. It has been empirically validated that this approach can assist users to refine their analysis and adapt to varying market conditions*.
Crossings of MA lines with different colors signify potential shifts in price dynamic phases. When green MA lines intersect red MA lines, it suggests a higher likelihood of a macro trend change (bullish or bearish market environment). Conversely, when green MA lines cross over orange MA lines, it indicates a lower probability of a macro trend change but still suggests a potential micro trend shift. This micro trend shift can be viewed as a subordinate price dynamic change within the broader macro trend.
*Source: Prof. Pätäri, Eero. "Performance of moving average trading strategies over varying stock market conditions." Applied Economics, vol. 46, no. 24, 2014, pp. 2851-2872.
II. Stochastic Coloring for Trend Tracking and Macro Phase Identification
To provide a comprehensive view, this indicator includes a stochastic tracking feature, displayed through an intuitive single-color system across the entire matrix grid. The color scheme transitions from red lines, indicating the beginning of bearish trend phases, to green lines, indicating the initiation of bullish trend phases and vice versa. The greater the number of lines with the same color, the stronger the trend.
This tool enhances price trend monitoring, allowing traders not only to track their initiation and continuation but also to confirm trend culmination. By observing color shifts from red/green lines, traders can assess the sustainability and persistence of broader macro trends.
Note: Stochastic coloring aids in probability-based orientation and provides valuable insights for trading strategy implementation. It is most effective when used in conjunction with other analysis and risk management techniques.
III. Diverse MA Options for Enhanced Analytical Flexibility
Users have the flexibility to choose from 14 different MA types (e.g. including ALMA, KAMA, T3, VWMA, TriMA and ZLEMA). This versatility allows for precise configurations tailored to specific market conditions.
For example, among the array of these 14 MA alternatives, VWMA (Volume Weighted MA) stands out as a suitable implementation choice for integrating volume data. It goes beyond the scope of a simple moving average, considering both price and volume in its calculation, as shown in the following formula:
(C1 x V1 + C2 x V2 + ... + Cn x Vn) / (V1 + V2 + ... + Vn)
Alongside this variety of MA types, users can select from a range of OHLC combination options (open, high, low and close price data), further enhancing analytical flexibility.
Note: While these choices offer substantial flexibility, they also require a solid understanding of the various MA types and data combinations, making risk management essential.
Note on Usability
blackOrb Phase can have synergies with blackOrb Price and blackOrb Zone as all three indicators combined can give a bigger picture for supporting comprehensive and multifaceted data-driven trading analysis.
This tool was meticulously created to serve as an additional frame for the seamless integration of other more granular trading indicators. This indicator isn't intended for standalone trading application. Instead, it is serving as a supplementary tool for orientation within broader trading strategies.
Irrespective of market conditions, it can harmonize with a wider range of trading styles and instruments / trading pairs / indices like Stocks, Gold, FX, EURUSD, SPX500, GBPUSD, BTCUSD and Oil.
Inspiration and Publishing
Taking genesis from the inspirations amongst others provided by TradingView Pine Script Wizard Kodify, blackOrb Phase is a multi-encompassing script meticulously forged from scratch. It aspires to furnish a comprehensive approach, borne out of personal experiences and a strong dedication in supporting the trading community. We eagerly await valuable feedback to refine and further enhance this tool.
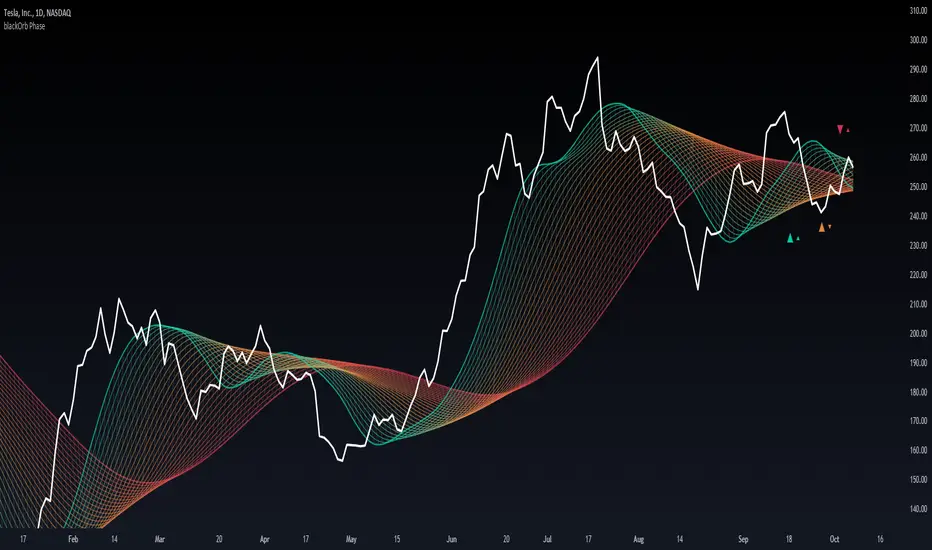
2Mars strategy [OKX]The strategy is based on the intersection of two moving averages, which requires adjusting the parameters (ratio and multiplier) for the moving average.
Basis MA length: multiplier * ratio
Signal MA length: multiplier
The SuperTrend indicator is used for additional confirmation of entry into a position.
Bollinger Bands and position reversal are used for take-profit.
About stop loss:
If activated, the stop loss price will be updated on every entry.
Basic setup:
Additional:
Alerts for OKX:
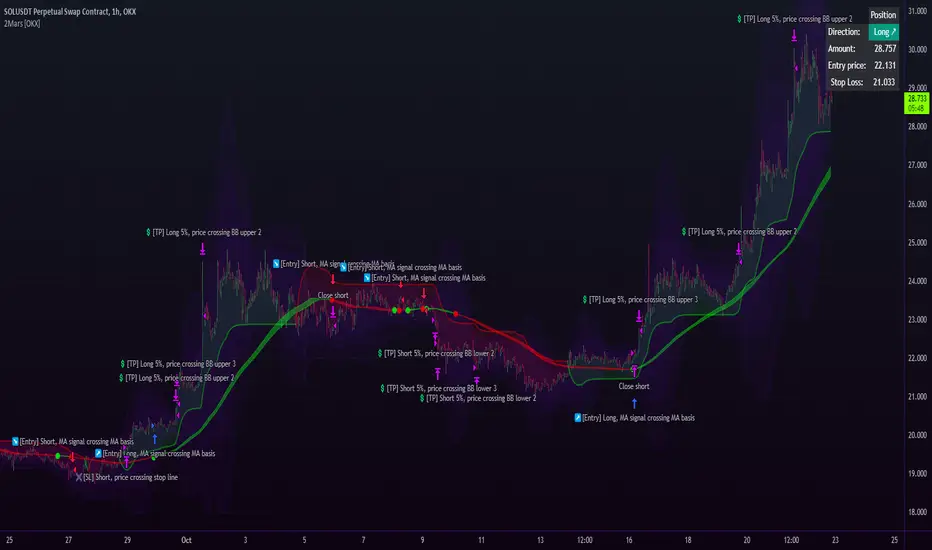
Ehlers DecyclerJohn F. Ehlers introuced Decycler in his book "Cycle Analytics for Traders", chapter 4.
The decycler is designed to remove the influence of shorter cycle fluctuations, resulting in an output that closely resembles a one-pole low-pass filter.
A standout feature of the decycler is its notably minimal lag. The most extended cycle elements experience a delay of less than five bars. When considering a frequency of 0.05 cycles per bar (equivalent to a 20-bar cycle period), the lag approximates 1.5 bars. Components with a higher frequency face even lesser delays. Consequently, any higher-frequency variations that pass the filter's attenuation align closely with the price fluctuations. This makes the decycler an optimal "immediate trend detector," giving a true depiction of the data's trend.
While the SuperSmoother filter can yield a comparably smoothed output, the decycler typically exhibits less lag when the two are juxtaposed. It's worth noting that the decycler operates as a one-pole filter, implying it doesn't have the best filtering capabilities. It's not advisable to use the decycler as a smoothing filter to eliminate aliasing disturbances. Instead, its application should focus on generating an immediate trend representation, especially when choosing a larger cutoff period. The broad cutoff period equips the decycler with the ability to reduce aliasing disturbances, given that it's significantly distant from the Nyquist frequency.
There are already several decycler indicators on Tradingview, but I like to structure the code and highlight the main components as functions rather than hiding them in the code. I hope this is useful for those who are starting to learn Pine Script.

Anchored Moving Average By Market Mindset - Zero To EndlessAnchored Moving Average?
An anchored moving average (AMA) is created when you select a point on the chart and start calculating the moving average from there. Thus the moving average’s denominator is not fixed but cumulative and dynamic.
In this indicator, I've provided three different types of Anchored Moving Averages, viz., WMA, SMA and VWAP.
WMA is relevant if big moves are there.
SMA is relevant if volume data is not to be considered or if it is not available.
VWAP is the standard anchored MA, which is most commontly used. Is consider the volume data along with the price move.
In this indicator, Auto anchor is time based anchor. A trader can opt for Pivot Type Anchor or Volume Type Anchor or some higher resolution based anchor too. The length of the pivot lookback can also be changed by the user.
It can be used for intraday, swing trading and even for technical based investment purpose.
Signal to Noise TrendSignal to Noise Ratio
The Signal to Noise Ratio or SNR is used to assess the quality of information or data by comparing the strength of a useful signal to the presence of background noise or random variations.
In Finance the SNR refers to the ratio of strength of a trading signal to the background noise. A high SNR suggest a clear and reliable signal, meanwhile a low SNR indicates more noise (random fluctuations, volatility, or randomness).
Signal To Noise Trend
This indicator basically calculates the signal to noise of returns and then gets the Z-Score of the signal to noise ratio to find extremes levels of signal and noise. The Lines basically are standard deviations from the mean. 1,2,3 Are standard deviations same with the -1,-2,-3 Lines.
The signal is expressed as the positive Z-Score value, and the Noise is the negative Z-Score Value.
The moving average enhances the indicator ability to display the trend of returns and the trend strength. It provides a smooth representation of the Signal to Nose Ratio values.
There are more trending conditions when there is a higher signal, and there is more "ranging" conditions when there is more noise present in the markets.
The Standard deviations help find extreme levels of signal and noise. If the noise reaches the standard deviation of -3 then that means that there is a extreme negative deviation from the mean, and this would be a rare occurrence, with a lot of noise. This could indicate a potential reversion in market states, and could be followed by a trending move.
Another example is that if the Z-Score value reaches a Standard deviation of 3, this could mean that there is extremely strong and rare signal, and could potentially mean a change to a more noisy environment soon.